Inverted crossover resonance within one Zeeman manifold
Abstract
We carry out investigations of inverted crossover resonances in -driven four-level systems where can be zero. Through the use of sub-Doppler frequency modulation spectroscopy of the transition in 171Yb the resonance becomes manifest. The centre-frequency is inherently insensitive to first-order Zeeman shifts and equates to the two-level resonance frequency in the absence of a magnetic field. A rate equation model is used to help validate the nature of the resonance. Optical frequency measurements of the hyperfine line recorded over two months demonstrate a statistical uncertainty of . The inverted crossover resonance found with the line is used for 556 nm laser frequency stabilization, which is an alternative means when applied to magneto-optical trapping of 171Yb.
pacs:
42.62.Eh; 42.62.Fi; 32.30.Jc; 37.10.De; 32.10.Fn1 Introduction
Explorations in degenerate Fermi gases [1, 2, 3], quantum many body simulations with lattices [4, 5, 6], and atomic clocks [7, 8, 9, 10, 11] each make use of neutral ytterbium. A common approach to producing atomic cloud temperatures at a few tens of microkelvin is to employ two stages of laser cooling with 399 nm and 556 nm light, where the latter exploits the inter-combination line. The natural linewidth of which is 184 kHz and has a corresponding Doppler cooling limit of 4.4 K. To generate frequency-stable 556 nm light a method often employed is stabilization by locking to a high- optical cavity [12, 13]. Rather than take this approach, and despite the low scattering rate associated with the intercombination line, we employ sub-Doppler spectroscopy upon a thermal Yb beam that leads to a Zeeman slower and magneto-optical trap. In doing so, we have identified an inverted Lamb dip with the and hyperfine transitions in 171Yb. This was first noted recently in [14], where an emphasis was made in relation to its applicability to laser cooling of 171Yb. Here we provide a detailed description of the nature of the resonance, but also show the suitability of the line as an effective frequency reference. For the two hyperfine lines the application of a dc magnetic field transforms a two-level scheme into a four-level scheme, with degeneracy only marginally lifted in the ground state. The atoms are excited through -transitions, while the de-excitation process completes a simple optical pumping scheme. The enhanced absorption is as an inverted crossover resonance (ICR), where the principal lines involved in the crossover are transitions to symmetrically separated Zeeman substates. In the case of 171Yb111To distinguish the two 171Yb hyperfine lines we will only state the upper value for the sake of simplicity. this appears to be the first instance of an inverted crossover resonance where . While the ICR for 171Yb is successfully used to stabilize the frequency for laser cooling, the 171Yb line also acts as a simple and reliable frequency reference with statistical and systematic uncertainties in the 10 kHz range. In contrast to an ordinary crossover resonance where the signal is limited to the summed strength of the principal lines, the ICR magnitude can be sizeably larger than this factor of two, since the saturation behaviour of (closed) two-level systems no longer applies. We note that such resonances are rarely observed on atomic beams because the natural linewidth of the transition needs to be below a few megahertz (for a sufficiently collimated atomic beam). By carrying our similar measurements with 173Yb and detecting extremely weak ICRs, we find that such ICRs are most apparent when .
In this paper we open with a description of the sub-Doppler spectroscopy on the Yb intercombination line and commence with an example of an ordinary crossover resonance, before showing results relating to, and describing, the inverted crossover resonance. We develop a four-level rate equation model that adequately describes the behaviour seen experimentally. Section 4 describes how the ICR is used for laser frequency stabilization, along with details about absolute frequency measurements of the 171Yb line. We complete the discussion with a test of temperature versus frequency instability in a dual-colour MOT using the 171Yb line and the ICR.
2 Sub-Doppler spectroscopy
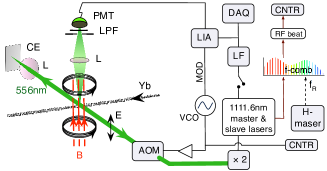
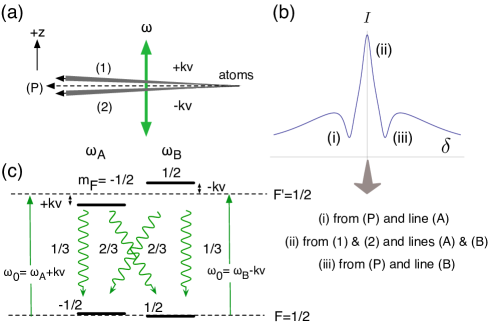
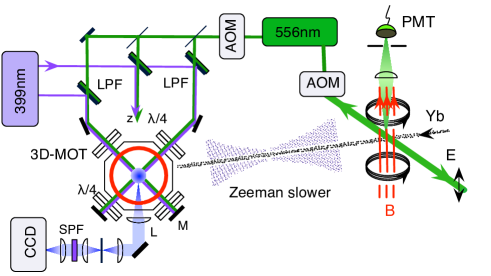
The scheme for the sub-Doppler frequency modulation (FM) spectroscopy is illustrated in Fig. 1, where a retro-reflected 556 nm beam passes perpendicularly through the ytterbium atomic beam and the 556 nm fluorescence is detected by a photo-multiplier tube. A lens-mirror combination (cat’s eye) is used to produce the retro-reflection. The scheme is similar to that used for many saturated absorption spectroscopy schemes [15, 16], however, given that we observe enhanced absorption, rather than saturation, we refer to the scheme as sub-Doppler FM spectroscopy. Frequency modulation at 33 kHz is applied to the light via an acousto-optic modulator (AOM) allowing for harmonic detection with a lock-in amplifier. Unless otherwise mentioned . Helmholtz coils set the magnetic field in the vertical direction. The polarization, , of the 556 nm light is set either parallel to that of or perpendicularly. For the cases of enhanced absorption, is parallel to , which is the case for most of the results presented here. The intensity profile of the 556 nm beam is elliptical with the major axis (4 mm in diameter) aligned with the atomic beam. The 556 nm light is produced via resonant frequency doubling of 1112 nm light, where a bow-tie type doubling cavity has at its prime focal point an 18 mm length periodically poled potassium titanyl phosphate crystal for the nonlinear conversion, and comprises mirrors with 75 mm radius of curvature. The 1112 nm light is sourced from a commercial fibre laser that injection-locks a ridge waveguide diode laser (Eagleyard EYP-RWL-1120) for amplification to 45 mW [17].
An effusion cell heated above 400∘C produces a beam of Yb atoms (with natural isotopic abundance) that escape a reservoir through a trio of stainless steel tubes with a diameter of 1 mm and length 20 mm. Any accumulation of Yb within the tubes is likely to increase the aspect ratio and reduce the angular divergence of the atoms. No further collimation techniques are performed. The fluorescence from the atom-light interaction passes through a spatial filtering scheme to minimize stray light (along with an edge filter to block scattered 399 nm light from a Zeeman-slower beam). The fast-linewidth of the 556 nm light we presume to be 240 kHz, based on the manufacturer’s linewidth specification for the 1112 nm fibre laser (thus, slightly larger than the natural linewidth of the line). Frequency tuning of the 556 nm light is carried out via a piezo transducer in the 1112 nm laser. We calibrate the frequency tuning by use of a frequency comb that is referenced to a hydrogen maser. Further comments regarding the comb are made below when characterizing the frequency instability of the light locked to the ICR.
Crossover resonances are commonly observed in saturated absorption spectroscopy. Inverted crossover resonances are less frequently observed, but their occurrence has been known for several decades [18, 19, 20]. The element that is unique here is that the inverted crossover resonance arises from the Zeeman splitting of a transition. Crossover resonances are most easily observed in vapour cells where there is a full range of velocity components. Atomic beams, on the other hand, have a very restricted range of transverse velocity; hence the possibility of observing crossover resonances is very much reduced.
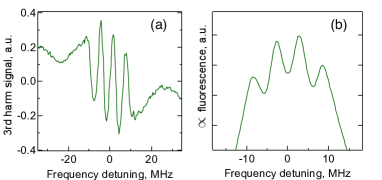
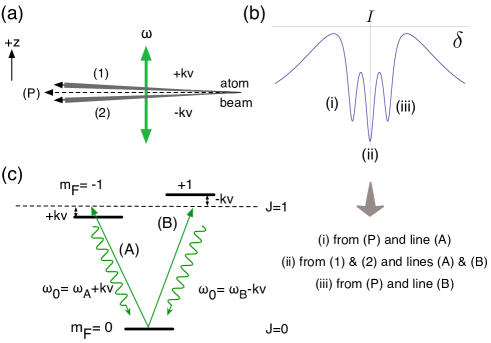
Crossover resonances preserving the saturated absorption can be produced with the bosonic ytterbium isotopes (even mass number) when the excitation occurs through -transitions. This is made possible when and are orthogonal to each other (i.e., with linear- polarization[21]. An example is shown in Fig. 2 taken for 172Yb and the line. Here the nuclear spin (for isotopic and hyperfine line frequency separations for the intercombination line in ytterbium see [22, 23, 24, 14]). Fig. 2(a) is the third harmonic output of the lock-in amplifier and Fig. 2(b) is the corresponding absorption signal (produced by integrating (a)). The outer dips are produced by the transitions, and the central dip is the crossover resonance. An explanation for the line spectrum is summarized in Fig. 3. As is commonly observed, the crossover resonance is stronger than the principal lines because there are two groups of atoms contributing to the signal, as opposed to one. This is portrayed in the upper left panel of Fig. 3. The principal lines are those generated by the atoms marked (those flowing perpendicularly to the 556 nm laser beams), and the crossover resonance is produced by the combined subsets of (1) and (2). Note, this image should not be taken too literally, because the subsets are in velocity space, while the image is drawn in a spatial sense. The transitions in this case are closed, having no alternative pathways. In the measurement of Fig. 2 the 556 nm combined beam intensity was 160 (where the saturation intensity is 1.4 W m-2), thus causing artificial broadening of the lines. Also affecting the resonance widths is the strength of the modulation applied to the 556 nm light. This is discussed more below. The Zeeman line separation, here at 0.28 mT, is consistent with the first order Zeeman shift of 21 MHzmT-1 for the substates (which applies to all the bosonic isotopes).
3 Inverted crossover resonance: measurement and modelling
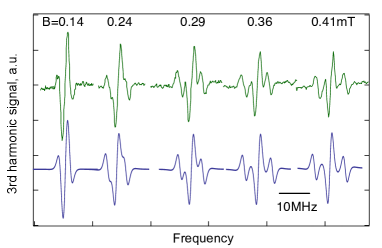
The same experimental arrangement was applied to the 171Yb atoms (with ), except with parallel to , ensuring that only -excitations occur. A series of spectra are shown in Fig. 4 for the line with each trace recorded for a different bias magnetic field. The upper traces are experimental data and the lower traces are lineshape models. A similar sequence occurs when the direction of the bias is reversed (for the case of zero field, see [14]). One first notices the Zeeman components with at 0.24 mT and at slightly higher fields they are easily resolved. Note the opposing slopes of the main discriminator and the Zeeman components, indicating that the crossover resonance is inverted. The mean width across the main discriminator for this set of measurements is 1.7 MHz, which is dominated by intensity broadening the intensity having been set to 90 , and the effect of strong frequency modulation. The applied modulation amplitude was 2 MHz. At zero -field there can be a weak saturated absorption signal arising because the four-level structure collapses into a two-level scheme. This is more readily observed at higher intensities. At low intensities (50 ) the ICR may remain, but is very much suppressed. At 0.12 mT the ICR reaches its maximum contrast and from here the sequence in Fig. 4 follows.
Before giving a fuller description, the resonances can be modelled in a basic way with a sum of Lorenztian lineshapes: two separate saturated lines and a central inverted line. The Lorenztian function has the form: , where is the frequency detuning, is the full-width-half-maxium and we denote for the Zeeman shift of the magnetic sublevels, with the Landé g-factor and the Bohr magneton. Representing the signal from the lock-in amplifier with third harmonic detection we have,
| (1) |
The ratio, , between the strength of the inverted line to the principal (Zeeman) lines is treated as a free parameter here. Such an assumption is not used below in a more complete description of the four-level system. For both the experimental data and the summed Lorentzian model the third derivative is shown in Fig. 4. One sees a clear correspondence between the two sets of traces, with similar features appearing as the Zeeman components separate. For the 171Yb line here MHzmT-1, and , notably larger than two.
A partial explanation for the inverted crossover resonance is seen in Fig. 5. A key aspect is the four-level structure and two branching routes for each upper Zeeman level (the ground state Zeeman splitting is times weaker than that of the upper state splitting). The branching ratios from the upper states are readily calculated for the 171Yb and 171Yb systems [25], given that mixing with the state permits the transition to occur. Fig. 5 shows the branching ratio for the hyperfine line. Two subsets of atoms combine to produce the ICR, each with the same absolute value of Doppler shift (), but opposing sign. For the excitation phase the 556 nm light polarization is parallel to the magnetic field, implying . When the optical frequency lies midway between the upper state separation then both subsets of atoms participate maximally in the absorption and cycling process (and is the mean of and ). Atoms (1) with Doppler shift interact with the beam, exciting transition (B) such that . Alternatively, these atoms can interact with the beam, exciting transition (A), where . Whichever decay channel occurs there is always the possibility for re-excitation, hence atoms are not lost to a dark state. The situation is reversed for atom subset (2). The width of the dispersive curve reduces to 800 kHz when the 556 nm beam intensity is 30 (there are other factors influencing the width that are discussed below). For the most probable velocity of 330 m s-1, this corresponds to 1.4 mrad of separation between the two diverging sets of atoms responsible for the inverted crossover resonance.
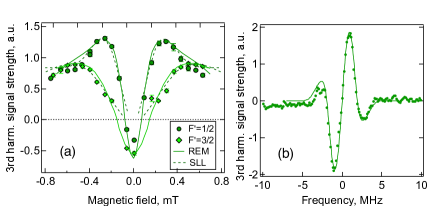
The strength of the resonance exhibits symmetrical behaviour for opposing magnetic field directions, as shown in Fig. 6(a). The vertical axis represents the size of the discriminator from the output of the lock-in amplifier, again recorded with 3rd harmonic detection. At zero -field the Zeeman sublevels remain degenerate, thus acting like a two-level system and the usual saturated absorption behaviour occurs. Applying the -field in either direction causes the Zeeman level splitting and two decay channels to occur for each excited Zeeman state. The situation is similar for the line (there is a frequency separation of 5937.78 MHz between the two 171Yb hyperfine lines); however, there is a reversal of branching ratios where the channel de-excitation occurs with probability and the channel de-excitation occurs with probability. The maximum signal strength and contrast is greater for the line than the line. The reduction in signal strength at higher -field takes place as the two Zeeman lines separate (also seen in Fig 4). The Zeeman shift of 14 MHzmT-1 for is twice as strong as that for ; hence the lines become resolved at lower fields for the former and the main discriminator strength falls away more rapidly with -field. The dashed lined curve-fits away from saturation (of Fig. 6a) are derived from the simple summed-Lorentzian model described above (and cannot reproduce saturation). The abscissa scaling between the and data fits precisely the factor of two ratio of the Zeeman shifts. The peak-to-peak values versus magnetic field in Fig. 4 has a slightly different trend compared to the data in Fig. 6(a), with respect to the data. The main reason being that the intensity used for Fig. 6(a) was 180 , thus broadening the lines and influencing the progression seen in Fig. 4 (the frequency modulation amplitude was also twice as strong).
To encompass the full range of behaviour of the four level system a rate equation model was developed to make comparisons with the experimental data. With a 4 mm laser beam width (in the direction of the flow of atoms) and a most probable velocity of 330 m s-1, the atomic transit time across the beam is estimated to be about 12 s, which is large compared to the lifetime of the level (0.86 s). To a good approximation the atomic evolution should reach the steady-state, even at high saturation. In this case, the result of the laser-atom interaction can be estimated by the result of a rate-equation model.
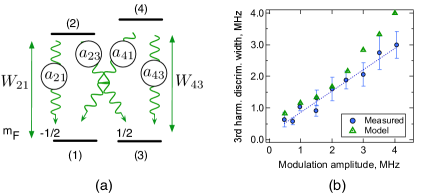
A set of rate equations is solved describing population changes in a four-level system, where the fractional population of the four levels is , {1,4}. The labelling of the states is shown in Fig. 7(a). In steady state, the rate equations for a polarized light become,
| (2) |
where is the spontaneous rate of emission, is the pumping rate of the transition with levels , are the relaxation branching coefficients and is a relaxation term introduced to account for the finite interaction time as the atoms transit the laser beams. The ground states will have equal population before the interaction (denoted ) and without any loss of atoms the sum holds. The solutions for are given in Eq.(16) in the Appendix.
The driving rates are found from,
| (7) |
where is the on-resonance saturation parameter, is the light-atom scattering cross section (on resonance), is the wave number and is the combined line-width associated with spontaneous emission, transit time and laser frequency noise, , with the laser linewidth. is the amplitude modulation term which will be defined more completely below. represents the number of photons per unit area at the saturation intensity. The frequency detuning terms account for the Zeeman shift through,
| (8) |
where is the laser frequency detuning from the centre of resonance in null magnetic field, , is the Landé factor of the level , and is the reduced Planck constant. We note the ground state splitting is negligible in comparison to the upper state splitting. The laser frequency is sinusoidally modulated and the fluorescence signal is detected by means of third harmonic output of a lock-in amplifier. The modulation frequency, , is fast in comparison to the mean laser-frequency scanning rate, i.e. the detuning, , is approximately constant during a modulation period, so that we can insert the modulation term in the steady-state equations. The term is the frequency modulation amplitude (in rads-1) and is the modulation term’s phase with the time. In this case, following from [26, 27, 28], the -th Fourier-series coefficient of the modulated signal forms the signal yielded by the lock-in detection employing in-phase detection at the -th harmonic of the modulation frequency. The combined signal is evaluated through,
| (9) |
where the rate equations are solved in a stepwise manner assuming a top-hat transverse velocity distribution truncated at and . The equation incorporates an evaluation of the photon fluorescence rate produced by atoms in the two upper states. We note that Eq. (9) remains valid if the modulation amplitude is not large in comparison to the intensity broadened linewidth. Figure 7(b) provides an example of resonance width versus frequency modulation amplitude at and mT for both measurement and model. The two agree reasonably well until a modulation amplitude of 2.5 MHz is reached. We choose m s-1, which is well beyond the Doppler components that compensate for the Zeeman shifts explored here.
The relaxation branching ratios of Eq. 2 can be summarised with and . For , and for , . These branching ratios may not be exact, since the intercombination line is a spin-flip transition (that is permitted through mixing with the state). Fig. 6(b) shows the spectrum for line with third harmonic detection, , mT and a frequency modulation amplitude of 2 MHz. The solid (green) line is generated by the rate equation model for the same magnetic field, intensity and modulation amplitude. Only vertical scaling is applied to the computed result. The agreement between the experimental data and the model lends credence to its validity.
The comparison between model and data is also shown in Fig. 6(a). The solid lines are the computed signal strengths for the and lines. The input parameters match those of the experiment, where and the frequency modulation amplitude is 4 MHz. The model shows the same characteristic behaviour across the full magnetic field range: from saturation at and near zero -field, to the reverse peaks away from zero field. However, we have applied independent scaling between the data and model for the two hyperfine lines. The model creates different ICR strengths for the two hyperfine lines because of the different branching ratios, but the ratio is not in accord with that observed in the experiment. In the model the resonance is 15 % stronger than the ICR. This difference in ratio may be because the model does not take into account the spatial dependence of fluorescence. The quantity of fluorescence heading in the direction of the PMT differs depending on whether the released radiation is or polarised [29]. For the two cases the ratio of -to- polarised light changes depending on the branching ratios. Another possible, but unlikely, factor influencing the behaviour of the line shape is the presence of the 173Yb line, which lies only 2.6 MHz away (the 173Yb line is approximately one sixth the strength of the 171Yb line).
4 Frequency stabilization
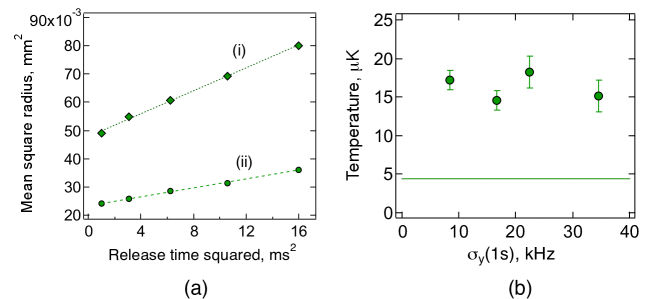
The ICR with the FM spectroscopy produces a dispersive signal that one can use to stabilize the 556 nm laser frequency. The correction signal is sent to the 1112 nm fibre laser through a piezo transducer with a servo bandwidth of approximately 20 Hz (deliberately set low to avoid adding technical noise at higher Fourier frequencies). We assess the frequency instability by counting the frequency of the beat generated by mixing 1112 nm light with the adjacent element of a frequency comb (whose mode spacing is referenced to a H-maser signal). Here we consider first harmonic detection in the FM spectroscopy as it confers approximately a factor of two improvement in the frequency instability compared with third harmonic detection (and is relevant for the laser cooling below). The frequency instability for an atomic flow rate of through the beams is shown in Fig. 8(a). This result is for the 171Yb hyperfine line. The left ordinate is the instability made fractional with respect to the carrier frequency of the 556 nm light. The instability reduces with a dependence out to about 600 s. At 50 ms, which is the transfer duration for the second stage of the MOT, the instability is 45 kHz, and is well below the natural linewidth of the line (184 kHz). The atomic flow rate was estimated by recording the dc level of the PMT (registering 556 nm photons), accounting for the collection efficiency and applying the standard scattering rate equation (for zero frequency detuning). The uncertainty for is 50 %. Based on particle flow rates through a cylindrical tube and accounting for atomic beam divergence in the vertical plane, should be an order of magnitude greater. The difference may be explained if Yb has accumulated to the sides of the tubes and reduced the aspect ratio.
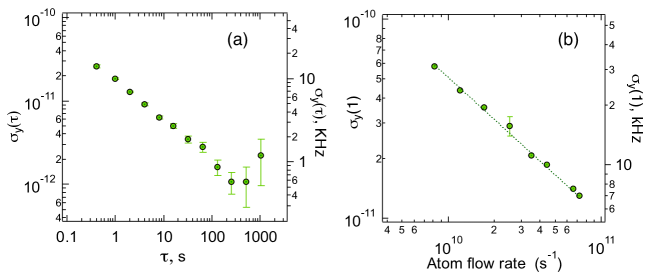
Further improvements in frequency instability can be produced by increasing the atomic flow rate as seen in Fig. 8(b). A power law fit gives a dependence of . This rate of fall is likely a coincidental combination of noise terms proportional to , with some constant. We do not observe a change in frequency instability with changes (by an order of magnitude) in optical intensity, suggesting that photon shot-noise is not a limiting factor, thus an unidentified noise source in the detection system contributes to the instability. The falling frequency instability is a useful trait for lasers employed in laser cooling. Moreover, by locking to the line one has immediate access to the frequency detuning (unlike in the case of locking to an optical cavity).
The symmetry of the ICR is again apparent when the line-centre frequency is measured as a function of magnetic field. The laser is locked to the centre of the dispersive curve and frequency counting of the IR beat is made for approximately 100 s at each -field setting. On this occasion we consider the 171Yb hyperfine line. Fig. 9(a) shows the mean line-centre frequency, , versus magnetic field. The frequency variations are constrained to within kHz across 1.5 mT (or 15 G). In fractional terms this is , demonstrating that the first order Zeeman shift is efficiently cancelled with this inverted crossover resonance (and the second order dependence is not apparent). Other systematic shifts have been investigated for the 171Yb line. One can measure the frequency dependence on the separation between the beam and the optical axis of the cat’s eye, both in the direction of the atomic beam and in the vertical direction. In both cases there is a monotonic shift that is linear over small displacements, as seen in Fig. 9(b). In the horizontal plane the shift is 26 kHz mm-1. Zero displacement is made evident by observing the signal-to-noise ratio of the signal, or equivalently the Allan deviation of the locked laser frequency. Alignment between the 556 nm beams and the optical axis can be determined to within mm, which equates to an uncertainty of kHz. Displacing the lens in the vertical direction creates a linear frequency shift over mm from the optical axis. A displacement greater than 0.2 mm is relatively easily identified and the associated systematic shift is 13 kHz. We note that for larger ranges of displacement in the direction of the atoms the frequency variation can exhibit a quadratic dependence, the curvature of which may depend on the angle between the 556 nm beams and the optical axis of the cat’s eye. Shifts associated with the wavefront curvature were tested by changing the lens-mirror separation in the cat’s eye. When set to the focal length of the lens the shift is less than 3 kHz mm-1.
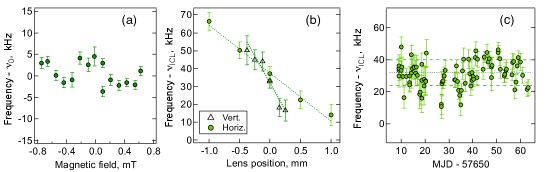
The AC Stark shift was measured by varying the 556 nm beam intensity over a range of where is the on-resonance saturation parameter (). The shift is almost indiscernible at kHz W-1 m2. For the absolute frequency measurements the 556 nm intensity is 80 W m-2 (for the two beams), thus the associated correction required is smaller than the statistical variations between repeated measurements. The insensitivity to magnetic field and low sensitivity to other shifts prompted the recording of (semi-) regular measurements of over an extended period of time as a test of the repeatability. Measurements were taken over a period of two months and are shown in Fig. 9(c). The mean optical frequency from this series is kHz, where the standard deviation from the weighted mean is 8 kHz (which is 5 % of the natural linewidth). The reduced for the set is 2.1. Through the quadratic sum of uncertainties associated with systematic shifts (mentioned above) the total systematic uncertainty is 23 kHz. Also included is an uncertainty associated with servo error (more specifically, identifying the centre of the line) [30]. We note this overall uncertainty is more than an order of magnitude smaller than the previous most accurate measurement of a Yb intercombination line frequency [31]. While not at all competitive with cold-atom atomic frequency standards, the 171Yb ICR provides a simple and effective thermal beam frequency reference. The 171Yb line has the advantage that it is free from neighbouring isotopic lines that can perturb the lineshape, unlike the 171Yb line. Although calibration of the H-maser was not carried out during this measurement run it is not foreseen to be more inaccurate than , based on previous calibrations against UTC (coordinated universal time), National Measurement Institute, Sydney. In support of this, absolute frequency measurements of the 171Yb (clock) transition by use of the H-maser were also recorded in conjunction with some of the line measurements. The mean deviation from previously published values of the clock transition frequency is less than 10 kHz. The method used for the clock line frequency measurements was reported in [31], though notably, we now perform all the the measurements free of light shifts associated with the MOT.
In the case of the 171Yb ICR, the frequency stabilized 556 nm light is used to cool atoms in a dual-colour magneto-optical trap. The experimental set-up is depicted in Fig. 10, where the sub-Doppler spectroscopy is carried out prior to the Yb atoms reaching a Zeeman slower. The first-stage cooling is performed with 399 nm light on the transition, then second stage cooling is carried out with 556 nm light driving the intercombination line. Further details about the magneto-optical trap are described in [14]. In the FM scheme for the laser lock we use first harmonic detection as it grants a higher signal-to-noise ratio and improved frequency instability, by at least a factor of two. We performed atomic cloud temperature measurements as a function of the 556 nm light frequency instability, where the temperature was estimated based on the expansion rate of the cloud and imaging onto a CCD. Examples of versus data are shown in Fig. 11(a) for two isotopes. The upper (lower) trace is for 172Yb (171Yb) with a corresponding temperature of 46 K (16 K). The frequency instability was varied by changing the atomic flow rate through varying the oven temperature. Over the instability range that could be tested, seen in Fig.11(b), we do not observe any influence on the cloud temperature, indicating that the remaining frequency fluctuations are not responsible for the temperature limit. The cause for the limitation is not known, though we note that the K range is a common limit for the cooling of fermionic Yb isotopes; slightly above the Doppler cooling theory limit of 4.4 K.
5 Conclusions
We have presented results in relation to the recently discovered crossover resonances in neutral ytterbium, notably the inverted crossover resonances (ICRs) produced with the two hyperfine lines in 171Yb. They arise through sub-Doppler spectroscopy of the intercombination line ( kHz) when the atoms are formed into a thermal beam. This appears to be the first instance where the ICR occurs with and the principal lines belong to the same Zeeman manifold. The isotope creates a circumstance where only two narrow velocity groups are involved the generation of the resonance. The ICR is apparent when the separation of the principal lines ranges from 1 MHz to tens of megahertz, which is unlike the case of ICRs in gas cells, where the separation is typically hundreds of MHz [32]. There is a high degree of symmetry in the line profiles due to the nature of the phenomenon and this is confirmed by use of a four-level rate equation model. The enhanced absorption is particularly striking in the case of the 171Yb hyperfine line. By frequency locking to the centre of the ICR, one can generate a frequency reference that is independent of the Zeeman shift to first order. We observe fractional variations less than over a magnetic field range of mT. Hence, the ICR for 171Yb gives a very good representation of line-centre at zero -field. Absolute frequency measurements of the 171Yb line against a hydrogen maser were recorded over a two month period. The mean frequency is 539 384 469 031(8)(23) kHz. The combined uncertainty of 24 kHz in fractional terms is . We have investigated relevant systematic shifts, the most significant being the overlap of the forward and return beams used in the sub-Doppler spectroscopy, and errors associated with identifying line-centre. The accuracy of the hydrogen maser was verified by carrying out line frequency measurements in 171Yb. We believe this to be the most accurate Yb intercombination line frequency measured to date. The reproducibility of the line frequencies points to a modestly accurate frequency reference that is simple and with the potential to be compact and robust [33]. We note that with the atomic flow rates estimated here, 1 g of Yb would last over one hundred years with continuous operation. The 171Yb frequency can be used to compute a value for the 171Yb frequency based on the hyperfine frequency separation of 5 937 779 (57) kHz [14]. The result is 539 390 406 810 (62) kHz, which is consistent with that previously reported and with reduced uncertainty [31].
For the 171Yb hyperfine line, the ICR was used as a means of laser frequency stabilization for laser cooling. By locking to the centre of the crossover resonance we show that temperatures of sub-20 K can be produced in a dual-colour magneto-optical trap. By comparing the atom-cloud temperature to various levels of frequency instability, we find that the remaining instability of the 556 nm light is not responsible for the temperature limit; hence locking to the ICR is an effective means of laser stabilization for laser cooling. Similar inverted crossover resonances with an atomic beam are expected to be manifest whenever the species has a nuclear spin of 1/2 and the electronic transition has a sufficiently narrow natural linewidth; other examples include the intercombination lines in 199Hg ( MHz), 111Cd and 113Cd ( kHz).
Acknowledgement
This work was supported by the Australian Research Council (grant LE110100054). J.M. was supported through an ARC Future Fellowship (FT110100392). We thank members of the ARC CoE Engineering Quantum Systems and OBEL for the use of diagnostic equipment, and Nils Nemitz, Frédéric du Burck and Stefan Weyers for valuable discussions.
Appendix: Populations at the steady-state
The solutions to the steady state four-level rate equation model adopted here are the following. The parameters are described in the main text.
| (16) |
References
References
- [1] Takeshi Fukuhara, Yosuke Takasu, Mitsutaka Kumakura, and Yoshiro Takahashi. Degenerate Fermi gases of ytterbium. Phys. Rev. Lett., 98:030401, 2007.
- [2] A.H. Hansen, A. Khramov, W.H. Dowd, A.O. Jamison, V.V. Ivanov, and S. Gupta. Quantum degenerate mixture of ytterbium and lithium atoms. Phys. Rev. A, 84(1):011606, 2011.
- [3] S. Dorscher, A. Thobe, B. Hundt, A. Kochanke, R. Le Targat, P. Windpassinger, C. Becker, and K. Sengstock. Creation of quantum-degenerate gases of ytterbium in a compact 2D-/3D-magneto-optical trap setup. Rev. Sci. Instrum., 84(4):043109, 2013.
- [4] F. Scazza, C. Hofrichter, M. Hoefer, P. C. De Groot, I. Bloch, and S. Foelling. Observation of two-orbital spin-exchange interactions with ultracold SU(N)-symmetric fermions. Nature Physics, 10(10):779–784, 2014.
- [5] Michael Schreiber, Sean S. Hodgman, Pranjal Bordia, Henrik P. Lüschen, Mark H. Fischer, Ronen Vosk, Ehud Altman, Ulrich Schneider, and Immanuel Bloch. Observation of many-body localization of interacting fermions in a quasirandom optical lattice. Science, 349(6250):842–845, 2015.
- [6] Ryuta Yamamoto, Jun Kobayashi, Takuma Kuno, Kohei Kato, and Yoshiro Takahashi. An ytterbium quantum gas microscope with narrow-line laser cooling. New Journal of Physics, 18(2):023016, 2016.
- [7] S.G. Porsev, A. Derevianko, and E.N. Fortson. Possibility of an optical clock using the 6 transition in 171,173Yb atoms held in an optical lattice. Phys. Rev. A, 69(2):21403 – 1, 2004.
- [8] N. Hinkley, J. A. Sherman, N. B. Phillips, M. Schioppo, N. D. Lemke, K. Beloy, M. Pizzocaro, C. W. Oates, and A. D. Ludlow. An atomic clock with instability. Science, 341(6151):1215–1218, 2013.
- [9] K. Beloy, N. Hinkley, N.B. Phillips, J.A. Sherman, M. Schioppo, J. Lehman, A. Feldman, L.M. Hanssen, C.W. Oates, and A.D. Ludlow. Atomic clock with room-temperature blackbody stark uncertainty. Phys. Rev. Lett., 113(26):260801, 2014.
- [10] Masao Takamoto, Ichiro Ushijima, Manoj Das, Nils Nemitz, Takuya Ohkubo, Kazuhiro Yamanaka, Noriaki Ohmae, Tetsushi Takano, Tomoya Akatsuka, Atsushi Yamaguchi, and Hidetoshi Katori. Frequency ratios of Sr, Yb, and Hg based optical lattice clocks and their applications. Comptes Rendus Physique, 16(5):489, 2015.
- [11] Nils Nemitz, Takuya Ohkubo, Masao Takamoto, Ichiro Ushijima, Manoj Das, Noriaki Ohmae, and Hidetoshi Katori. Frequency ratio of Yb and Sr clocks with uncertainty at 150 seconds averaging time. Nat. Photon., 10:258–261, 2016.
- [12] T. Kuwamoto, K. Honda, Y. Takahashi, and T. Yabuzaki. Magneto-optical trapping of Yb atoms using an intercombination transition. Phys. Rev. A, 60(2):745, 1999.
- [13] R. Maruyama, R.H. Wynar, M.V. Romalis, A. Andalkar, M.D. Swallows, C.E. Pearson, and E.N. Fortson. Investigation of sub-Doppler cooling in an ytterbium magneto-optical trap. Phys. Rev. A, 68(1):011403, 2003.
- [14] J.J. McFerran. An inverted crossover resonance aiding laser cooling of 171Yb. J. Opt. Soc. Am. B, 33(6):1278–1285, 2016.
- [15] R. L. Barger and J. L. Hall. Pressure shift and broadening of methane line at 3.39 studied by laser-saturated molecular absorption. Phys. Rev. Lett., 22:4–8, 1969.
- [16] T.W. Hansch, M.D. Levenson, and A.L. Schawlow. Complete hyperfine structure of a molecular iodine line. Phys. Rev. Lett., 26(16):946 – 9, 1971.
- [17] N. Kostylev, C. R. Locke, M. E. Tobar, and J.J. McFerran. Spectroscopy and laser cooling on the line in Yb via an injection-locked diode laser at 1111.6 nm. Applied Physics B, 118(4):517–525, 2015.
- [18] T.W. Hänsch, I.S. Shahin, and A.L. Schawlow. High-resolution saturation spectroscopy of the sodium D lines with a pulsed tunable dye laser. Phys. Rev. Lett., 27(11):707 – 10, 1971.
- [19] P.G. Pappas, M.M. Burns, D.D. Hinshelwood, M.S. Feld, and D.E. Murnick. Saturation spectroscopy with laser optical pumping in atomic barium. Phys. Rev. A, 21(6):1955–68, 1980.
- [20] S. Nakayama. Optical pumping effects in high resolution laser spectroscopy. Phys. Scr., T70:64 – 74, 1997.
- [21] G. Grynberg, A. Aspect, and C. Fabre. Introduction to Quantum Optics, page 127. Cambridge University Press, 2010.
- [22] D.L. Clark, M.E. Cage, D.A. Lewis, and G.W. Greenlees. Optical isotopic shifts and hyperfine splittings for Yb. Phys. Rev. A, 20(1):239, 1979.
- [23] W.A. van Wijngaarden and J. Li. Measurement of isotope shifts and hyperfine splittings of ytterbium by means of acousto-optic modulation. J. Opt. Soc. Am. B, 11(11):2163–2166, 1994.
- [24] Kanhaiya Pandey, Alok K. Singh, P. V. Kiran Kumar, M. V. Suryanarayana, and Vasant Natarajan. Isotope shifts and hyperfine structure in the 555.8-nm line of Yb. Phys. Rev. A, 80:022518, 2009.
- [25] J. J. McClelland. Optical State Preparation of Atoms, in Atomic, Molecular and Optical Physics : Atoms and Molecules, volume 29B, chapter 9, page 151. Academic Press, 1996.
- [26] H. Wahlquist. Modulation broadening of unsaturated Lorentzian lines. J. Chem. Phys, 35(5):1708–1710, 1961.
- [27] G.V.H. Wilson. Modulation broadening of NMR and ESR line shapes. Journal of Applied Physics, 34(11):3276 – 3285, 1963.
- [28] R.C. Isler. Corrections for modulation and time-constant effects on isolated level-crossing signals. J. Opt. Soc. Am., 59(6):727 – 33, 1969.
- [29] G. Grynberg, A. Aspect, and C. Fabre. Introduction to Quantum Optics, page 128. Cambridge University Press, 2010.
- [30] With multiple measurements the associated shift will manifest itself as statistical variations.
- [31] L. Nenadović and J.J. McFerran. Clock and inter-combination line frequency separation in 171Yb. Journal of Physics B: Atomic, Molecular and Optical Physics, 49(6):065004, 2016.
- [32] O. Schmidt, K.-M. Knaak, R. Wynands, and D. Meschede. Cesium saturation spectroscopy revisited: How to reverse peaks and observe narrow resonances. Applied Physics B, 59(2):167–178, 1994.
- [33] R.P. Manginell, M.W. Moorman, J.M. Anderson, G.R. Burns, K.E. Achyuthan, D.R. Wheeler, and P.D.D. Schwindt. In situ dissolution or deposition of ytterbium (Yb) metal in microhotplate wells for a miniaturized atomic clock. Opt. Express, 20(22):24650 – 63, 2012.