High-pressure study of the ground- and superconducting-state properties of CeAu2Si2
Abstract
The pressure-temperature phase diagram of the new heavy-fermion superconductor CeAu2Si2 is markedly different from those studied previously. Indeed, superconductivity emerges not on the verge but deep inside the magnetic phase, and mysteriously increases with the strengthening of magnetism. In this context, we have carried out ac calorimetry, resistivity, and thermoelectric power measurements on a CeAu2Si2 single crystal under high pressure. We uncover a strong link between the enhancement of superconductivity and quantum-critical-like features in the normal-state resistivity. Non-Fermi-liquid behavior is observed around the maximum of superconductivity and enhanced scattering rates are observed close to both the emergence and the maximum of superconductivity. Furthermore we observe signatures of pressure- and temperature-driven modifications of the magnetic structure inside the antiferromagnetic phase. A comparison of the features of CeAu2Si2 and its parent compounds CeCu2Si2 and CeCu2Ge2 plotted as function of the unit-cell volume leads us to propose that critical fluctuations of a valence crossover play a crucial role in the superconducting pairing mechanism. Our study illustrates the complex interplay between magnetism, valence fluctuations, and superconductivity.
I Introduction
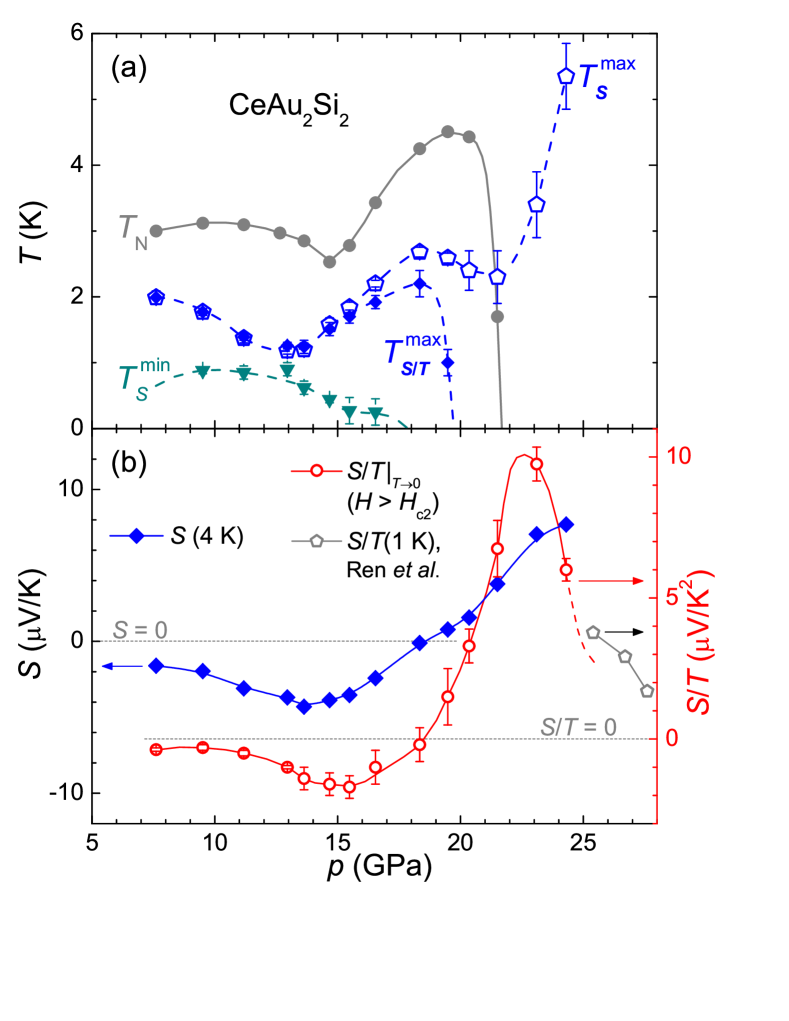
Although known about for many years, heavy fermion (HF) systems are still intensely studied since they unite some of the most interesting features of strongly correlated electron systems such as quantum criticality, non-Fermi-liquid behavior, and unconventional superconductivity. In this context, the antiferromagnet CeAu2Si2 presents new challenges to the current understanding of HF superconductivity. In CeAu2Si2 ren14 , the magnetic and superconducting phases overlap across an unprecedentedly broad pressure range from GPa up to the critical pressure GPa, where the superconducting transition temperature is highest, as shown in the schematic phase diagram in Fig. 1(a). Contrary to all previous observations, both and the magnetic ordering temperature increase simultaneously over an extended pressure range. Thus, at low temperatures, CeAu2Si2 behaves very differently from the isostructural and isoelectronic parent compounds CeCu2Si2 and CeCu2Ge2. In contrast, all three systems exhibit remarkably similar properties at intermediate and high temperatures.
Among the Ce-based HF superconductors, CeAu2Si2 displays one of the highest of K. Superconductivity (SC) appears to involve HF quasiparticles with an effective mass * , as inferred from the large initial slope of the upper critical field ren14 . Furthermore, the strong pair-breaking effect of non-magnetic impurities attests unconventional SC ren15 . CeAu2Si2 has a tetragonal ThCr2Si2-type structure with the space group I4/mmm ()rossi79 ; grier84 and orders antiferromagnetically below Kbook82 ; ota09 . The resistivity [Fig. 1(b)] and thermopower exhibit typical Kondo lattice behavior amato85 ; garde94 ; link97 . The ambient-pressure ground state is an A-type antiferromagnetic (AF) structure with a magnetic moment oriented along the c-axis of () at 5 K grier84 . The Sommerfeld coefficient mJ/Kmol and the AF energy gap K are determined by fitting the low-temperature ( K) specific heat ota09 . The valence of the Ce ion is 3.00 grier84 and the estimated Kondo temperature is K severig89a . increases by roughly 1-2 orders of magnitude when a hydrostatic pressure of 15 GPa is applied ren16 . Inelastic magnetic peaks in the neutron scattering spectra show crystal field excitations grier88 ; severig89 . A magnetic field of 5.5 T applied along the magnetic easy axis c is sufficient to suppress the AF order and leads to a polarized paramagnetic state via a metamagnetic transition fujiwara06 ; sefat08 ; ota09 . Furthermore, as observed in specific heat and magnetization experiments ota09 , CeAu2Si2 exhibits two successive magnetic transitions at 8.0 and 9.6 K, which separate the AF ground state from the paramagnetic state.
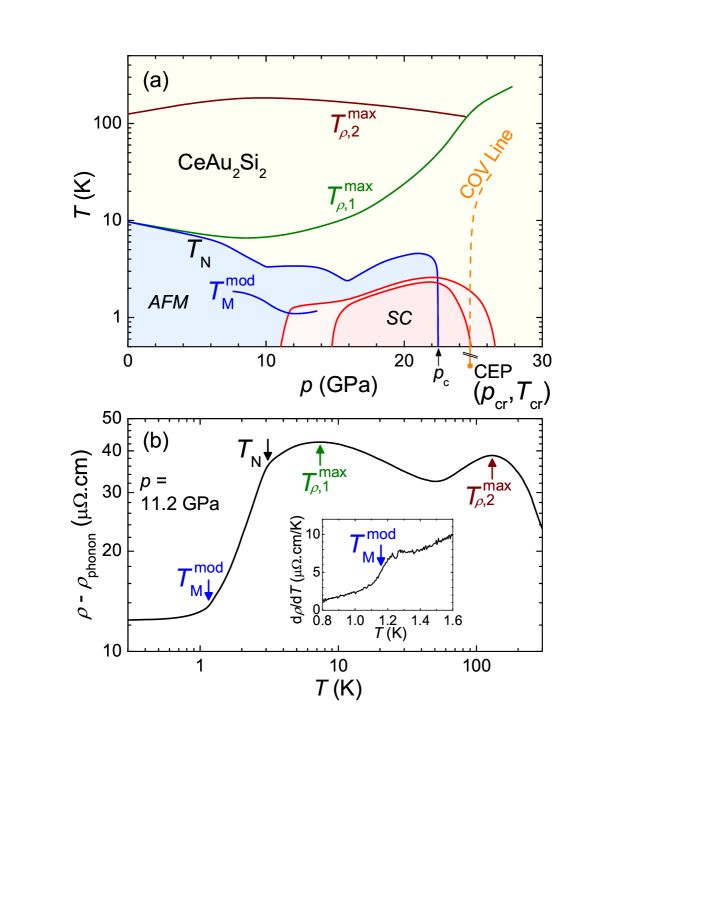
Concerning the effect of pressure, it is noteworthy that the AF transition line is nonmonotonic forming a triple dome [see Fig. 1(a)], which suggests pressure-induced modification of the magnetic structure. Moreover, the crossover line corresponding to the delocalization of 4f electrons (labeled COV below) is located just above [see Fig. 1(a)] ren14 ; ren15 . The rapid collapse of magnetism and the SC enhancement may be driven by critical valence holmes07 or even orbital ren14 fluctuations.
To refine the high-pressure phase diagram of CeAu2Si2, we performed measurements up to 24.3 GPa on a single crystal using techniques presented in Refs. link96 ; holmes04 providing nearly hydrostatic pressure conditions. Using a multiprobe setup, we examined the in-plane electric resistivity, in-plane thermoelectric power, and ac calorimetry. With magnetic fields applied along the c-axis, we examined the pressure dependence of the superconducting upper critical field and its initial slope , as well as the pressure dependence of the normal-ground-state properties for . The present work confirms the existing phase diagram ren14 and reveals the following major novelties. i) A new transition line , presumably due to the reconstruction of magnetic order, is observed inside the AF phase [see Fig. 1(a)]. Corresponding anomalies are clearly seen, e.g. in the resistivity [Fig. 1(b) and inset]. ii) Intriguingly, while decreases with increasing pressure, the magnetic phase becomes much more stable in a magnetic field. iii) Comparing the magnetic-transition lines with the large superconducting dome reveals that both the emergence of SC deep inside the AF phase and the maximum occur close to magnetic instabilities in two “critical” pressure regions. The first region around 14 GPa corresponds to a minimum in and enhanced electronic scattering rates. The second one around 22 GPa is marked by the abrupt vanishing of magnetism, quantum-critical-like signatures, and non-Fermi-liquid (NFL) behavior. This corroborates the idea that the SC in CeAu2Si2 is driven by quantum critical fluctuations.
This paper is organized as follows. Section II presents the experimental methods. In Sect. III, we present the results of our multiprobe experiment. Section III.1 focuses on the identification of the phase transitions in the pressure region of emerging SC, Sect. III.2 shows details of the thermopower, and Sect. III.3 presents the pressure-temperature phase diagram and the normal-ground-state properties. In Sect. IV, we discuss the experimental results and the possible superconducting pairing mechanism.
II Experiment
We performed measurements on a Sn-flux-grown CeAu2Si2 single crystal in a standard dilution fridge equipped with a superconducting magnet coil with a maximum field of 8.5 T. Details of the crystal growth are described in Ref. ren14 . To generate pressure, we used a Bridgman-type sintered-diamond-anvil pressure cell with a pyrophyllite gasket and steatite as a soft-solid pressure medium. Pressure was determined from the resistive of a lead strip. The pressure gradient along the sample, estimated from the Pb-transition width, slowly increased from GPa at low pressure to GPa at maximum pressure. The four-point resistivity was measured with a dc current along the sample basal plane. For dc thermoelectric power and ac calorimetry measurements, a local heater very close to one sample extremity provided a temperature gradient and temperature oscillations, respectively. The thermoelectric voltages were measured by pairs of Au and AuFe0.07% wires. Technical details can be found in Refs. ren14 ; link96 and holmes04 . The superconducting transition temperatures are defined as i) at twice the noise deviation from a straight tangent to the normal-state resistivity just above and ii) at the midway anomaly in calorimetry. Quantities labeled as normal-state properties were obtained by applying a magnetic field corresponding to the upper critical field of the resistive-SC-transition onset (, see Fig. 9 later). It was verified experimentally that the normal-state properties are qualitatively independent of the magnetic field up to 8.5 T.
III Results
III.1 Magnetic transitions
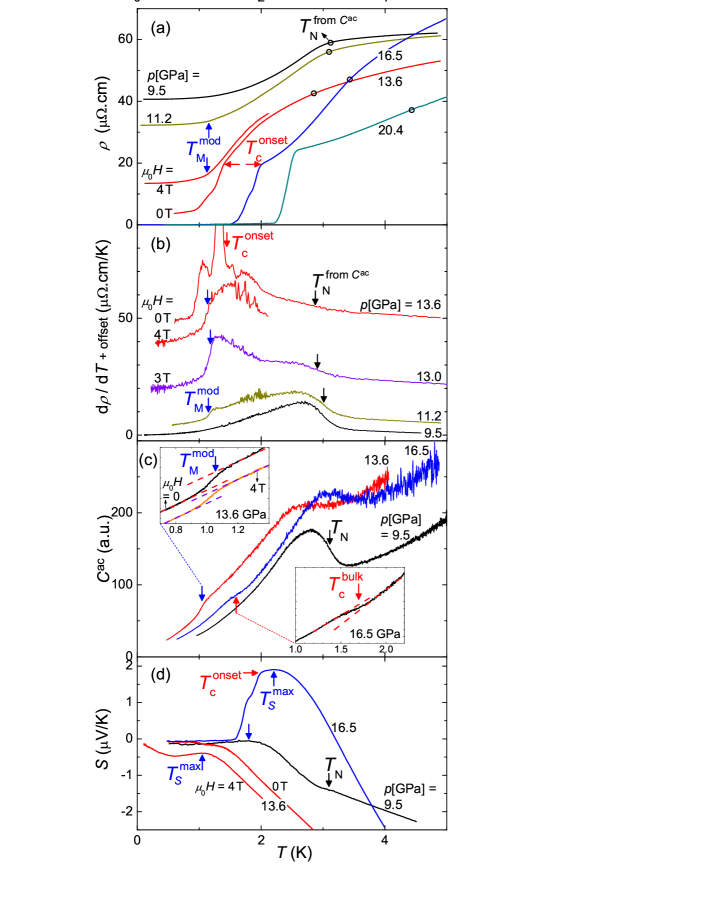
Figure 2 displays low-temperature data measured with the multiprobe setup in the vicinity (i.e., below and above the pressure) of the SC emergence. Generally, the anomaly at the Néel temperature is clearly visible in the ac calorimetry and resistivity. At 13.6 GPa, resistivity [Fig. 2(a)] shows an incomplete superconducting transition with K, while at 16.5 GPa, the transition is complete and also seen in the thermopower [Fig. 2(d)]. Moreover, calorimetry [Fig. 2(c)] has the signature of bulk SC at K. () reaches its maximum of 2.2 K (2.6 K) at 20.4 GPa.
In addition to the superconducting and AF transitions, the probes reveal other anomalies. At a temperature , the calorimetry exhibits a bump [see Fig. 2(c) and upper inset] and the resistivity exhibits a kink, corresponding to an abrupt jump in the temperature derivative [see Fig. 2(b)]. These anomalies are observed in the pressure range 7.6 – 13.6 GPa, i.e., well inside the AF phase. Their sharpness is characteristic of a phase transition and it is clear that they are not due to SC since they persist in magnetic fields higher than . As discussed below, the anomalies in and correspond to the same phenomenon, most likely to a magnetic transition (therefore the label ). Moreover, the thermopower [Fig. 2(d)] shows a local maximum at close to , which persists over the whole pressure range.
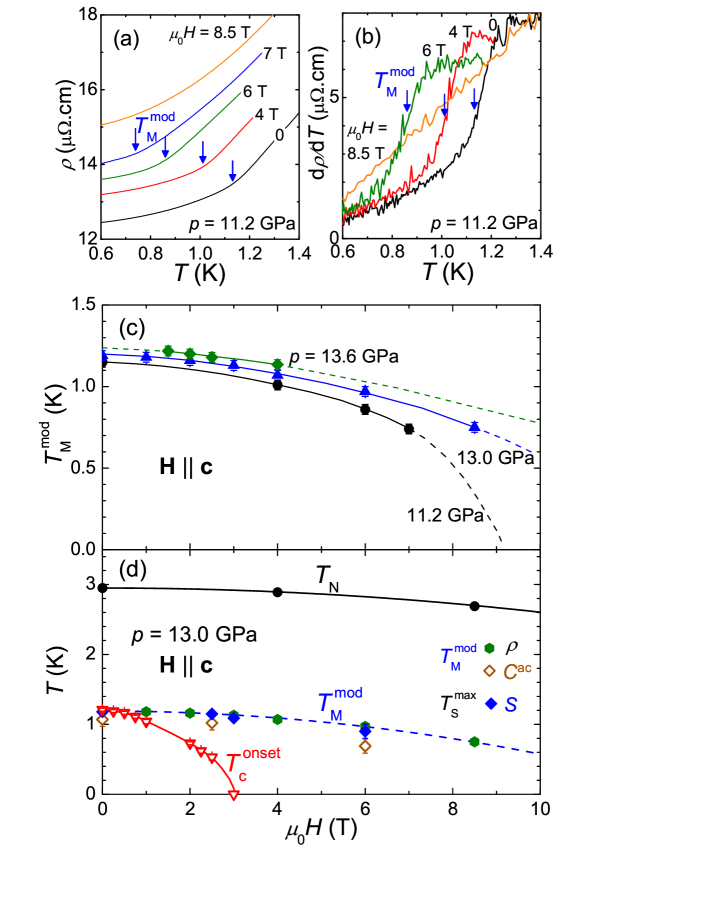
Figures 3(a) and 3(b) show for GPa, a decrease in with increasing magnetic field , revealed via and . becomes more field-resistant with increasing pressure: while is suppressed by roughly 9 T at GPa, the anomaly seems to persist well above 10 T at 13.6 GPa [see Fig. 3(c)]. Similarly, the H dependence of the Néel temperature [e.g., for GPa in Fig. 3(c)] reveals an unusual behavior of magnetism in CeAu2Si2. Despite rapidly decreasing with increasing pressure, the magnetic phase becomes much more stable against the magnetic field. At zero pressure, K and the metamagnetic transition field is T, but at pressures above 7 GPa, where K, the AF phase survives far beyond 8 T. A similar -induced increase in has been observed for CeRh2Si2 knafo17 and seems to be related to a -induced modification of the magnetic structure kawarazaki00 . Figure 3(d) shows that the field dependences of deduced from resistivity and calorimetry are identical, indicating that the corresponding anomalies are caused by the same phenomenon: the transition at . Additionally, the temperature of the maximum thermopower shows exactly the same behavior. The field dependence of is similar to that of but clearly different than that of the superconducting . Following a recent study of CeIn3 ebihara04 , we assume the relationship , where is the zero-field transition temperature and is the critical field. At GPa, the extrapolated value for is roughly 30 T and an analogous relationship for yields 14 T. The similarity of the field dependences of and indicates that the anomalies at are induced by reconstruction of the AF order, as observed at zero pressure at K ota09 .
III.2 Thermoelectric power
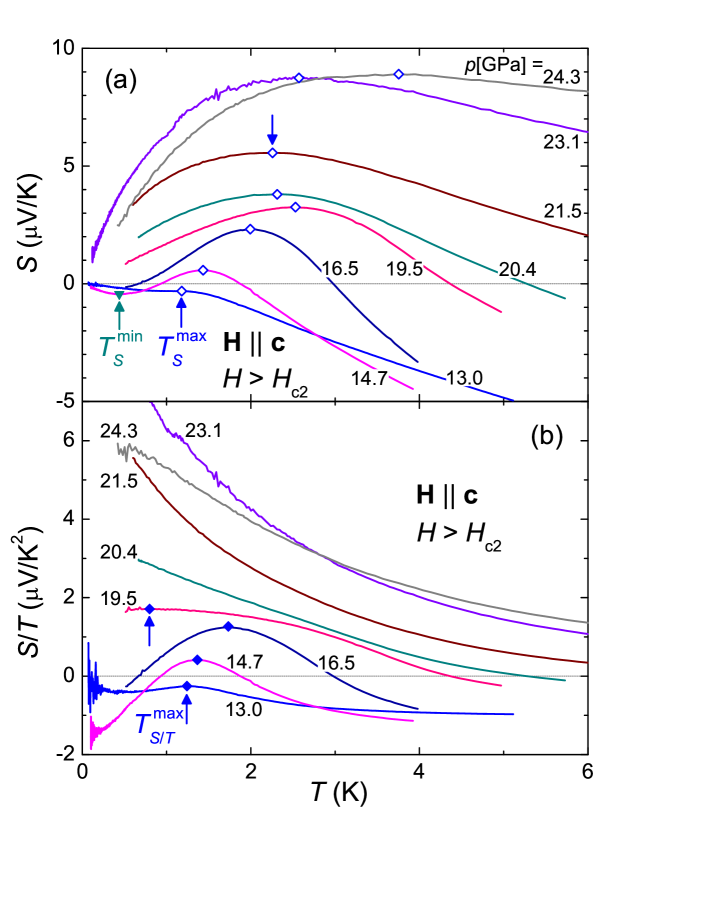
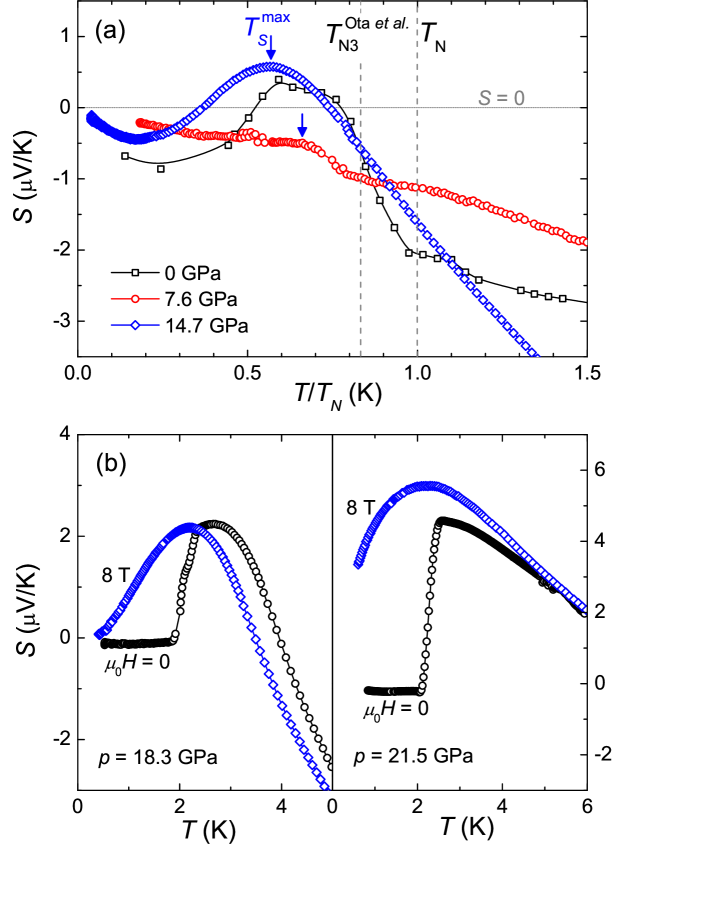
Figure 4 presents the normal-state () thermopower and as a function of temperature (below 6 K) for different pressures. Between 7.6 and 13.6 GPa, is negative and exhibit a local maximum or a shoulder at . Additionally, a local minimum occurs at for intermediate pressures [see Fig. 5(a) for the dependence of and ]. Since the local maximum becomes positive for GPa, crosses the zero line twice up to 16.5 GPa. Above , decreases continuously with increasing and the temperature, at which its sign changes to negative, increases with pressure. Furthermore, and the magnitude of at increase strongly with pressure when GPa. The pressure dependence of the isotherm at 4 K [Fig. 5(b)] is in good agreement with our previous study ren16 . Similar to , exhibits a maximum at the temperature , which culminates at 18.3 GPa, and vanishes abruptly at higher pressure [see Fig. 5(a)]. Actually, at low pressures, but these two temperatures diverge for high pressures. Note that the behavior of is qualitatively different for pressures above 20 GPa, where decreases continuously with . For , tends to recover a linear T dependence and its initial slope can be approximated, although systematic measurements down to still lower temperature are desirable for a better determination. Nevertheless, Fig. 5(b) reveals that exhibits a narrow maximum of V/K2 located slightly above . continues to decrease beyond 25 GPa, as shown by data from Ref. ren16 , reflecting the increasing hybridization of Ce-4f and conduction electrons.
Inside the AF phase, negative and positive contributions to result in subsequent local minimum and maximum, respectively, which is most clearly demonstrated for GPa. A local extrema can be attributed to an AF gap: a minimum (maximum) is due to a gap below (above) the Fermi level and () abelskii72 . In the present case, a putative reconstruction of the AF order with a change in the gap structure at most likely induces the oscillation of below . The plot of versus [Fig. 6(a)] shows that the oscillating behavior is already observed at zero pressure (data from another sample), where more marked anomalies can be brought into connection with the transitions at K and K observed in the specific heat ota09 . Thus, the features in the thermopower corroborate the interpretation of the anomalies in the resistivity and calorimetry. Furthermore, shows field and pressure dependences [Figs. 3(d) and 5(a)] very similar to those of and , underlining their coupling.
Let us now comment on the observation that drops to zero just above 18.3 GPa, while persists and rises strongly at higher pressures [see Fig. 5(a) and also Ref. ren16 ]. A feature in , induced by a phenomenon such as a magnetic rearrangement, is expected to persist in . This is clearly the case of the low-pressure maximum (and minimum), whereas the high-pressure maximum occurs only in but not in . Therefore, the maximum in at the highest pressures is not related to a magnetic transition but rather to a crossover. Further evidence for that the low- and high-pressure maxima have different origins is the field dependence of their magnitude [see Fig. 6(b)]. For GPa, the magnitude of exhibits no or slightly negative field dependence. By contrast, for higher pressures, the magnitude shows a sizable increase at T. The high-pressure maximum presumably marks a crossover between a positive zero- term and a negative intermediate- contribution. We conclude that the low- and high-pressure maxima in have to be distinguished.
III.3 Phase diagram and normal-state properties
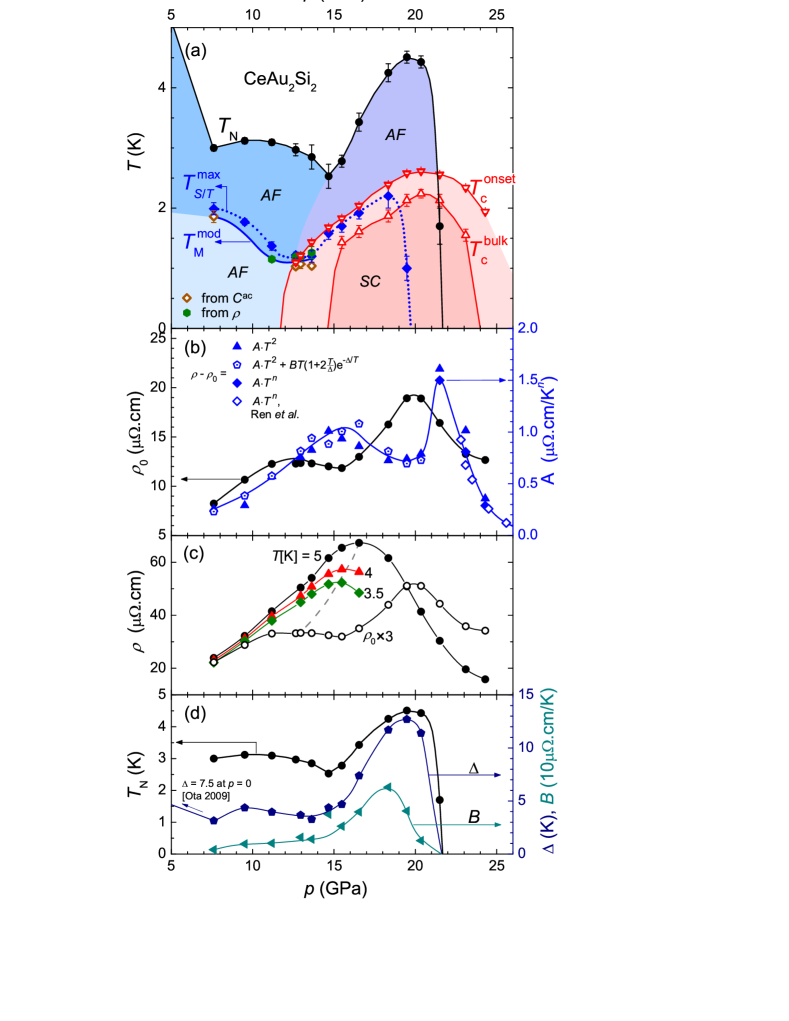
Figure 7(a) presents the pressure-temperature phase diagram of CeAu2Si2 obtained from the calorimetry, resistivity, and thermopower results. First, let us clarify two points: i) although there is no proof from microscopic probes, we consider that the high-pressure phase below is AF, which means that there is an unexpected resurgence of the AF-transition line under pressure. This is supported by the continuity of the characteristic anomalies in the calorimetry and resistivity at . ii) and data points below are obtained from the normal state () and there is not yet any evidence for the coexistence of SC and AF order. Concerning and the superconducting dome, the new phase diagram is in perfect agreement with the previous one ren14 , except for a minor downward pressure shift of GPa.
The Néel temperature rapidly decreases from 9.6 K at zero pressure down to 3 K at 7.6 GPa. Here, an abrupt upturn results in a first maximum at 10 GPa. It follows a minimum ( K) and a second upturn at 14.7 GPa, above which strongly increases to a maximum of 4.5 K at 19.5 GPa. Finally, the magnetic order vanishes at GPa. Given that the pressure gradient along the sample is GPa at , the sudden collapse of is first-order like. The transition line is established from 7.6 to 13.6 GPa. Starting at K, it decreases to K. The behavior of clearly mimics that of (at about 1 K lower), indicating a magnetic origin.
The strongly modified field dependence and the peculiar pressure dependence of suggest that the low-, intermediate-, and high-pressure magnetic ground states of CeAu2Si2 are different, with subsequent modifications of the propagation wave vector and Brillouin zone at and GPa, respectively. Magnetic order may change from long-range localized- to itinerant-moment magnetism. As observed at a similar unit-cell volume in CeCu2Si2, CeCu2Ge2, and CeCu2(Si1-xGex)2 alloys, the high-pressure ordering wave vector may be incommensurate stockert04 ; knopp89 ; knebel96 . In fact, the reconstruction of magnetically ordered phases induced by different control parameters is commonly observed in Ce-HF compounds. Examples are the effect of external pressure on CePb3 morin88 and CeRh2Si2 kawarazaki00 ; knafo10 or the alloying (chemical pressure) in CeCu2Si2 leading to the observation of three AF phases with different propagation vectors knebel96 ; trovarelli97 .
Partial SC emerges around 12.7 GPa and increases linearly almost up to the maximum of the superconducting dome. It is most noteworthy that increases simultaneously with over a considerable pressure range of GPa. Bulk SC emerges at 15.5 GPa and rises in parallel with up to a maximum of 2.2 K. The maximum at 20.4 GPa is close to the collapse of magnetism at . The bulk SC spans over 9 GPa and the partial SC spans a huge -domain of over 17 GPa including data from Ref. ren14 . The resistive transition is very large at the emergence and evanescence of SC. In the region of bulk SC, the transition width is at least 0.4 K, i.e., 0.1 K more than that in Ref. ren14 , where good agreement was found between and zero-resistivity. By contrast, the parent compounds CeCu2Si2 seyfarth12 ; giriat15 and CeCu2Ge2 jaccard99 exhibit narrow transitions at pressures close to the emergence () or maximum () of SC, while the transition is broad not only at the decrease in SC but also at intermediate pressures. The large regions of partial SC are presumably due to exotic superconductivity, such as textured SC, as observed in CeRhIn5 park12 or limited to the surface as we proposedscheerer16 for CeCu2Si2.
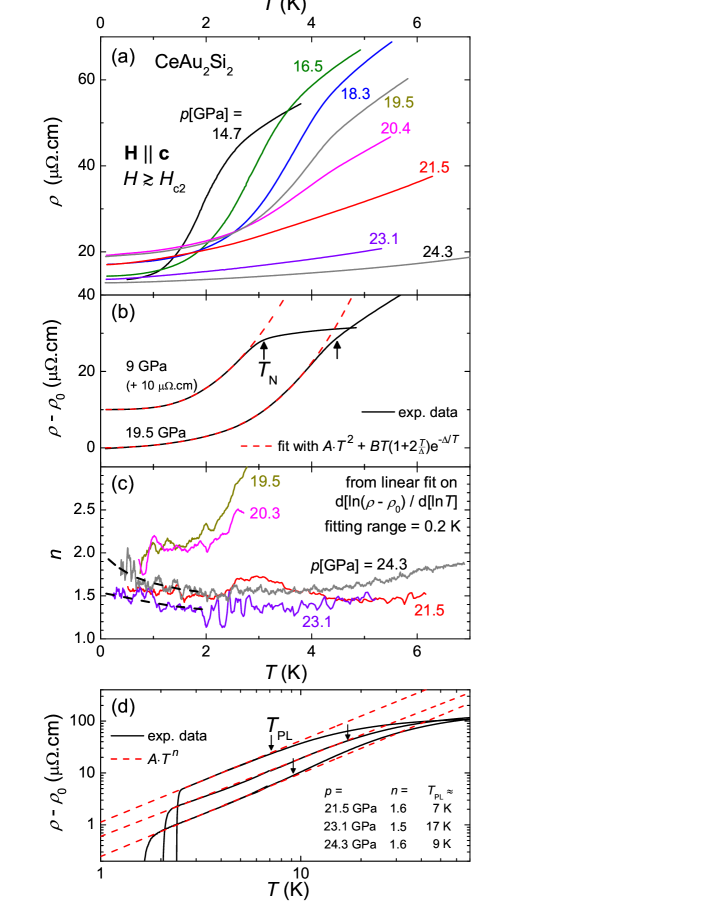
Figures 7(b) – 7(d) display salient features of the resistivity, which correlate with the two “critical” regions of the phase diagram, i.e., the regions of the minimum and the collapse of magnetism, respectively. As usual, the normal-state resistivity [, Fig. 8(a)] is analyzed using the equation of a gapped spin-wave antiferromagnet andersen80 for [see Fig. 8(b)] and the power law for . The residual resistivity exhibits a shoulder at 13 GPa and a maximum at 20 GPa, while the coefficient has two maxima at higher pressures by about 2 GPa [see Fig. 7(b)]. Below , due to magnetic coherent electron scattering, is reduced roughly by a factor of 8 compared with a hypothetical nonmagnetic-ground-state value, which is indeed that observed in CeCu2Si2 seyfarth12 and CeCu2Ge2 jaccard99 at their . It is noteworthy that the pressure dependence of the AF energy gap closely follows that of [Fig. 7(d)]. Enhanced electronic scattering rates around 14 GPa may be related to a magnetic instability indicated by the minimum and . The anomaly in is relatively weak, although the shoulder in has a similar amplitude to that at in the parent compound CeCu2Ge2 jaccard99 . Moreover, the pressure dependence of the isothermal resistivity at temperatures above [Fig. 7(c)], which is used to probe the ground-state excitations independently of magnetic ordering, confirms enhanced scattering around 14 GPa. Indeed, at K, the -isotherm exhibits a broad peak at 16.5 GPa, which is shifted to 15.5 GPa by lowering the temperature to 3.5 K. By continuity, this peak becomes the shoulder in at 13 GPa. In addition, the extrapolation of the low-pressure line link97 ; ren14 collapses at GPa. All these features including the maximum may reflect enhanced magnetic instabilities, which do not lead to a true quantum critical point (QCP) because of to the sudden strengthening of magnetism above 14.7 GPa. Thus, only a few characteristics of spin-mediated SC are found in this -region.
In the second region, i.e., around , the large enhancement in indicates quantum critical fluctuations miyake02 . The maximum at 20 GPa occurs slightly below the magnetic collapse at GPa. The sharp anomaly in at can be explained as follows. rises abruptly just below since paramagnetic Ce 4f-electron scattering is recovered after the collapse of the magnetic order. The considerable reduction in between 21.5 and 24.3 GPa is caused by both the collapse of spin fluctuations and the increasing itinerant character of Ce 4f electrons, as in the cases of CeCu2Si2 and CeCu2Ge2 at jaccard99 . Including the data from Ref. ren14 , decreases by two orders of magnitude up to 27.6 GPa. Furthermore, around , the exponent [Fig. 8(c)] exhibits clear NFL behavior. At , 23.1, and 24.3 GPa, is close to 1.5 and constant up to roughly 10 K. Defining as the temperature below which the power law with holds, it is striking that K is maximum at GPa, i.e., slightly above [see Fig. 8(d)]. Lastly, Fermi liquid behavior () is recovered below the usual temperature scale for GPa.
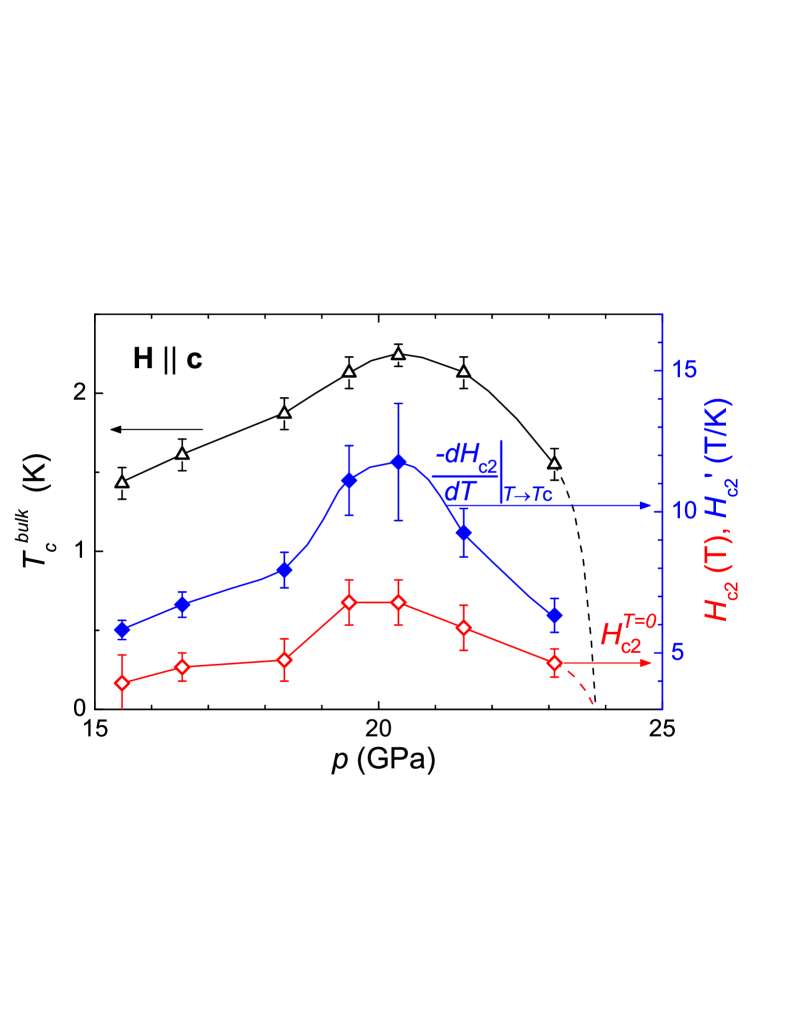
Figure 9 presents properties of the upper critical field (defined by a 95% drop in resistivity). and its initial slope show dependences similar to that of , i.e., a dome shape around GPa with maximum values of 6.8 T and 11.8 T/K, respectively. From the emergence of bulk SC to the maximum , is enhanced by roughly a factor of 2, indicating in –the clean limit– an enhancement of the effective mass * by 40%.
To summarize, clear signatures of quantum critical behavior around are found in the normal-state and in all probes sensitive to *. The quantities , , and show similar variations, i.e., a strong peak close to and a rapid decrease at higher pressures. However, the peak positions of these quantities are spread over pressures from 20.4 to 23.1 GPa. This difference in is rather large in comparison with the usual scale of HFs and cannot be explained alone by the pressure gradient GPa along the sample. The dispersion of the peak positions over the pressure axis is significant and one can not simply attribute all the features in the normal- and superconducting-state properties to one isolated QCP. Indeed, below we discuss the interplay between the collapse of magnetism at and the critical endpoint of the COV line at a slightly higher .
IV Discussion
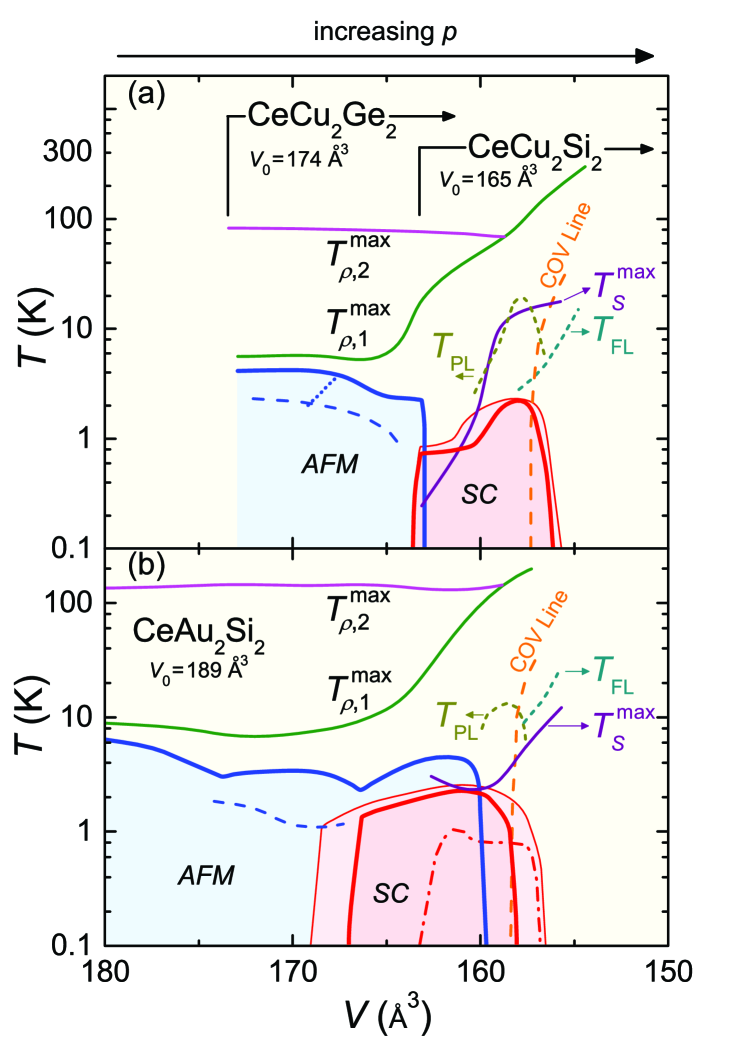
Figure 10 presents a schematic plot of the characteristic temperatures of CeCu2Si2, CeCu2Ge2, and CeAu2Si2 versus the unit-cell volume , which highlights the striking similarities between these systems. Such a comparison was previously elaborated in Ref. ren14 . In particular, CeCu2Ge2 under a pressure of GPa coincides perfectly with CeCu2Si2 at ambient pressure and only data of the latter are shown for Å3. The three compounds show a broad overlap of their superconducting regions. The energy scales due to Kondo scattering and due to scattering on the excited crystal field levels (see also Fig. 1) merge at Å3 and the maximum occurs near this volume. Thus, is highest when the Kondo and CEF-splitting energies become comparable. The Kondo temperature , identified as the main parameter, drives the systems from long-range magnetic ordered states, through SC, towards a strongly delocalized paramagnetic f-metal at a reduced volume. At pressures where the SC is strongest, the system is controlled by a relatively high energy scale: . Clearly, similarities in Fig. 10 underline the key role of the local Ce ion environment. However, for a given volume the crystallographic parameters and slightly vary by % between the systems neumann85 ; onodera02 ; ohmura09 , although Cu and Au are isovalent. Obviously Au possesses a different atomic potential from copper. Substituting Au for Cu triples the atomic mass and increases the valence shell quantum number from 3 to 5, adding extra 5d electrons.
Only a few significant differences are found between CeAu2Si2 and CeCu2Si2/CeCu2Ge2. The most important are the twofold enhancement of , the large overlap of SC with AF order, the magnetism spanning to a lower unit-cell volume , and the SC extending to a higher . These differences require explanation and may be pertinent for understanding the nature of the superconducting pairing mechanism. Actually, the twofold enhancement of may be the crucial point, indicating that the substitution of Cu by Au significantly changes the crystal-field environment of the Ce-4f-moments, affecting the ground-state properties of the system.
In agreement with the standard behavior of Ce-based HF superconductors, the maximum of CeAu2Si2 is close to the pressure where the magnetic order vanishes. By contrast, CeCu2Si2 and CeCu2Ge2 appear to be exceptions since their peaks are far above their . However, for CeCu2Ge2 there is one report honda13 of an ordering temperature persisting to a higher pressure, indicating a closer to .
We now add new aspects to the comparison of CeCu2(Si/Ge)2 and CeAu2Si2.
i) The thermopower of all three systems exhibits a low- peak or shoulder. We have argued above that for CeAu2Si2 these features have different origins below and above . For , the maximum of in CeAu2Si2 and CeCu2Ge2 jaccard92 ; link96 occurring below is related to the opening of an AF spin gap, and its temperature scale collapses just before . For , the low- maximum of occurs deep inside the coherent regime and seems to be unrelated to the Kondo effect, although its temperature scale increases strongly with . Indeed, in Fig. 10 (data of CeCu2Si2 in Refs. jaccard85 and sparn85 ) is much lower than , and is even below the Fermi liquid temperature in CeAu2Si2. Moreover, we note the very low value in CeCu2Si2 just above . Concerning the origin of for we consider two possibilities. On one hand, might be due to the development of magnetic correlations with decreasing , or on the other hand it can signal the crossover between the zero--limit term behnia04 and the usual Kondo term as described by theory zlatic14 .
ii) Recently, Seyfarth et al. seyfarth12 established, by resistivity scaling, the COV line in the p-T plane of CeCu2Si2 with a critical end point at and at a slightly negative temperature [see also Fig. 1(a)]. This crossover is ascribed to a pressure-induced change in the Ce 4f ion valence. Similar scaling behavior and the resulting COV line have also been reported for CeAu2Si2 with GPa and K ren14 . It is of upmost importance that the COV lines shown in Fig. 10 occur at almost the same for the three systems (the shift of -1 Å3 is within the experimental error). This is slightly lower than that where and coincide.
iii) For all three systems, the most pronounced NFL behavior of is observed in the vicinity of the COV, i.e., slightly above for CeAu2Si2. At , the free-exponent-power-law scale has a peak value of 6 to 10 times the superconducting as sketched in Fig. 10. For CeCu2(Si/Ge)2, the minimum power-law exponent is at the pressure of jaccard99 ; holmes04 , while is never lower than in CeAu2Si2.
iv) The red dashed-dotted line in Fig. 10 represents the superconducting of a self-flux-grown CeAu2Si2 crystal with a similar line, identical , but a much larger residual resistivity (compared to a low-, Sn-flux-grown sample) ren15 . The SC dome of this sample has only half the width of that of a low- sample and SC is absent for Å3, which corresponds to the observed in CeCu2(Si/Ge)2. Moreover, the maximum of the three systems displays the same reduction versus , indicating pair breaking by nonmagnetic disorder ren15 . Such an effect appears to be even stronger for Å3, which suggests that SC is not yet observed in CeCu2Ge2 for GPa or in partially Ge-substituted CeCu2Si2 knebel96 ; yuan03 because of the too short mean free path in the investigated samples.
We now discuss the origin of SC in CeAu2Si2. Since the first high-pressure investigation of CeCu2Si2, the dome was first associated with the instability of the Ce ion valence bellarbi84 and subsequently ascribed to charge fluctuations jaccard99 following Miyake and coworkers, who clarified conditions for a pairing mechanism based on critical valence fluctuations miyake99 ; onishi00 ; miyake02a ; holmes04 ; watanabe06 . Later on, Yuan et al. yuan03 found by Ge alloying at the Si site of CeCu2Si2 that the SC dome is a combination of two distinct states centered at and . The underlying pairing mechanism of the high- region around was thought (and this is still the dominant view) to be different from that of the low- pocket around ishikawa03 ; holmes04 ; holmes05 ; holmes07 ; monthoux07 ; lengyel09 ; seyfarth12 . Because of the multiple similarities (some are shown in Fig. 10, but there are others, such as the value of the FL coefficient ren14 and the thermopower behavior for K ren16 ), an analogous situation is expected for CeCu2Ge2 and CeAu2Si2. By taking this approach, we first examine the emergence of SC.
One key point is that in CeAu2Si2, partial and bulk SC emerge at pressures close to the minimum . Despite the extrapolation of from GPa suggesting a QCP around 15 GPa, the observed magnetic line does not collapse here but at a much higher pressure. Thus, our results diverge from the general consensus that the SC in a HF emerges near the verge of magnetism mathur98 . The enhanced scattering rates around the minimum [see Figs. 7(b) and 7(c)] support the idea that Cooper pairs are formed by magnetic fluctuations, which has been proposed to be the case for the low- state in CeCu2Si2 stockert11 ; arndt11 . However, let us recall that for this system the scenario of a spin-mediated SC, more precisely, of a nodal d-wave order parameter, has been increasingly challenged, notably by the results of thermodynamic measurements kittaka14 and theoretical calculations ikeda15 .
Then, when SC has set in, considerably increases with the strengthening of magnetism over a large interval, contrary to all previous observations. In this broad -region, it seems that SC does not compete with magnetism, as always considered but, rather, both phenomena occur in a complementary manner over an interval comparable to or larger than the total superconducting region of other HFs. On the other hand, the partial collapse of slightly precedes the emergence of SC. Our experiment does not reveal, whether there is spatial segregation between superconducting and magnetically ordered domains or whether the SC expels magnetism. Both cases would require that SC and magnetism do not interact on a microscopic scale. Another possibility is that there is a dichotomy between electronic structures corresponding to different parts of the Fermi surface.
Despite the fact that the maximum of the SC dome of CeAu2Si2 occurs close to the vanishing of magnetism at GPa, we do not think that the high--SC state is mainly spin-mediated. Indeed, the following points portray a different scenario. The unit-cell volume at which occurs, the value itself, the merging of and at a relatively high temperature, the proximity of the COV, and its associated NFL resistivity behavior all illustrate the leading role of valence fluctuations and their criticality at low , as in the case of CeCu2(Si/Ge)2 jaccard99 ; holmes04 ; holmes07 ; miyake07 ; seyfarth12 . Moreover, the collapse of seems to be first-order and we think that the valence crossover COV drives the suppression of magnetism. This does not exclude the usual effect of the competition between Kondo and Ruderman–Kittel–Kasuya–Yosida interactions and the corresponding development of magnetic spin fluctuations at low . A similar scenario with a first-order collapse of magnetism has been observed for CeCu2Ge2 jaccard99 . In spite of the unavoidable -gradient causing to spread around , we found a steeper drop in CeAu2Si2 than in CeCu2(Si/Ge)2 alloys, and here again lattice disorder can mitigate the collapse of at . Note that an analogous statement holds for the pressurized lattice CeCu5Au wilhelm00 and its Ce(Cu,Au)6 alloys loeneysen99 .
Critical valence fluctuations as SC-paring glue is not in conflict with the absence of traces of any valence transition in microscopic probes on CeCu2Si2 rueff11 ; kobayashi13 and CeCu2Ge2 kobayashi13 ; yamaoka14 (also because of the low resolution of these techniques). SC is indeed predicted when the critical-end-point temperature is negative () miyake07 ; seyfarth12 , which means that only a crossover regime occurs at . A pressure gradient and sample disorder are expected to lead to an underestimation of deduced from the resistivity scaling, and one can imagine that, in a real crystal, spans over a certain range. Thus, may be positive in some islands, which signifies a trend to a local first-order valence transition with a complex nucleation process. We are now accumulating data to establish a possible relationship between and for HF superconductors.
We remind readers, that two theoretical studies have independently claimed that an orbital transition and its correlated fluctuations mediate the SC in the CeCu2Si2 family hattori10 ; pourovskii14 . We have also supported this possibility for explaining the peculiar magnetic behavior of CeAu2Si2 ren14 , but a recent nonresonant inelastic x-ray scattering study missed a clear signature of an orbital transition in CeCu2Ge2 rueff15 . Nevertheless, considering orbital physics is not unreasonable. For example, the compound PrTi2Al20, which shares some of the crucial characteristics shown in Fig. 10, such as the merging of two resistivity contributions at the maximum braithwaite , exhibits nonmagnetic quadrupolar fluctuations matsubayashi12 . Other exotic-order fluctuations as the possible pairing mechanism are the magnetic high-rank octopole fluctuation proposed for CeCu2Si2 ikeda15 and the various proposals made for the mysterious case of URu2Si2.
V Conclusion
We have performed electric resistivity, thermoelectric power, and ac calorimetry measurements on a CeAu2Si2 single crystal under very high pressures and magnetic fields. The resulting - phase diagram and the normal-ground-state properties () exhibit new key features. A novel magnetic-transition line is associated with modifications of the AF order well below . Temperature- and pressure-driven magnetic instabilities revealed by the pressure and magnetic field dependences of and occur in the vicinity of the SC emergence. Strong correlations between , , and are found. The emergence of SC inside the AF phase and the maximum occur in two pressure regimes, around 14 and 22 GPa, respectively, where magnetic instabilities coincide with the quantum critical behavior of the normal-ground-state properties. In CeAu2Si2, and are very close and it is possible that both the suppression of magnetism and the enhanced SC are driven by a valence crossover. The COV line and the NFL behavior around indicate that the -region of high is governed by the proximity of a critical end point, presumably from a valence transition at negative temperature, and that the SC is probably mediated by critical valence fluctuations. While it appears to be difficult to disentangle the phase diagram of CeAu2Si2, this work has made a salient progress in this direction. Nevertheless, new theoretical work, especially CEF calculations, is required to improve the understanding of the complex magnetic and superconducting properties of CeAu2Si2.
VI Acknowledgments
We acknowledge enlightening discussions with J.-P. Brison, D. Braithwaite, G. Knebel, and J. Flouquet and technical support from M. Lopez and S. Müller. This work was financially supported by the Swiss National Science Foundation through Grant No. 200020-137519.
References
- (1) Z. Ren, L. V. Pourovskii, G. Giriat, G. Lapertot, A. Georges, and D. Jaccard, Phys. Rev. X 4, 031055 (2014).
- (2) Z. Ren, G. Giriat, G. W. Scheerer, G. Lapertot, and D. Jaccard, Phys. Rev. B 91 094515 (2015).
- (3) D. Rossi, R. Marazza, and R. Ferro, J. Less-Common Met. 66, P17 (1979).
- (4) B. H. Grier, J. M. Lawrence, V. Murgai, and R. D. Parks, Phys. Rev. B 29, 2664 (1984).
- (5) V. Murgai, S. Raaen, L. C. Gupta, and R. D. Parks, Valence Instabilities P. 537 (North-Holland, Amsterdam, 1982).
- (6) Y. Ota, K. Sugiyama, Y. Miyauchi, Y. Takeda, Y. Nakano, Y. Doi, K. Katayama, N. D. Dung, T. D. Matsuda, Y. Haga, K. Kindo, T. Takeuchi, M. Hagiwara, R. Settai, and Y. Ōnuki, J. Phys. Soc. Jpn. 78, 034714 (2009).
- (7) A. Amato and J. Sierro, J. Magn. Magn. Mater. 47-48, 526 (1985).
- (8) C. S. Garde and J. Ray, J. Phys.: Condens. Matter 6, 8585 (1994).
- (9) P. Link and D. Jaccard, Physica B 230-232, 31 (1997).
- (10) A. Severing, E. Holland-Moritz, and B. Frick, Phys. Rev. B 39, 4164 (1989).
- (11) Z. Ren, G. W. Scheerer, G. Lapertot, and D. Jaccard, Phys. Rev. B 94, 024522 (2016).
- (12) B. H. Grier, J. M. Lawrence, S. Horn, and J. D. Thompson, J. Phys. C: Solid State Phys. 21, 1099 (1988).
- (13) A. Severing, E. Holland-Moritz, B. D. Rainford, S. R. Culverhouse, and B. Frick, Phys. Rev. B 39, 2557 (1989).
- (14) T. Fujiwara, M. Sugi, N. Kimura, I. Satoh, T. Komatsubara, and H. Aoki, Physica B 378-380, 812 (2006).
- (15) A. S. Sefat, A. M. Palasyuk, S. L. Bud’ko, J. D. Corbett, and P. C. Canfield, J. Solid State Chem. 181, 282 (2008).
- (16) A. T. Holmes, D. Jaccard, and K. Miyake, J. Phys. Soc. Jpn. 76, 051002 (2007).
- (17) P. Link, D. Jaccard, and P. Lejay, Physica B 225, 207 (1996).
- (18) A. T. Holmes, D. Jaccard, and K. Miyake, Phys. Rev. B 69, 024508 (2004).
- (19) W. Knafo, R. Settai, D. Braithwaite, S. Kurahashi, D. Aoki, and J. Flouquet, Phys. Rev. B 95, 014411 (2017).
- (20) S. Kawarazaki, M. Sato, Y. Miyako, N. Chigusa, K. Watanabe, N. Metoki, Y. Koike, and M. Nishi, Phys. Rev. B 61, 4167 (2000).
- (21) T. Ebihara, N. Harrison, M. Jaime, S. Uji, and J. C. Lashley, Phys. Rev. Lett. 93, 246401 (2004).
- (22) S. S. Abel’skii and Y. P. Irkhin, Sov. Phys.-Solid State 13, 2035 (1972).
- (23) O. Stockert, E. Faulhaber, G. Zwicknagl, N. Stüßer, H. S. Jeevan, M. Deppe, R. Borth, R. Küchler, M. Loewenhaupt, C. Geibel, and F. Steglich, Phys. Rev. Lett. 92, 136401 (2004).
- (24) G. Knopp, A. Loidl, K. Knorr, L. Pawlak, M. Duczmal, R. Caspary, U. Gottwick, H. Spille, F. Steglich, and A. P. Murani, Z. Phys. B: Condens. Matter 77, 95 (1989).
- (25) G. Knebel, C. Eggert, D. Engelmann, R. Viana, A. Krimmel, M. Dressel, and A. Loidl, Phys. Rev. B 53, 11586 (1996).
- (26) P. Morin, C. Vettier, J. Flouquet, M. Konczykowski, Y. Lassailly, J. M. Mignot, and U. Welp, J. Low Temp. Phys. 70, 377 (1988).
- (27) W. Knafo, D. Aoki, D. Vignolles, B. Vignolle, Y. Klein, C. Jaudet, A. Villaume, C. Proust, and J. Flouquet, Phys. Rev. B 81, 094403 (2010).
- (28) O. Trovarelli, M. Weiden, R. Muller-Reisener, M. Gómez-Berisso, P. Gegenwart, M. Deppe, C. Geibel, J. G. Sereni, and F. Steglich, Phys. Rev. B 56, 678 (1997).
- (29) G. Seyfarth, A. S. Rüetschi, K. Sengupta, A. Georges, D. Jaccard, S. Watanabe, and K. Miyake, Phys. Rev. B 85, 205105 (2012).
- (30) G. Giriat, Z. Ren, P. Pedrazzini, and D. Jaccard, Solid State Commun. 209-210, 55 (2015).
- (31) D. Jaccard, H. Wilhelm, K. Alami-Yadri, and E. Vargoz, Physica B 259-261, 1 (1999).
- (32) T. Park, H. Lee, I. Martin, X. Lu, V. A. Sidorov, K. Gofryk, F. Ronning, E. D. Bauer, and J. D. Thompson, Phys. Rev. Lett. 108, 077003 (2012).
- (33) Around , polished (cleaved) CeCu2Si2 crystals show broad (narrow) resistive with identical bulk established from simultaneous heat capacity and magnetic measurements. G. Scheerer et al., unpublished.
- (34) N. H. Andersen: in Crystalline Electric Field and Structural Effects in f-Electron Systems, ed. J. E. Crow, R. P. Guertin, and T. W. Mihalisin (Plenum Press, New York, 1980).
- (35) K. Miyake and O. Narikiyo, J. Phys. Soc. Jpn. 71, 867 (2002).
- (36) G. Neumann, J. Langen, H. Zahel, D. Plümacher, Z. Kletowski, W. Schlabitz, and D. Wohlleben, Z. Phys. B 59, 133 (1985).
- (37) A. Onodera, S. Tsuduki, Y. Ohishi, T. Watanuki, K. Ishida, Y. Kitaoka, and Y. Ōnuki, Solid State Commun. 123, 113 (2002).
- (38) M. Ohmura, K. Sakai, T. Nakano, H. Miyagawa, G. Oomi, I. Sato, T. Komatsubara, H. Aoki, Y. Matsumoto, and Y. Uwatoko, J. Magn. Soc. Jpn. 33, 31 (2009).
- (39) F. Honda, T. Maeta, Y. Hirose, Y. Ōnuki, A. Miyake, and R. Settai, J. Korean Phys. Soc. 63, 345 (2013).
- (40) D. Jaccard, K. Behnia, and J. Sierro, Phys. Lett. A 163, 475 (1992).
- (41) E. Vargoz, Dr. thesis, DPMC, Université de Genève, Geneva (1998).
- (42) D. Jaccard, J. M. Mignot, B. Bellarbi, A. Benoit, H. F. Braun, and J. Sierro, J. Magn. Magn. Mater. 47-48, 23 (1985).
- (43) G. Sparn, W. Lieke, U. Gottwick, F. Steglich, and N. Grewe, J. Magn. Magn. Mater. 47-48, 521 (1985).
- (44) K. Behnia, D. Jaccard, and F. Jacques, J. Phys.: Condens. Matter 16, 5187 (2004).
- (45) V. Zlatić and R. Monnier, Modern Theory of Thermoelectricity (Oxford Unversity Press, Oxford, 2014).
- (46) H. Q. Yuan, F. M. Grosche, M. Deppe, C. Geibel, G. Sparn, and F. Steglich, Science 302, 2104 (2003).
- (47) B. Bellarbi, A. Benoit, D. Jaccard, J. M. Mignot, and H. F. Braun, Phys. Rev. B 30, 1182 (1984).
- (48) K. Miyake, O. Narikiyo, and Y. Onishi, Physica B 259-261, 676 (1999).
- (49) Y. Onishi and K. Miyake, J. Phys. Soc. Jpn. 69, 3955 (2000).
- (50) K. Miyake and H. Maebashi, J. Phys. Soc. Jpn. 71, 1007 (2002).
- (51) S. Watanabe, M. Imada, and K. Miyake, J. Phys. Soc. Jpn. 75 043710 (2006).
- (52) M. Ishikawa, N. Takeda, M. Koeda, M. Hedo, and Y. Uwatoko, Phys. Rev. B 68, 024522 (2003).
- (53) A. T. Holmes, D. Jaccard, H. S. Jeevan, C. Geibel, and M. Ishikawa, J. Phys.: Condens. Matter 17, 5423 (2005).
- (54) P. Monthoux, D. Pines, and G. G. Lonzarich, Nature 450, 1177 (2007).
- (55) E. Lengyel, M. Nicklas, H. S. Jeevan, G. Sparn, C. Geibel, F. Steglich, Y. Yoshioka, and K. Miyake, Phys. Rev. B 80, 140513(R) (2009).
- (56) N. D. Mathur, F. M. Grosche, S. R. Julian, I. R. Walker, D. M. Freye, R. K. W. Haselwimmer, and G. G. Lonzarich, Nature 394, 39 (1998).
- (57) O. Stockert, J. Arndt, E. Faulhaber, C. Geibel, H. S. Jeevan, S. Kirchner, M. Loewenhaupt, K. Schmalzl, W. Schmidt, Q. Si, and F. Steglich, Nat. Phys. 7, 119 (2011).
- (58) J. Arndt, O. Stockert, K. Schmalzl, E. Faulhaber, H. S. Jeevan, C. Geibel, W. Schmidt, M. Loewenhaupt, and F. Steglich, Phys. Rev. Lett. 106, 246401 (2011).
- (59) S. Kittaka, Y. Aoki, Y. Shimura, T. Sakakibara, S. Seiro, C. Geibel, F. Steglich, H. Ikeda, and K. Machida, Phys. Rev. Lett. 112, 067002 (2014).
- (60) H. Ikeda, M.-T. Suzuki, and R. Arita, Phys. Rev. Lett. 114, 147003 (2015).
- (61) K. Miyake, J. Phys.: Condens. Matter 19, 125201 (2007).
- (62) H. Wilhelm, S. Raymond, D. Jaccard, O. Stockert, and H. v. Loehneysen, Science and technology of high pressure, Proc. of AIRAPT-17, ed. M. H. Manghnani. (Universities Press India, Hyderabad, 2000), p. 697.
- (63) H. v. Löhneysen, J. Magn. Magn. Mater. 200, 532 (1999).
- (64) J.-P. Rueff, S. Raymond, M. Taguchi, M. Sikora, J.-P. Itié, F. Baudelet, D. Braithwaite, G. Knebel, and D. Jaccard, Phys. Rev. Lett. 106, 186405 (2011).
- (65) T. C. Kobayashi, K. Fujiwara, K. Takeda, H. Harima, Y. Ikeda, T. Adachi, Y. Ohishi, C. Geibel, and F. Steglich, J. Phys. Soc. Jpn. 82, 114701 (2013).
- (66) H. Yamaoka, Y. Ikeda, I. Jarrige, N. Tsujii, Y. Zekko, Y. Yamamoto, J. Mizuki, J.-F. Lin, N. Hiraoka, H. Ishii, K.-D. Tsuei, T. C. Kobayashi, F. Honda, and Y. Ōnuki, Phys. Rev. Lett. 113, 086403 (2014).
- (67) K. Hattori, J. Phys. Soc. Jpn. 79, 114717 (2010).
- (68) L. V. Pourovskii, P. Hansmann, M. Ferrero, and A. Georges, Phys. Rev. Lett. 112, 106407 (2014).
- (69) J.-P. Rueff, J. M. Ablett, F. Strigari, M. Deppe, M. W. Haverkort, L. H. Tjeng, and A. Severing, Phys. Rev. B 91, 201108(R) (2015).
- (70) D. Braithwaite, private communication.
- (71) K. Matsubayashi, T. Tanaka, A. Sakai, S. Nakatsuji, Y. Kubo, and Y. Uwatoko, Phys. Rev. Lett. 109, 187004 (2012).