Boxy/Peanut/X-shape bulges: steep inner rotation curve leads to
barlens face-on morphology
Abstract
We use stellar dynamical bulge/disk/halo simulations to study whether barlenses (lens-like structures embedded in the narrow bar component) are just the face-on counterparts of Boxy/Peanut/X-shapes (B/P/X) seen in edge-on bars, or if some additional physical parameter affects that morphology. A range of bulge-to-disk mass and size ratios are explored: our nominal parameters (, , disk comprising 2/3 of total force at ) correspond to typical MW mass galaxies. In all models a bar with pronounced B/P/X forms in a few Gyrs, visible in edge-on view. However, the pure barlens morphology forms only in models with sufficiently steep inner rotation curves, , achieved when including a small classical bulge with and . For shallower slopes the central structure still resembles a barlens, but shows a clear X-signature even in low inclinations. Similar result holds for bulgeless simulations, where the central slope is modified by changing the halo concentration. The predicted sensitivity on inner rotation curve is consistent with the slopes estimated from gravitational potentials calculated from the 3.6m images, for the observed barlens and X-shape galaxies in the Spitzer Survey of Stellar Structure in Galaxies (S4G). For inclinations the galaxies with barlenses have on average twice steeper inner rotation curves than galaxies with X-shapes: the limiting slope is km/s/kpc. Among barred galaxies, those with barlenses have both the strongest bars and the largest relative excess of inner surface density, both in barlens region () and near the center (); this provides evidence for bar-driven secular evolution in galaxies.
1 Introduction
Majority of strong bars in massive early type disk galaxies exhibit a barlens (bl) morphology: a central lens-like structure embedded in a narrow bar component, identified as a distinct morphological feature in Laurikainen et al. (2011). Recent observational and theoretical studies support the conjecture (Laurikainen et al., 2007) that such round inner structures are in fact the face-on counterparts of the vertically extended Boxy/Peanut/X-shape (B/P/X) structures commonly seen in barred edge-on galaxies (e.g Lütticke, Dettmar Pohlen, 2000; Bureau et al., 2006). Namely, the stellar masses and the axial ratio distributions of their host galaxies are consistent with B/P/X and bl galaxies forming a single population (Laurikainen et al., 2014; Laurikainen & Salo, 2016). Simulation models also show that it is possible to exhibit a B/P/X morphology in edge-on view while the face-on morphology is essentially circular (Athanassoula et al., 2015; Athanassoula, 2016). Additional support for the B/P/X/bl connection is provided by the very similar colors of the barlens and narrow bar components (Herrera-Endoqui et al., 2016). This connection of barlenses to vertically extended inner portions of bars indicates that they should not be confused with merger-related classical bulges, or with disky ’pseudo-bulges’ (i.e inner disks).
The best examples of pronounced barlens morphology in simulations are those of Athanassoula, Machado & Rodionov (2013), which simulations were analyzed in detail in the above mentioned study of Athanassoula et al. (2015). These idealized isolated galaxy N-body + SPH simulations followed the evolution of a stellar+gaseous disk embedded in a tri-axial halo, and included recipes for converting gas into stars. The closest resemblance to observed barlens morphologies was attained with initial gas fractions 20%-80% (Athanassoula et al., 2015). Recently, barlens morphology was also reported in simulations where disk galaxies were formed as a result of gas-rich mergers (Athanassoula et al., 2016). However, in most corresponding high-resolution simulations, either with or without gas (e.g. Minchev et al., 2012; Saha et al., 2012; Di Matteo et al., 2013), the formed bars have elongated shapes without round inner barlens components. Also, a close inspection of Athanassoula et al. (2015) models indicates that even there many of the simulated images (see their Fig. 2) contain a slight trace of X-shape morphology in the face-on view. Such X-shape signatures are very rare in the observed nearly face-on barlens galaxies (Laurikainen & Salo, 2016), suggesting that the orbital families forming the simulated central structures are not exactly the same as in most observed galaxies.
In this study we perform simple stellar dynamical bulge/disk/halo simulations to address the conditions for obtaining the observed type pure barlens morphology. We vary the parameters influencing the slope of the inner rotation curve, and show how this affects the face-on morphology of the vertically extended inner bar region. The S4G survey (Spitzer Survey of Stellar Structure in Galaxies; Sheth et al., 2010) is used as a guide for choosing the simulations parameters, and also as a comparison sample to check the predictions of the simulations.
2 Simulations
We perform stellar dynamical N-body simulations with GADGET-2 (Springel & Hernquist, 2005). The self-consistent initial galaxy models are constructed with the GalactICS software (Kuijken & Dubinski, 1995), and they consist of an exponential disk, and a lowered Evans-model (truncated log-potential with a core) for the spherical halo. Compared to the N-body-SPH simulations in Athanassoula, Machado & Rodionov (2013), our simulations contain no gas or star-formation; we also include a small classical bulge (King-model) in the initial conditions, whereas in their study central components could form during the simulation via gas inflow and star formation.
Our nominal model parameters are based on the analysis of the 3.6 m S4G images: to mimic a typical Milky Way (MW) galaxy (with stellar mass ) we use a bulge-to-disk mass ratio and a bulge effective radius , where denotes the scale length of the disk: these were typical bulge values obtained for Hubble types in the S4G pipeline bulge/disk/bar decompositions (Salo et al., 2015). More detailed decomposition, using a separate component for a bar and a barlens (Laurikainen et al., 2014), indicated similar small values even for galaxies with . Our halo model is chosen so that at the disk accounts for 65% of the total radial force. This corresponds to the typical value estimated for a MW mass galaxy in Díaz-García et al. (2016a), obtained by combining the gravitational field calculated from the 3.6 m images using the NIRQB-code (Salo et al., 1999; Laurikainen & Salo, 2002), with the rotation amplitudes obtained from the HI-kinematics (Courtois et al., 2009). The initial Toomre parameter at , and the vertical thickness of the disk has a constant scale height , which corresponds to ratio of vertical to radial velocity dispersion at .
The simulation units are fixed by setting the gravitational constant, the mass, and the initial scale length of the disk to unity. To convert to physical units, we identify and kpc, which corresponds to maximum disk contribution to circular velocity km/sec (total circular velocity km/sec; see Fig. 1). Our standard value for gravity softening is , and the time step is time units; in physical units one time unit corresponds to Myrs. The disk is realized with particles, each with mass of . The halo and bulge particles have the same mass as the disk particles.
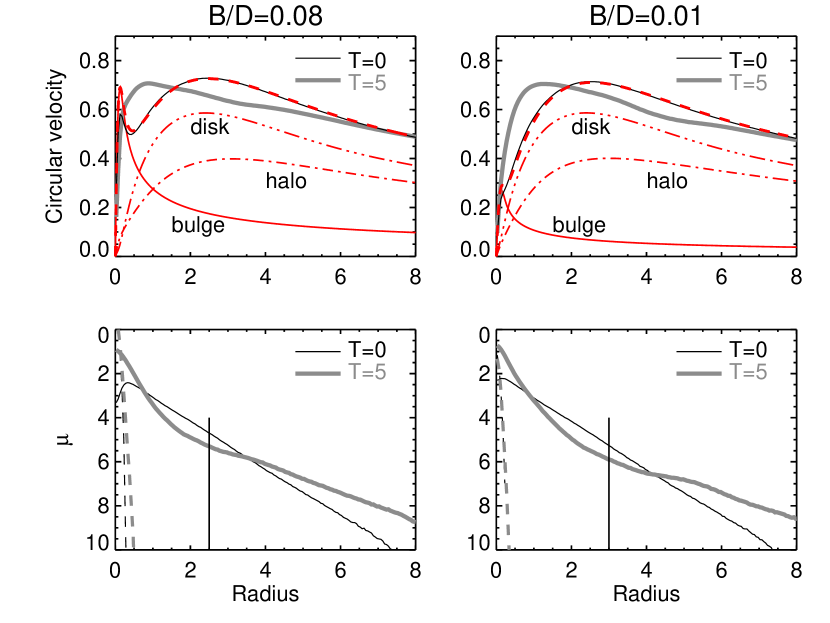
The rotation curve and the disc & bulge surface density profiles of our nominal simulation model with are displayed in Fig. 1, both for the initial state and for Gyrs, after a bar has formed. An otherwise similar model except that is also shown. As expected (see e.g Debattista et al., 2006), the formation of the bar modifies the disk density profile, which becomes more centrally concentrated while the scale length of the outer disk increases. This also modifies the rotation curve, thought the central slopes are little affected. In all the following, the discussed rotation curves correspond to those after the bar has already formed.
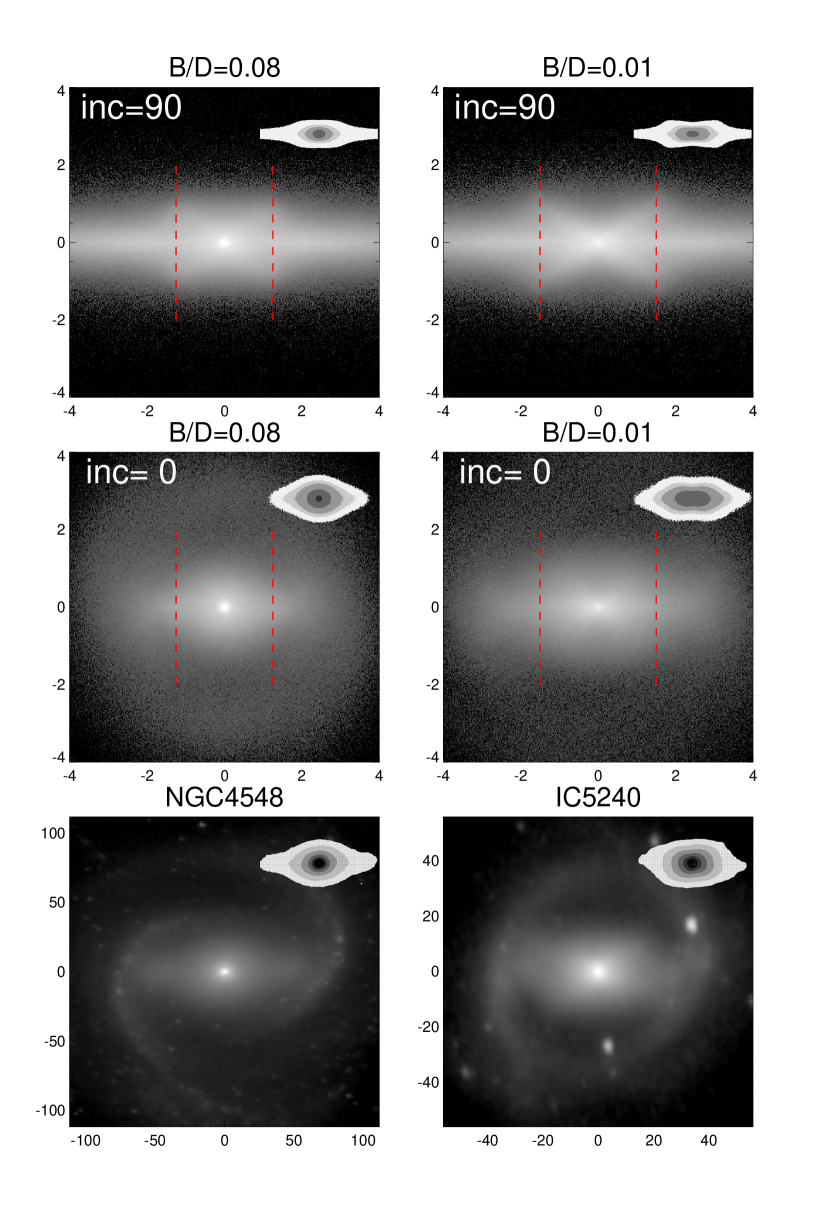
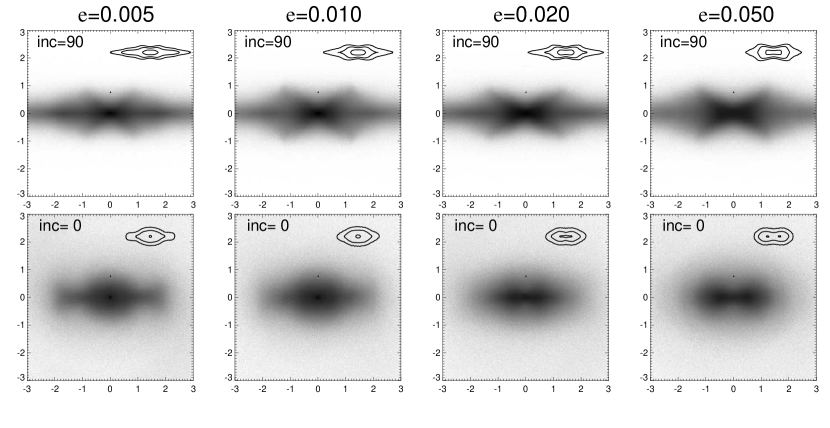
Figure 2 compares the morphology in simulations with two different bulge-to-disk mass ratios, (left) and (right). Both simulations form a bar during Gyrs, and while the bar starts to form, also the vertical extent of the orbits in the inner part of the bar increases. At Gyrs (shown in the figure) this has resulted in both cases to a pronounced B/P/X edge-on morphology. The vertical evolution lacks a rapid buckling phase often reported in the literature (Raha et al., 1991), in which sense it is more reminiscent to the resonance heating models (Quillen et al., 2014) where the X is associated to disk stars heated by the 2:1 vertical resonance (Combes et al., 1990; Pfenniger Friedli, 1991; Patsis et al., 2002). Most importantly for the current study, the face-on morphology for is very similar to that in massive barred galaxies, with a dominant round barlens structure and a weak thin bar component (compare to NGC 4548 in the lowermost row; see Laurikainen & Salo (2016) for classification of observed barlens categories): this structure survived to the end of the simulation ( Gyrs). In face-on view the size of the barlens, and that of X-feature in edge-on view, is about 1/2 of bar size, similar to what was found in Athanassoula et al. (2015). In the run with the face-on morphology also resembles a barlens, but with a clear waist-like narrowing on the bar minor axis. Most of the simulations in Athanassoula et al. (2015), as well as that in Fig. 1 in Laurikainen et al. (2014) resemble more the simulation with than that with . Although such traces of X-like morphology are not often seen in observed nearly face-on galaxies, one example is IC 5240, with an inclination of .
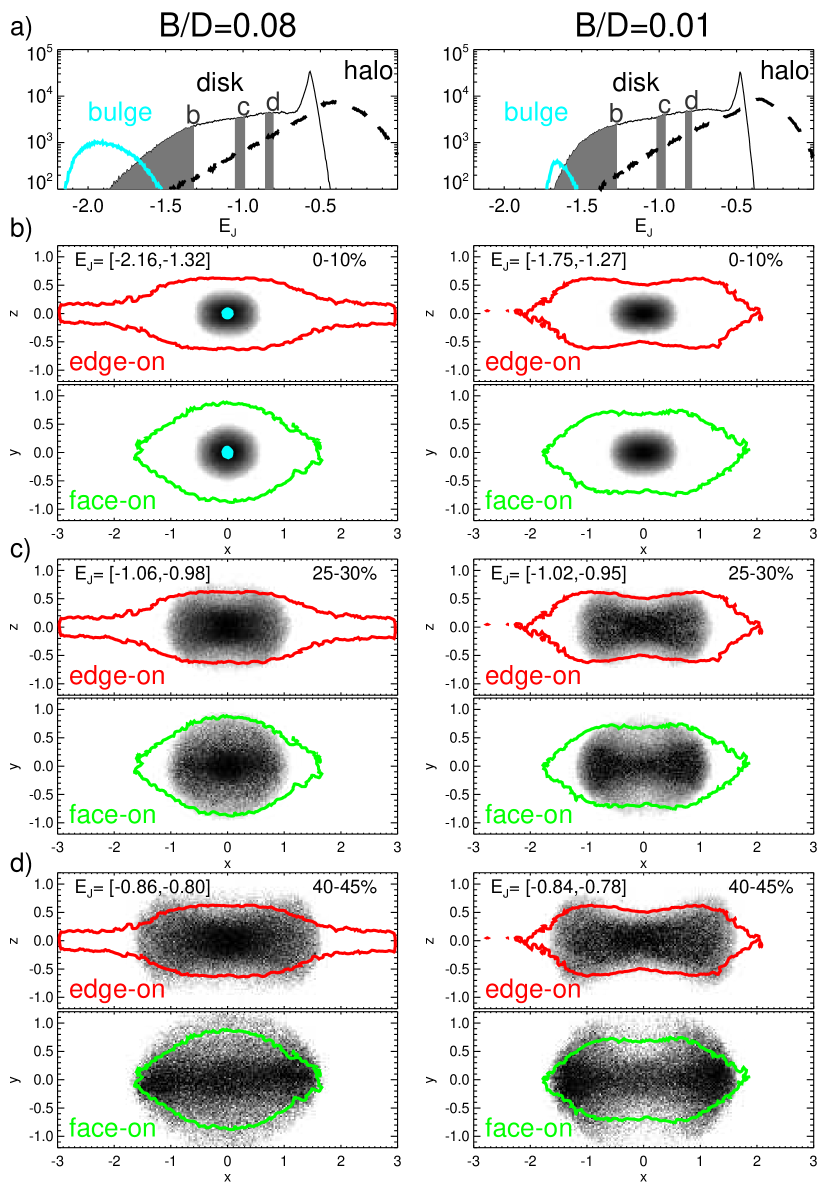
The difference in the orbital structure of the two above simulations is illustrated in Fig. 3, showing the time-averaged density distributions of selected disk particle orbits, in a frame co-rotating with the bar. The plots were constructed by sampling the positions of all particles at 500 equally separated instants during the time interval Gyrs, when the bar pattern speed had attained a constant value (within a few percents). The bar pattern speed was measured by calculating the moment of inertia tensor for all disk particles within 3 distance units from the center, and following the direction of its longest principal axis: the mean rate of change over the time interval was used as . The positions of particles were converted to the rotating system and tabulated in two-dimensional bins in xy and xz-planes, where x denotes the coordinate along the bar major axis. The tabulations from all 500 sampling times were added together, yielding the face-on and edge-on projections of the time-averaged density of the selected orbits. We also calculated the Jacobi energies of the particles, , where is the gravitational potential and the velocity in the rotating frame: over the sampling interval the of particles stayed nearly constant.
In Fig. 3, the orbits of disk particles in three different ranges of Jacobi energy are shown separately in frames b), c), and d); the ranges are indicated at the histogram in frame a). In the run (left frames), the orbits of the disk particles with in the lowest 10% range (frame b, left) fill a nearly circular region in the face-on projection. For the same range, in the run (frame b, right) the density distribution is clearly elongated along the bar major axis. Similar difference concerns the orbits in the energy range (frame c), which more or less outlines the circular barlens in the case, and in the energy range (frame d), comprising of the orbits with the largest vertical extent. For the model the orbits in frames c) and d) show a clear box-orbit character, with pronounced narrowing in the bar minor axis direction. Clearly, a significant central mass concentration is able to affect the orbital structure in a significant portion of the bar, favoring loop like orbits responsible for the round face-on morphology.
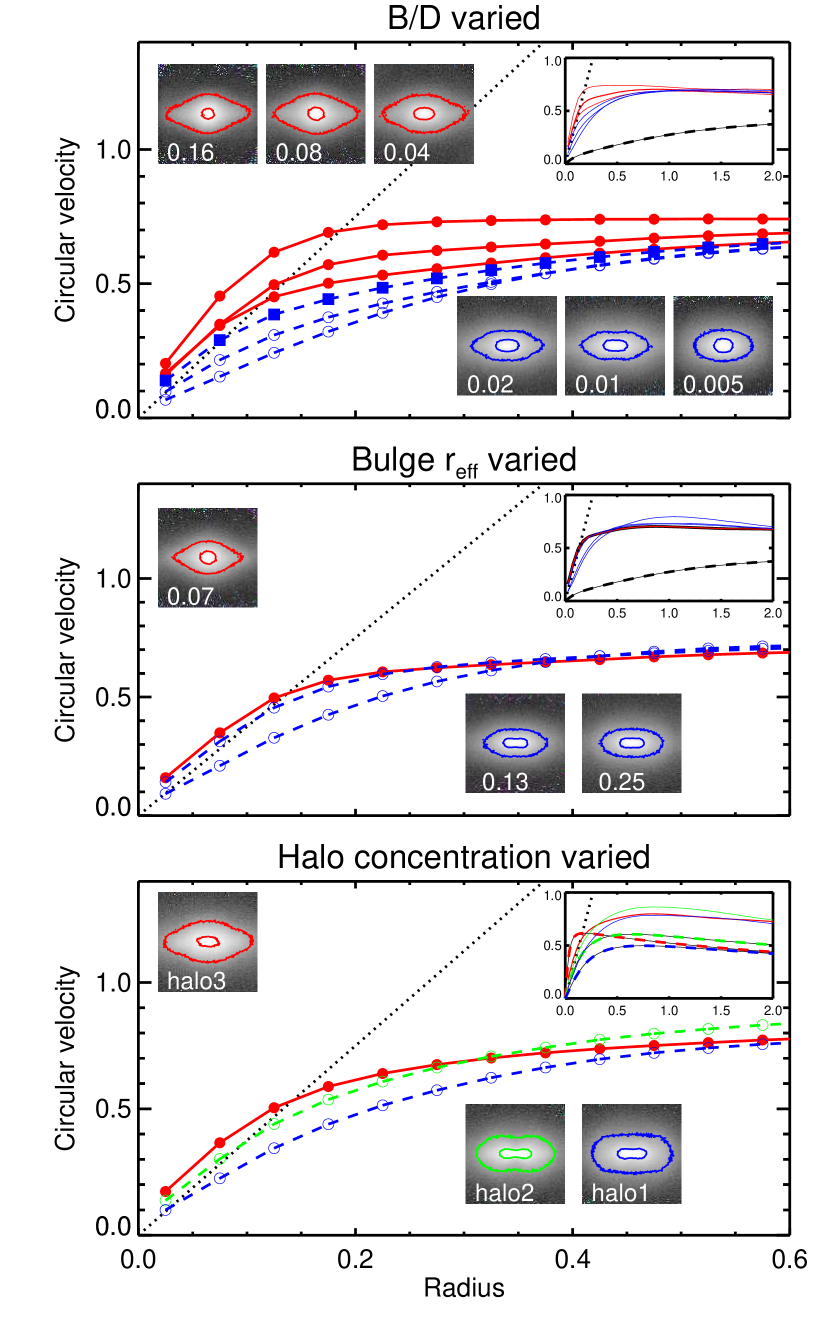
The fundamental difference in the above and simulations is the much higher central density in the former model, leading to significantly steeper inner rotation curve. The effect of the inner rotation curve is further illustrated in Fig. 4 (uppermost frame), displaying a range of ratios from to , while the bulge effective radius is kept fixed to . In these experiments a hint of X-shape face-on morphology (manifests in isophotes as a waist in the minor axis; see the insert figures) appears when the central slope , taking place for . The same threshold applies to models where the inner slope is reduced by increasing the bulge effective radius: for example, doubling the effective radius to for , yields a clear X-signature (middle frame). Similar dependence on rotation curve slope is seen also in models which have no classical bulge component, when the degree of halo central concentration is varied (lowermost frame). Note that the rotation curve is displayed at the time when the bar has formed ( Gyrs); the initial is used here mainly to get a rough normalization of the slopes: during the formation of the bar the outer disk scale length typically increases by a factor of . (see Fig. 1).
Since the simulated morphology is very sensitive to the steepness of the central velocity slope, even the use of too large gravity softening may prevent the pure barlens morphology. This is illustrated in Fig. 5, for the concentrated halo model (’halo3’) of Fig. 4, which with our nominal softening () leads to barlens morphology. Doubling the softening value () leads to clearly elongated central structure. In contrast, reducing to 0.005 yields practically similar pure barlens morphology as the nominal value. For our model with , a similar change of morphology takes place between and . Interestingly, the edge-on morphology is much less affected by increased softening: since the attention in most previous simulations of B/P/X structure has concentrated on the bar vertical structure, the dependence of face-on morphology on softening may have escaped attention.
3 Comparison to observations
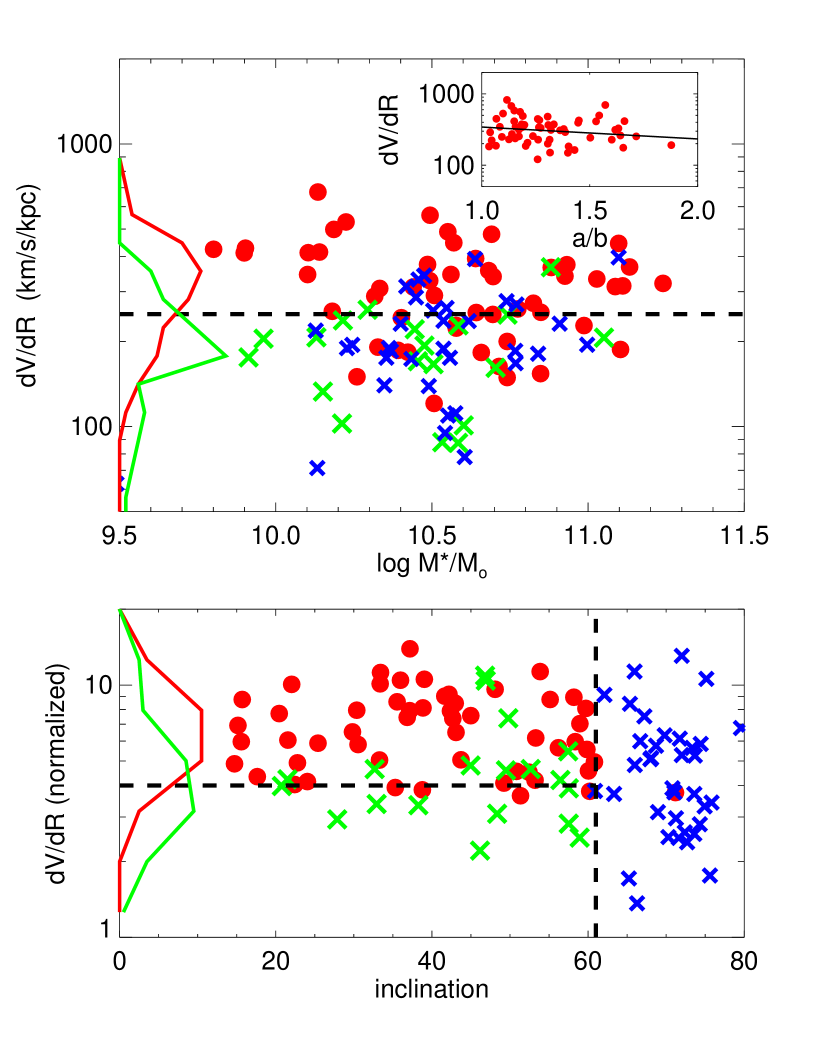
Above simulations suggest that there should be a more or less clear-cut difference (without/with trace of X) in the inner morphology for barlens galaxies with steep/shallow inner rotation curve slopes, respectively. Can this be verified with observations? Unfortunately, the number of barlens galaxies with reliably measured rotation curves is very small: for example, the recent study of inner rotation curves based on high resolution kinematics of 29 S4G galaxies (Erroz-Ferrer et al., 2016) contains only two galaxies in common with the compilation of barlens & X-shape galaxies in Laurikainen et al. (2014). However, Erroz-Ferrer et al. (2016) also conclude that the inner rotation curves are dominated by baryonic matter (see also Lelli et al. (2013)), based on the comparison of inner slopes of rotation curves with those derived from the G mass maps (non-stellar contaminants removed based on both 3.6 m and 4.5 m images; Querejeta et al., 2015) using the above mentioned NIRQB code. We may therefore approximate the inner rotation curve slopes with those derived from the mid-IR images: this is done in Fig. 6 for all barlens & X-shape galaxies in S4G. Since the rotation curves calculated from the raw 3.6 m S4G images and the mass maps differ only very little (Díaz-García et al., 2016a), the slopes in the figure are based on raw 3.6 m images. The median ratio between the observed slopes in Erroz-Ferrer et al. (2016) and our estimated slopes is 0.96 (using the 24 galaxies with observed slopes given in Table 3 of Erroz-Ferrer et al. (2016)).
Figure 6 (upper frame) displays the inner rotation curve slopes (in units of km/sec/kpc) versus galaxy stellar mass. The slopes of barlens galaxies are on average a factor of two steeper than those with X-shape structures. Also, the insert figure indicates that there might be a tendency for a barlens to be rounder when the central slope is steeper, which is in accordance with the simulated behavior. Although the fit is not statistically significant, this dependence on slope is interesting since in Laurikainen et al. (2014) and Athanassoula et al. (2015) no trend was found between the axial ratio of the barlens and the bar strength. Since the visibility of possible weak X-signatures depends strongly on observing direction (Laurikainen & Salo, 2016), the lower frame makes a comparison as a function of galaxy inclination. Also, to eliminate the influence of galaxy mass, the slopes are normalized by . Excluding the highly inclined galaxies with (which all are X-shaped), the separation between barlens and X-shape parent galaxies is strikingly clear, in good qualitative agreement with the simulation predictions. In the figure the division between pure barlens and low-inclination X-shape is drawn at 250 km/s/kpc and at 4 . The latter is close to simulation prediction; note however that here refers to stellar-only contribution, and is the observed disc scale length - after the bar has formed.
Three galaxies with X-shaped bars, NGC 4123, NGC 4725 and NGC 7140, appear in the barlens region in Fig. 6, lower frame, where the normalized is used (they have and ; see Table 1). For NGC 4725 this is the case also when expressing the central slope in km/s/kpc (upper frame). In NGC 4725 most probably a large fraction of the central mass concentration inside the X-feature comes from a nuclear bar. In NGC 7140 it is largely due to a nuclear ringlens, and in NGC 4123 due to a point-like nucleus. All these nuclear features are expected to have formed secularly from the disk material. There is no clear indication why these three galaxies deviate from the common trend; this might be related to factors not addressed by the simulations, like the gas content or the halo-to-disk mass ratio.
The morphology of the above simulation models is further studied in Laurikainen & Salo (2016), where we demonstrate that the model, when viewed from different inclinations and orientations with respect to the bar major axis, traces well the observed distribution of apparent sizes (normalized to the bar size) and aspect ratios of barlens and X features versus parent galaxy inclination. The same model also reproduces the observed dependence of barlens boxiness parameter on galaxy inclination: for barlenses have , but for larger inclination gets negative, i.e. isophotes become boxy. This is in line with Erwin & Debattista (2013) who suggested that B/P bulges can be identified at intermediate inclinations () by the boxy inner isophotes of bars.
4 Discussion
The above simulations and comparisons to observations suggest that a steep inner rotation curve slope favors a pure barlens face-on morphology, characterized by a nearly round central appearance. With a shallower rotation curve the orbits in the central regions become more elongated along the bar major axis, leading to an oval shaped bar, or even to an X-shape face-on feature (narrow waist in the minor axis).
The strong constrain on the simulated inner slope is likely to explain why barlenses, which are fairly conspicuous observationally, have not been encountered in simulation studies before Laurikainen et al. (2014) and Athanassoula et al. (2015): typically the classical bulge components employed, if included at all, have been less centrally concentrated than in the current simulations. In Debattista et al. (2004) the problem of not attaining round bar-related bulges in simulations was acknowledged, and it was speculated that extended central objects with might be needed, based on Shen and Sellwood (2004) simulations studying the robustness of bars against central black hole masses. In Shen and Sellwood (2004) simulations a rigid halo was assumed, however, very similar conclusions were reached in Athanassoula et al. (2005) using live halos. Our current simulations demonstrate that a substantially smaller (of a few percents) are sufficient, provided that realistic small effective bulge radii from observations () are adopted. Such central mass concentrations are able to affect the orbital morphology up to , while still not endangering the survival of the narrow bar. Simulating steep central slopes of course implies a need for small gravity softening: in particular, cosmological simulations so far lack the resolution necessary to resolve the inner bar dynamics (see e.g. the discussion in Brooks & Christensen, 2016).
We have demonstrated that an inclusion of a small classical bulge in simulations can reproduce the barlens morphology. Does this imply that the observed barlens galaxies harbor classical bulges which were in place already before the bar formed? An alternative is that the central mass concentrations inside the barlens region have formed together with the bar, via bar-induced inflow and star formation. Namely, barlenses are typically associated with strong bars, and to galaxies which have consumed most of their gas. Such inflow was also the mechanism that created the central mass concentrations in the Athanassoula et al. (2015) simulations, which did not include any initial classical bulge component. Although most of the simulated galaxies had traces of X-shape in their face-on morphology, it is feasible that a somewhat stronger inflow in their models could have created even steeper central rotation slopes and thus more realistic pure barlens morphologies.
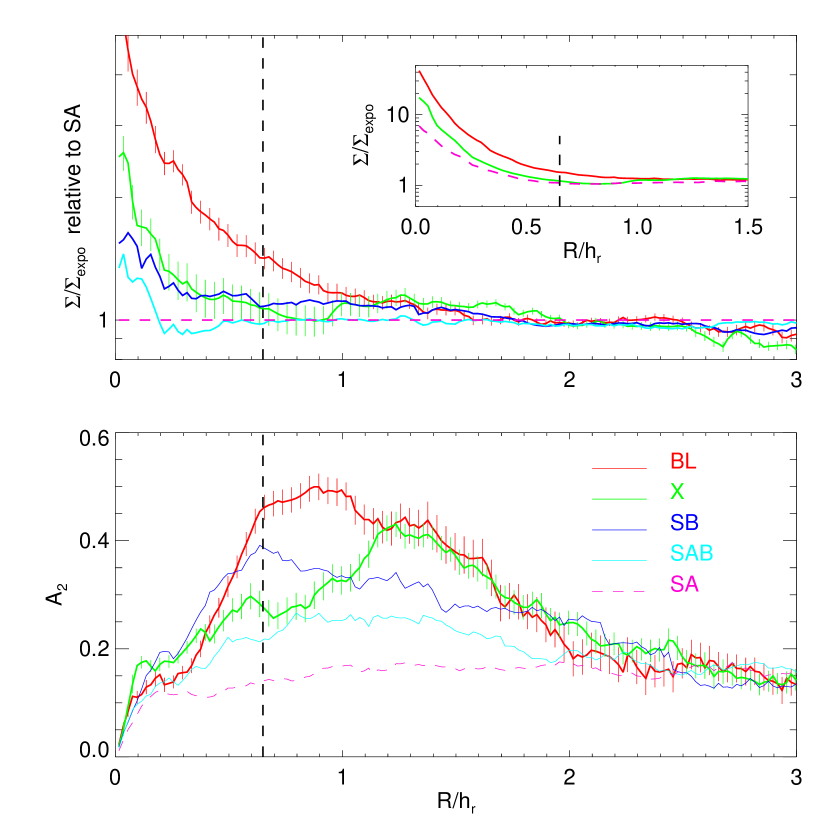
Observational evidence for the possible bar-related growth is provided by Fig. 7, which compares the amount of central density excess in barlens galaxies to other types of barred galaxies (with X, and with those SB, SAB galaxies which do not have barlens or X morphology), and to non-barred SA galaxies. Clearly, barlens galaxies have the strongest central excess (consistent with their early types), both at the region corresponding to the barlens itself, , and in the very center, . Among the different galaxy families, the central excess correlates with the strength of the bar (or non-axisymmetric perturbation in general, here measured in terms of Fourier amplitudes of surface density), supporting the role of bars in building the central concentration. Similar conclusion was recently reached in Díaz-García et al. (2016b) when comparing SB, SAB, and SA galaxies: however the difference is far more pronounced when barlens galaxies are considered.
Nevertheless, the above link between strong bars and central concentrations still leaves open the possibility that the observed central components represent classical bulges which have helped the bars to gain strength, by removing the angular momentum of the bar. Such dependence was seen e.g. in the simulations of (Athanassoula & Misiriotis, 2002), where the bar maximum was nearly doubled in a model that included a classical bulge component, compared to a model with only disk and halo components. However, the classical bulge in those simulation was quite extended and massive, with . In the current simulations with small compact classical bulges the strength of the bar is practically independent of the adopted initial , so that no similar straight-forward conneection can be made. Clearly, spectroscopic observations of the stellar ages and metallicities would be needed to distinguish between the disky pseudo-bulge/classical bulge character of the central concentrations in barlens galaxies.
5 Conclusions
The barlens-sized central light concentrations in early-type disk galaxies are often identified as massive classical bulges. In this paper we have provided further evidence that, at least in the case of barred galaxies, they represent B/P/X/bl structures related to secular evolution of bars. However, the exact morphology at low galaxy inclination depends on the galaxy mass distribution.
Our main conclusions are the following:
1) Stellar dynamical simulations, using parameter values appropriate for MW mass galaxies, indicate that a steeply rising inner rotation curve is required for obtaining a pure barlens morphology (no trace of X in low inclination view). In the current simulations this was achieved by including a small classical bulge to the initial values, or by using a sufficiently centrally concentrated halo. The threshold inner slope in simulations is .
2) The simulated behavior is in qualitative agreement with slopes derived from G 3.6 m images, which indicate that barlens galaxies have steeper baryonic rotation curves ( km/sec/kpc) than the galaxies which exhibit X-signature even at .
3) Comparisons of stacked surface density profiles indicate that barlens galaxies have larger amplitudes than any other type of barred galaxies. They also have the largest relative excess of inner surface density (within ), which can be interpreted as evidence for bar induced inflow in the past.
6 Acknowledgments
We thank the referee for useful suggestions on how to clarify the presentation of the results. This work was supported by the DAGAL network: People Programme (Marie Curie Actions) of the European Unions Seventh Framework Programme FP7/2007-2013 under REA grant agreement number PITN-GA-2011-289313. The grant from Academy of Finland (n:o 297738) is also acknowledged.
References
- (1)
- Athanassoula & Misiriotis (2002) Athanassoula, E., & Misiriotis, A. 2002, MNRAS, 330, 35
- Athanassoula et al. (2005) Athanassoula, E., Lambert, J. C., Dehnen, W. 2005, MNRAS, 363, 496
- Athanassoula, Machado & Rodionov (2013) Athanassoula, E., Machado, R. E. G., Rodionov, S. A. 2013, MNRAS, 429, 1949
- Athanassoula et al. (2015) Athanassoula, E., Laurikainen, E., Salo, H., Bosma, A. 2015 MNRAS 454, 3845
- Athanassoula (2016) Athannasoula, E. 2016, in Galactic Bulges (Eds. Laurikainen, E, Peletier, R, Gadotti, D), Astrophysics and Space Science Library, Volume 418. Springer International Publishing Switzerland, 2016, p. 391
- Athanassoula et al. (2016) Athanassoula, E., Rodionov, S. A., Peschken, N, Lambert, J. C. 2016 ApJ 821, 90
- Brooks & Christensen (2016) Brooks A., Christensen C. 2016, in Galactic Bulges (Eds. Laurikainen, E, Peletier, R, Gadotti, D), Astrophysics and Space Science Library, Volume 418. Springer International Publishing Switzerland, 2016, p. 317
- Bureau et al. (2006) Bureau M., Aronica G., Athanassoula E., et al. 2006, MNRAS, 370, 753
- Buta et al. (2015) Buta, R et al. 2015 ApJS217, 32
- Combes et al. (1990) Combes F., Debbasch F., Friedli D., Pfenniger D. 1990, AA, 233, 81
- Courtois et al. (2009) Courtois, H. M. and Tully, R. B. and Fisher, J. R et al. 2009 AJ138, 1938
- Debattista et al. (2004) Debattista, V.P., Carollo, C.M., Mayer, L., Moore, B. 2004, ApJ 604, L96
- Debattista et al. (2006) Debattista, V. P., Mayer, L., Carollo, C. M., et al. 2006, ApJ, 645, 209
- Díaz-García et al. (2016a) Díaz-García, S, Salo, H., Laurikainen, E, Herrera-Endoqui, M 2016 AA 7, A160
- Díaz-García et al. (2016b) Díaz-García, S, Salo, H., Laurikainen, accepted to AA (arXiv:1607.07317)
- Di Matteo et al. (2013) Di Matteo, P., Haywood, M., Combes, F., Semelin, B., Snaith, O. N. 2013 AA 553, A102
- Erroz-Ferrer et al. (2016) Erroz-Ferrer, S. and Knapen, J. H. and Leaman, R. and Díaz-García et al. 2016 MNRAS 458, 1199
- Erwin & Debattista (2013) Erwin P., Debattista V. 2013, MNRAS, 431, 3060
- Herrera-Endoqui et al. (2015) Herrera-Endoqui, M., Díaz-García, S., Laurikainen, E., Salo, H. 2015, A&A, 582, A86
- Herrera-Endoqui et al. (2016) Herrera-Endoqui, M, Salo, H., Laurikainen, E, Knapen, J., accepted to AA (arXiv:1610.02330)
- Kuijken & Dubinski (1995) Kuijken, K. and Dubinski, J. 1995 MNRAS 277, 1341
- Laurikainen & Salo (2002) Laurikainen, E. and Salo, H. 2002, MNRAS, 337, 1118
- Laurikainen et al. (2007) Laurikainen, E. and Salo, H. and Buta, R. and Knapen, J. H. 2007 MNRAS 381, 401
- Laurikainen et al. (2011) Laurikainen, E. and Salo, H. and Buta, R. and Knapen, J. H. 2011 MNRAS 418, 1452
- Laurikainen et al. (2014) Laurikainen, E., Salo, H., Athanassoula, E. et al. 2014 MNRAS 444, L80
- Laurikainen & Salo (2016) Laurikainen E., Salo, H. 2016, in Galactic Bulges (Eds. Laurikainen, E, Peletier, R, Gadotti, D), Astrophysics and Space Science Library, Volume 418. Springer International Publishing Switzerland, 2016, p. 77
- Laurikainen & Salo (2016) Laurikainen, E. and Salo, H., accepted to AA (arXiv:1609.01936)
- Lelli et al. (2013) Lelli, F., Fraternali, F., Verheijen, M. 2013, MNRAS, 433, L30
- Lütticke, Dettmar Pohlen (2000) Lütticke R., Dettmar R.-J., Pohlen M. 2000, AAS, 145, 405
- Minchev et al. (2012) Minchev, I, and Famaey, B. and Quillen, A. et al. 2012 AA 548, A126
- Munoz-Mateos et al. (2015) Munoz-Mateos J-C. et al. 2015, ApJS, 219, 3
- Patsis et al. (2002) Patsis P.A., Skokos Ch., Athanassoula E., 2002, MNRAS 337, 578
- Pfenniger Friedli (1991) Pfenniger D., Friedli D. 1991, AA, 252, 75
- Quillen et al. (2014) Quillen, A. C., Minchev, I., Sharma, S., et al. 2014 MNRAS 437, 1284
- Querejeta et al. (2015) Querejeta, M. and Meidt, S. E. and Schinnerer, E. and Cisternas, M. et al. 2015 ApJS 219, 4
- Raha et al. (1991) Raha N., Sellwood J. A., James R. A., Kahn F. D., 1991, Nature 352, 411
- Saha et al. (2012) Saha K., Martinez-Valpuesta I., Gerhard O., 2012, MNRAS 421, 333
- Salo et al. (2015) Salo, H., Laurikainen, E., Laine, J., Comeron, S. et al. 2015 ApJS 219, 4
- Salo et al. (1999) Salo, H., Rautiainen, P., Buta, R., et al. 1999, AJ, 117, 792
- Shen and Sellwood (2004) Shen, J., and Sellwood, J. A. 2004 ApJ 604, 614
- Sheth et al. (2010) Sheth, K, et al. 2010 PASP 122, 1397
- Springel & Hernquist (2005) Springel, V, Hernquist, L. 2005 ApJ 622, L9
| Galaxy | Hubble Type | INC | |||||
|---|---|---|---|---|---|---|---|
| km/s/kpc | normalized | km/s | kpc | degrees | |||
| Galaxies with barlenses | |||||||
| IC2051 | SB(s,bl)b | 223 | 4.20 | 155 | 2.92 | 53.2 | 10.58 |
| NGC0613 | SB(s,bl,nr)b | 312 | 8.12 | 211 | 5.50 | 38.9 | 11.09 |
| NGC0936 | (L)SBa(s,bl)0+ | 340 | 7.90 | 188 | 4.37 | 42.4 | 10.93 |
| NGC1015 | (R′)SB(r,bl)0/a | 186 | 5.81 | 123 | 3.87 | 30.5 | 10.39 |
| NGC1022 | (RL)SAB(s,bl,ns)/a | 498 | 6.05 | 153 | 1.86 | 21.6 | 10.19 |
| NGC1079 | (R)S(Ba(s,bl)0 | 227 | 4.52 | 145 | 2.88 | 52.4 | 10.58 |
| NGC1097 | (R′)SB(rs,bl,nr)ab pec | 321 | 9.63 | 265 | 7.96 | 48.1 | 11.24 |
| NGC1300 | (R′)SB(s,bl,nrl)b | 227 | 10.12 | 122 | 5.45 | 33.4 | 10.58 |
| NGC1302 | (RLRL)SAB(l,bl)0+ | 345 | 8.77 | 153 | 3.89 | 15.7 | 10.56 |
| NGC1326 | (R1)SABa(r,bl,nr)0+ | 488 | 7.92 | 190 | 3.09 | 37.2 | 10.55 |
| NGC1350 | (R)SABa(r,bl)0/a | 273 | 8.95 | 158 | 5.18 | 58.2 | 10.82 |
| NGC1398 | (R′R)SB(s,bl)a | 367 | 9.19 | 222 | 5.57 | 42.2 | 11.13 |
| NGC1452 | (RL)SB(s,bl)0/a | 242 | 6.17 | 133 | 3.38 | 53.3 | 10.40 |
| NGC1512 | (R)SB(r,bl,nr)a | 308 | 7.37 | 116 | 2.79 | 42.7 | 10.33 |
| NGC1533 | (RL)SB(bl)0∘ | 447 | 5.97 | 175 | 2.34 | 15.6 | 10.57 |
| NGC1640 | (R′)SBa(r,bl)ab | 255 | 4.14 | 114 | 1.85 | 24.1 | 10.18 |
| NGC2543 | SAB(s,bl)b | 183 | 5.56 | 119 | 3.61 | 59.9 | 10.42 |
| NGC2787 | (L)SBa(r,bl)0∘ | 529 | 5.64 | 148 | 1.59 | 56.2 | 10.23 |
| NGC2859 | (R)SABa(rl,bl,nl,nb)0+ | 365 | 13.93 | 215 | 8.20 | 37.2 | 10.88 |
| NGC2968 | (L)SB(s,bl)0+ | 412 | 6.49 | 126 | 1.99 | 43.1 | 10.10 |
| NGC3351 | (R′)SB(r,bl,nr)a | 374 | 7.57 | 140 | 2.85 | 45.0 | 10.49 |
| NGC3384 | (L)SA(bl)0- | 328 | 4.96 | 156 | 2.37 | 60.8 | 10.49 |
| NGC3489 | (R)SA(r,bl)0∘: | 676 | 4.57 | 146 | 0.99 | 60.1 | 10.14 |
| NGC3941 | (R)SBa(bl)0∘ | 559 | 4.55 | 179 | 1.46 | 50.8 | 10.49 |
| NGC3953 | SB(r,bl)b | 227 | 5.97 | 162 | 4.25 | 58.4 | 10.99 |
| NGC3992 | SB(rs,bl,nb)ab | 187 | 8.77 | 173 | 8.10 | 55.1 | 11.10 |
| NGC4245 | (RL)SB(r,bl,nl)0+ | 423 | 5.05 | 95 | 1.13 | 33.3 | 9.80 |
| NGC4314 | (R1’)SB(r,bl,nr)a | 414 | 7.71 | 118 | 2.20 | 20.4 | 10.14 |
| NGC4371 | (L)SBa(r,bl,nr)0+ | 291 | 7.03 | 145 | 3.52 | 59.0 | 10.51 |
| NGC4394 | (L)SB(rs,bl,nl)0/a | 311 | 7.95 | 116 | 2.97 | 30.4 | 10.44 |
| NGC4448 | (R)SB(r,bl)0/ | 153 | 3.75 | 162 | 3.95 | 71.2 | 10.85 |
| NGC4454 | (RL)SAB(r,bl)0/a | 182 | 4.33 | 143 | 3.39 | 17.6 | 10.66 |
| NGC4548 | SB(rs,bl)b | 339 | 10.55 | 141 | 4.39 | 39.0 | 10.70 |
| NGC4579 | (LR’)SB(rs,bl)a | 444 | 9.04 | 211 | 4.30 | 41.6 | 11.10 |
| NGC4593 | (R′)SB(rs,bl,AGN)a | 373 | 11.22 | 212 | 6.38 | 33.4 | 10.93 |
| NGC4596 | (L)SB(rs,bl)/a | 356 | 8.59 | 159 | 3.84 | 35.5 | 10.68 |
| NGC4639 | (R′)SA(rs,bl)ab | 289 | 4.09 | 134 | 1.90 | 49.2 | 10.32 |
| NGC4643 | (L)SB(s,bl,nl)0+ | 332 | 7.45 | 228 | 5.11 | 36.8 | 11.03 |
| NGC4754 | (L)SBa(bl)0∘ | 393 | 8.08 | 167 | 3.43 | 59.7 | 10.64 |
| NGC4795 | (R′)SA(l,bl)a pec | 200 | 5.05 | 157 | 3.98 | 43.7 | 10.74 |
| NGC4984 | (R′R)SABa(l,bl,nl)0/a | 479 | 11.31 | 217 | 5.14 | 53.9 | 10.69 |
| NGC5101 | (R1R2’)SB(s,bl)0/a | 314 | 10.07 | 218 | 6.99 | 22.0 | 11.11 |
| NGC5134 | (R)SAB(rs,bl)a | 411 | 4.87 | 103 | 1.23 | 14.7 | 9.90 |
| NGC5339 | SA(rs,bl)ab | 120 | 3.84 | 123 | 3.94 | 38.8 | 10.51 |
| NGC5347 | SB(rs,bl)a | 427 | 4.92 | 174 | 2.01 | 22.8 | 9.90 |
| NGC5375 | (R′)SBa(rs,bl)b | 163 | 6.52 | 138 | 5.54 | 29.8 | 10.72 |
| NGC5701 | (R1’)SA(rl,bl)0/a | 249 | 6.92 | 162 | 4.51 | 15.2 | 10.69 |
| NGC5728 | (R1)SB(l,bl,nr,nb)0/a | 253 | 8.47 | 179 | 6.01 | 43.0 | 10.85 |
| NGC5750 | (RL)SAB(r′l,s,bl)0/a | 149 | 3.79 | 153 | 3.90 | 60.2 | 10.74 |
| NGC5770 | SAB(l,bl)0+ | 345 | 4.03 | 132 | 1.55 | 22.4 | 10.10 |
| NGC5850 | (R′)SB(r,bl,nr,nb)b | 260 | 10.46 | 139 | 5.59 | 36.0 | 10.77 |
| NGC5957 | (R′)SA(rs,bl)b | 150 | 5.88 | 111 | 4.37 | 25.4 | 10.26 |
| NGC6014 | SAB(rs,bl)/a | 191 | 3.92 | 119 | 2.45 | 35.3 | 10.33 |
| NGC7079 | (L)SA(s,bl)0∘: | 253 | 3.64 | 165 | 2.38 | 51.3 | 10.64 |
| Galaxies with X | |||||||
| ESO404-027 | SAB(s)b: | 71 | 3.14 | 78 | 3.43 | 69.0 | 10.13 |
| IC1067 | SB(r,bl)b | 175 | 3.34 | 91 | 1.74 | 38.3 | 9.91 |
| IC3806 | SA(r)0+ | 62 | 1.71 | 65 | 1.78 | 65.2 | 9.49 |
| IC4237 | SB(r)b | 87 | 2.21 | 135 | 3.41 | 46.2 | 10.53 |
| IC5240 | SBx(r)0/a | 170 | 4.80 | 122 | 3.44 | 45.0 | 10.45 |
| NGC0532 | SABxa(r)0/a | 109 | 3.70 | 118 | 4.01 | 73.6 | 10.55 |
| NGC0615 | (R’)SAx(r)b | 236 | 4.82 | 149 | 3.05 | 66.0 | 10.54 |
| NGC0779 | (L)SAx(rs)a | 175 | 2.50 | 130 | 1.86 | 70.3 | 10.35 |
| NGC1461 | SB(r)0∘ | 231 | 3.90 | 131 | 2.21 | 70.8 | 10.40 |
| NGC1476 | Im sp | 40 | 1.36 | 44 | 1.48 | 66.3 | 9.14 |
| NGC2654 | SBx(r,nd)0/a sp | 175 | 2.81 | 146 | 2.35 | 74.3 | 10.56 |
| NGC2683 | (R’L)SBxa(rs)0/a sp | 236 | 3.30 | 163 | 2.29 | 74.9 | 10.62 |
| NGC3185 | (RL)SABax(rs,bl)a | 237 | 4.59 | 115 | 2.23 | 49.5 | 10.22 |
| NGC3254 | SAb | 111 | 5.64 | 106 | 5.40 | 73.3 | 10.57 |
| NGC3301 | (R’L)SABx(r)0+ sp | 286 | 6.13 | 139 | 2.99 | 71.7 | 10.45 |
| NGC3380 | (R)SAB(s,bl)0/a | 204 | 3.98 | 102 | 1.99 | 20.8 | 9.96 |
| NGC3424 | Sb: sp pec | 173 | 3.42 | 143 | 2.83 | 75.8 | 10.43 |
| NGC3623 | (R’)SABx(rs)a | 231 | 5.25 | 175 | 3.98 | 73.7 | 10.91 |
| NGC3673 | (R’)SA(rs)ab | 166 | 4.65 | 122 | 3.41 | 52.6 | 10.51 |
| NGC3692 | (R’L)SA(r)0/a sp | 94 | 1.76 | 135 | 2.51 | 75.6 | 10.54 |
| NGC3887 | (RL)SA(rs)bc | 193 | 3.38 | 145 | 2.54 | 32.9 | 10.48 |
| NGC4123 | SBx(rs)a | 259 | 10.42∗ | 99 | 3.99 | 46.9 | 10.29 |
| NGC4192 | (R1’)SABx(rs,nd)b | 270 | 13.06 | 140 | 6.79 | 72.0 | 10.77 |
| NGC4216 | (R2’)SABax(r,nd)b sp/E7-8 | 194 | 6.76 | 158 | 5.50 | 79.6 | 11.00 |
| NGC4220 | (L)SAB(r)0+ | 189 | 2.61 | 130 | 1.79 | 72.4 | 10.36 |
| NGC4235 | Sx0+ sp | 257 | 5.28 | 135 | 2.77 | 72.0 | 10.50 |
| NGC4268 | SB(s)0+: sp | 194 | 3.80 | 121 | 2.38 | 60.9 | 10.24 |
| NGC4293 | (L)SBx(r)0/a | 313 | 9.15 | 119 | 3.48 | 62.1 | 10.42 |
| NGC4419 | SA0/ sp/E6 | 331 | 2.96 | 165 | 1.48 | 71.3 | 10.46 |
| NGC4462 | SABx(rs)a | 188 | 3.70 | 137 | 2.69 | 63.3 | 10.54 |
| NGC4569 | (R’L)SA(rs,x1r)a | 391 | 11.32 | 136 | 3.96 | 66.0 | 10.64 |
| NGC4586 | SA(s,nd)0/a sp | 218 | 6.32 | 90 | 2.62 | 69.8 | 10.13 |
| NGC4725 | (R’)SABx(r,nb)a | 366 | 10.90∗ | 162 | 4.84 | 46.8 | 10.88 |
| NGC4818 | (RL)SA(s)0 | 342 | 7.52 | 141 | 3.10 | 67.2 | 10.48 |
| NGC4845 | (R’L)SABx(r’l,nd)0/a | 262 | 10.59 | 135 | 5.44 | 75.1 | 10.55 |
| NGC4856 | (RL)SB0- | 277 | 5.75 | 172 | 3.58 | 68.7 | 10.74 |
| NGC4902 | SB(s,bl)a | 206 | 4.23 | 209 | 4.30 | 21.5 | 11.05 |
| NGC5005 | (R2’)SABxa(rs)ab | 396 | 5.99 | 244 | 3.70 | 66.7 | 11.10 |
| NGC5297 | SABx(s)bc sp | 78 | 2.57 | 126 | 4.16 | 73.6 | 10.60 |
| NGC5443 | (R’L)SABx(rs)a sp | 139 | 5.08 | 119 | 4.36 | 68.0 | 10.49 |
| NGC5448 | (R1L)SABx(s)a | 167 | 8.43 | 143 | 7.24 | 65.4 | 10.77 |
| NGC5689 | (R’L)SABx(r’l,nd)/a | 181 | 5.85 | 171 | 5.53 | 74.4 | 10.84 |
| NGC5757 | (R’)SB(rs)b | 248 | 4.65 | 177 | 3.32 | 32.7 | 10.74 |
| NGC5806 | (R’L)SAB(rs,nrl)ab | 228 | 4.20 | 147 | 2.72 | 56.5 | 10.59 |
| NGC5854 | (RL)SA(rl)0+ sp | 189 | 3.76 | 119 | 2.37 | 71.1 | 10.23 |
| NGC5864 | (R)SBxa0+ sp | 139 | 2.48 | 120 | 2.14 | 71.6 | 10.35 |
| NGC5878 | SABxa(rs)ab | 185 | 5.13 | 149 | 4.14 | 68.1 | 10.77 |
| NGC7140 | (R’)SA(rs,nrl)a | 161 | 7.39∗ | 126 | 5.80 | 49.8 | 10.70 |
| NGC7163 | SABx(s)a | 206 | 5.46 | 101 | 2.67 | 57.5 | 10.13 |
| NGC7171 | SABx(s)b | 87 | 2.82 | 127 | 4.13 | 57.5 | 10.58 |
| NGC7179 | SBxa(l)0/a | 100 | 2.48 | 135 | 3.33 | 58.9 | 10.60 |
| NGC7421 | (R′)SB(rs,bl)ab | 132 | 2.93 | 102 | 2.26 | 27.9 | 10.15 |
| NGC7513 | (R’L)SB(rs)a | 102 | 3.09 | 101 | 3.05 | 48.4 | 10.21 |
| NGC7531 | SABx(r)a | 221 | 3.90 | 144 | 2.55 | 57.5 | 10.44 |
| PGC045650 | SA(s)ab | 185 | 2.38 | 136 | 1.76 | 72.7 | 10.37 |
Note. — The inner slope and the maximum velocity are calculated from the S4G 3.6 images, the stellar masses are from (Munoz-Mateos et al., 2015), the disk scale length and inclination are from Salo et al. (2015). Normalized indicates scaling of the inner slope with : the X-shape galaxies with and normalized are marked with an asterisk. The barlens classifications are from Buta et al. (2015) and Laurikainen et al. (2011), and the X classifications from Laurikainen & Salo (2016).