Tagging fast neutrons from a 252Cf fission-fragment source
Abstract
Coincidence and time-of-flight measurement techniques are employed to tag fission neutrons emitted from a 252Cf source sealed on one side with a very thin layer of Au. The source is positioned within a gaseous 4He scintillator detector. Together with particles, both light and heavy fission fragments pass through the thin layer of Au and are detected. The fragments enable the corresponding fission neutrons, which are detected in a NE-213 liquid-scintillator detector, to be tagged. The resulting continuous polychromatic beam of tagged neutrons has an energy dependence that agrees qualitatively with expectations. We anticipate that this technique will provide a cost-effective means for the characterization of neutron-detector efficiency in the energy range 1 – 6 MeV.
keywords:
californium-252, fission fragments, fast neutrons, time-of-flight, tagging1 Introduction
We recently reported on our efforts to “tag” fast neutrons from an 241Am/9Be source [1] as the first step towards the development of a source-based fast-neutron irradiation facility. Here, we report on our investigation of a 252Cf fission-fragment fast-neutron tagging technique very similar to that reported on by Reiter et al. [2]. In contrast to Reiter et al. who employed a thin layer of plastic scintillator to detect the fragments, we use a gaseous 4He-based scintillator detector. The corresponding fission neutrons are detected in a NE-213 [3] liquid-scintillator detector. This effort represents our first step towards the development of an apparatus for the measurement of absolute neutron-detection efficiency at our facility.
2 Apparatus
2.1 Californium fission-fragment source
252Cf is an intense source of fast neutrons. With an overall half life of 2.645 years and a specific activity of 0.536 mCi/g, it decays by both -particle emission (96.908%) and spontaneous fission (3.092%) [4]. The weighted average -particle energy is 6111.69 keV. The prompt-neutron yield is 3.75 neutrons per fission event [5, 6]. The resulting fast-neutron energy spectrum follows the Watt distribution [7] and is very well known, with a most-probable energy of 0.7 MeV and an average energy of 2.1 MeV. Our californium source [8] has an active diameter of 5 mm and is mounted a capsule that has a thick platinum-clad nickel backside and a thin 50 g/cm2 sputtered-gold front side which allows both particles and fission fragments to escape. The (nominal) activity is 3.7 MBq [9]. While trace activity comes from 249Cf (0.2%) and 251Cf (0.04%), the majority comes from 250Cf (7.5%) and 252Cf (92.3%). We estimate a neutron emission rate of 4 105 neutrons per second.
2.2 Gaseous 4He fission-fragment detector
The noble gas 4He is a good scintillator with an ultra-violet light yield of about the same magnitude as intrinsic (non Tl-doped) NaI crystals [10, 11, 12, 13]. In this measurement, we employed a gas cell built originally as a prototype active target for recent 4He photoreaction measurements [14]. The cell was machined from a solid aluminum block and has a cylindrical interior volume measuring 72 mm long 58 mm , for an inner volume of 0.35 liters (see Fig. 1).
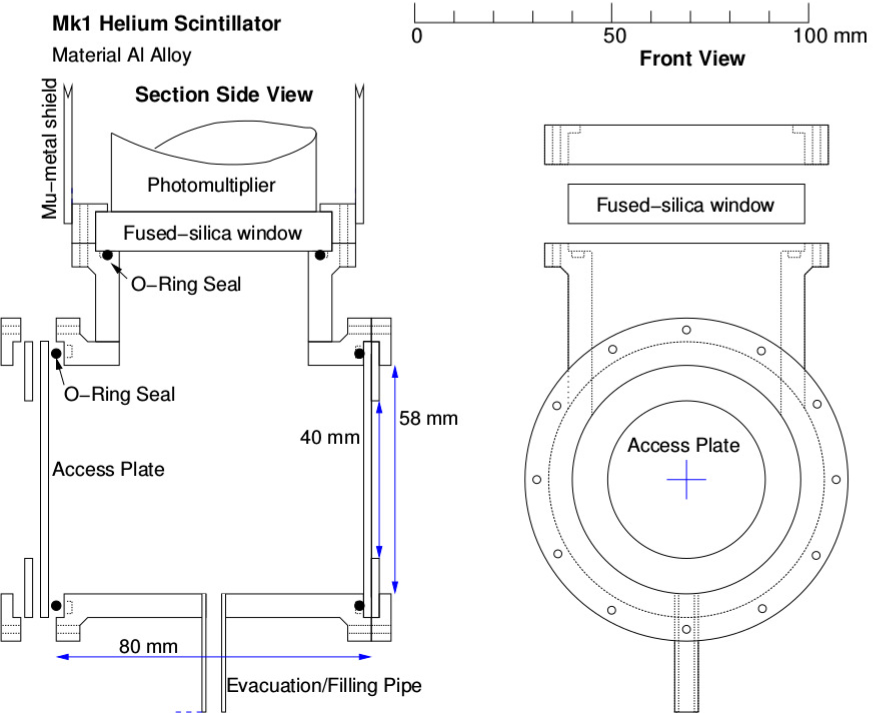
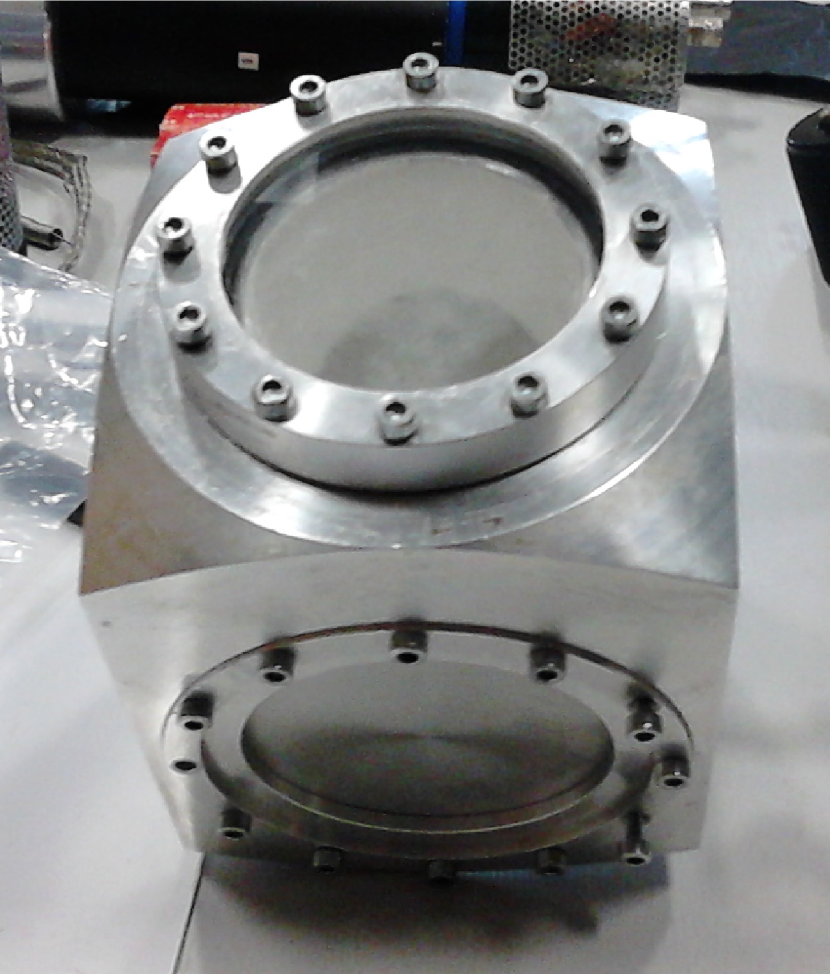
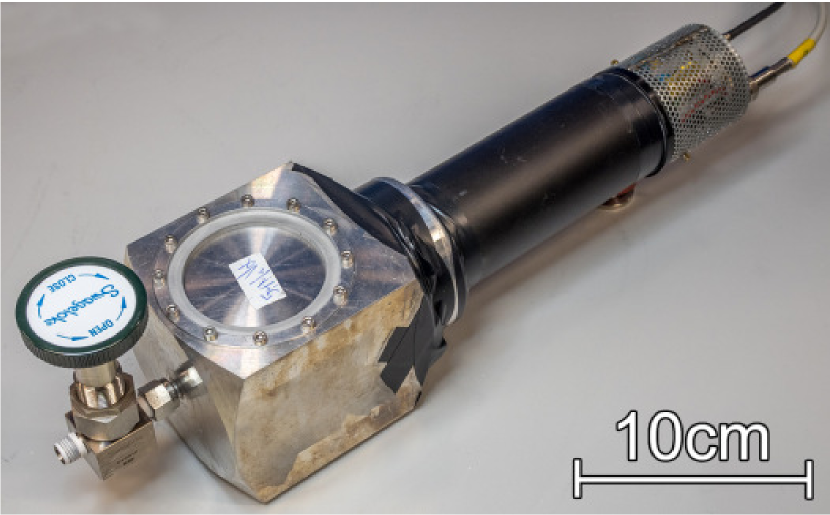
The interior of the gas cell was sandblasted and then treated with two layers of water soluable EJ-510 reflective paint [15]. A fused-silica optical window 10 mm thick 60 mm is pressed against the body of the cell and allows the scintillation light produced by the particles and fission fragments to escape. A rubber O-ring provides the pressure seal. The cell was filled with 5 bar 99.99999% pure 4He (scintillator) gas together with 2.5 mbar 99.99999% pure N2 (scintillation-wavelength shifter) gas. A photograph of the assembled cell is shown in the left panel of Fig. 2. A 5.08 cm XP2262B photomultiplier tube (PMT) [16] was attached to the optical window and EJ-550 optical grease [17] was employed at the boundary. A photograph of the assembled detector (gas cell and PMT) is shown in the right panel of Fig. 2.
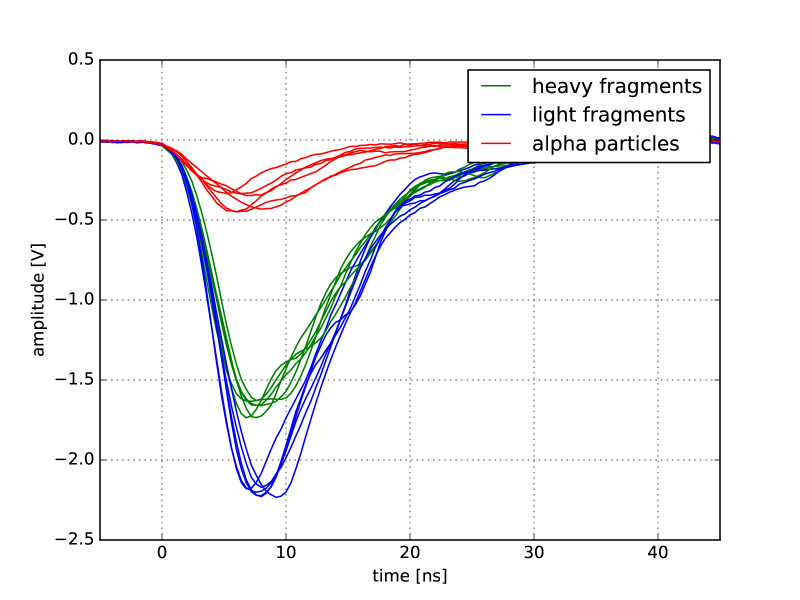
The californium source described above was positioned at the center of the gas cell so that the thin front side through which the particles and fission fragments could escape faced away from the PMT. The distance from the californium source to the center of the fused-silica optical window was 65 mm. Operating voltage for the PMT was 1750 V and the discriminator threshold was set at 60 mV. Typical signal risetime was 5 ns, while the falltime to 10% of the original amplitude was 10 ns. Figure 3 shows some typical detector pulses obtained with the 4He gas cell. The top traces with amplitudes of about 350 mV correspond to particles. The middle traces with amplitudes of about 1600 mV correspond to heavy fission fragments. The bottom traces with amplitudes of about 2200 mV correspond to light fission fragments. We note that the average -particle energy is 6.1 MeV, while the average heavy fission-fragment energy is 80 MeV and the average light fission-fragment energy is 104 MeV [25]. See also the histogram presented in Fig. 6.
2.3 NE-213 fast-neutron and gamma-ray liquid-scintillator detector
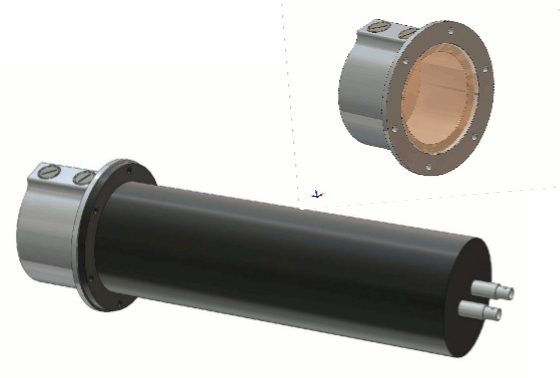
NE-213 is an organic liquid scintillator that has been employed for decades as a fast-neutron detector. The NE-213 liquid-scintillator detector used here has been reported upon earlier [1, 18, 19]. It consisted of a 62 mm long 94 mm cylindrical aluminum “cup” fitted with a borosilicate glass optical window [20]. The filled cell was dry-fitted against a cylindrical PMMA UVT lightguide [21] and coupled to a -metal shielded 7.62 cm ET Enterprises 9821KB PMT and base [22]. Operating voltage was set at about 1900 V, and the energy calibration was determined using standard gamma-ray sources together with a slightly modified version of the method of Knox and Miller [23] as described in Ref. [19]. The detector threshold was set at 150 keV electron equivalent (keVee), corresponding to a neutron depositing an energy of about 1 MeV.
2.4 Configuration
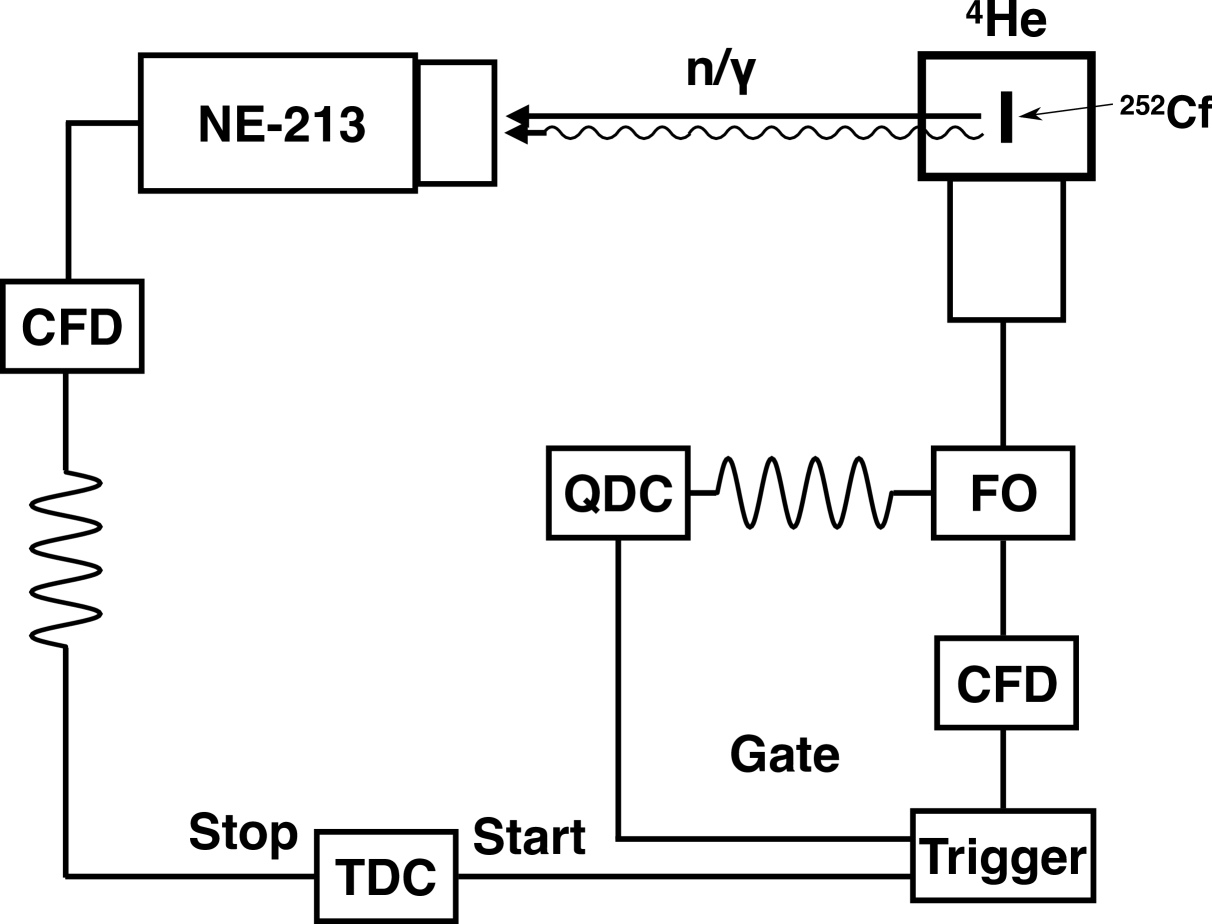
A block diagram of the electronics is shown in Fig. 5. particles and fission fragments were detected in the 4He scintillator detector and corresponding neutrons (and gamma-rays) were detected in the NE-213 detector. The analog signals from the NE-213 detector were passed to a Phillips Scientific (PS) 715 NIM constant-fraction timing discriminator (CFD). The analog signals from the 4He scintillator detector were fanned out (FO) and passed to a PS 715 NIM CFD as well as a CAEN V792 12-bit (DC-coupled 60 ns gate) VME QDC. The CFD signals from the 4He scintillator detector were used to trigger the data-acquisition (DAQ) and thus provided start signals for a CAEN 1190B VME multihit time-to-digital converter (TDC) used for the neutron time-of-flight (TOF) determination. The NE-213 detector provided the corresponding stop signal. A SIS 1100/3100 PCI-VME bus adapter was used to connect the VMEbus to a LINUX PC-based DAQ system. The signals were recorded and processed using ROOT-based software [24].
3 Results
Figure 6 shows a deposited-energy spectrum measured using the 4He scintillator detector. The top panel is plotted on a logarithmic scale to better illustrate the overall features of the spectrum, while the bottom panel is plotted on a linear scale to emphasize certain of these features. The very sharp leftmost peak in the figure located at about channel 80 is the pedestal or zero-energy bin in the QDC. Just to the right of the pedestal is the edge corresponding to our hardware threshold located at about channel 140. Recall that this discriminator threshold was 60 mV. The particles which dominate the spectrum and correspond to the red trace in Fig. 3 correspond to the peak centered at about channel 190. Note that the entire -particle distribution is not shown as the hardware threshold cuts into it. A distribution corresponding to heavy fission fragments (green trace in Fig. 3) is shown here centered at channel 950, while that corresponding to light fission fragments (blue trace in Fig. 3) is centered at channel 1310). Separation of fission fragments and particles is not completely clean, as seen in the grey shaded area of Fig. 6 between channels 230 and 540. This could result from non-uniform scintillation-light collection, different energy losses of different particle types in the source as well as the thin Au source window, non-linearity of the scintillation, or even fission fragments striking the source holder. This will be examined in more detail in a future publication. Recall that the average -particle energy is 6.1 MeV, while the average heavy fission-fragment energy is 80 MeV and the average light fission-fragment energy is 104 MeV. If we calibrate our QDC based upon the average energy deposition of the two types of fission fragments and then apply this calibration to the -particle distribution, we reconstruct the peak at 12 MeV. 4He is often assumed to be a linear scintillator, while this preliminary analysis suggests an apparent non-linearity. However, as outlined above, there are several factors which will affect the apparent scintillation-pulse height. The degree of non-linearity in the scintillation (if any) requires an in-depth study. Note that for the data presented subsquently in this paper, a software fission-fragment cut located at channel 520 was employed.
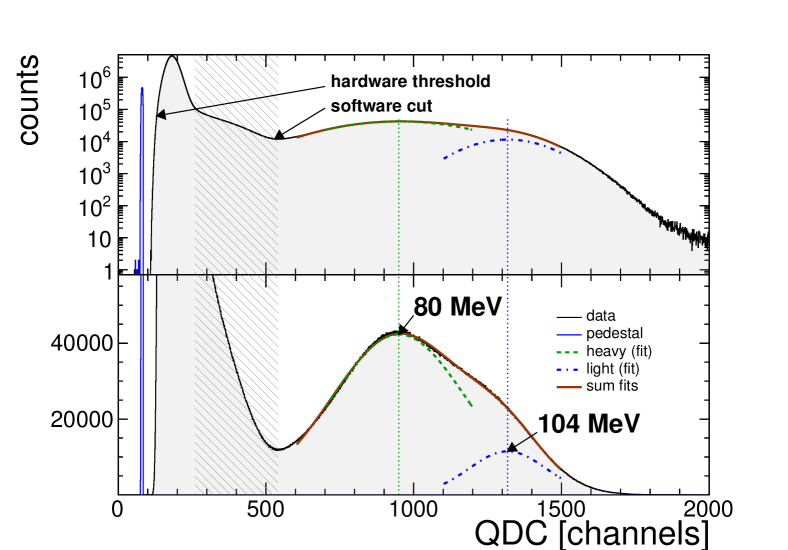
Figure 7 shows a fission-neutron TOF spectrum obtained using the signal in the 4He scintillator detector to start a TDC and a signal from the NE-213 detector to stop it. Note that the spectrum shown corresponds to events lying above the software fission-fragment cut at channel 520 shown in Fig. 6. After this cut, interpretation of the resulting TOF spectrum is straightforward. The sharp peak to the left of the spectrum centered at about 5 ns and labeled “gamma-flash” corresponds to the detection of a fission fragment in the 4He scintillator detector and a correlated fission-event gamma-ray in the NE-213 detector. The 1.8 ns FWHM of the gamma-flash distribution is consistent with the observed timing jitter on our PMT signals and the slight tail in the distribution is possibly due to time walk in the electronics. Note that 4He scintillator is highly insensitive to gamma-rays [18, 14] and any electrons produced via Compton scattering or pair production will result in only a very small scintillation signal. These events will be entirely suppressed by the relatively high software cut we have applied on the signals from the 4He scintillator detector. Thus, the present apparatus is almost completely insensitive to fission-associated multiple gamma-ray events. The broad bump centered at about 55 ns corresponds to the fission-neutron distribution. The underlying background distribution corresponds to random coincidences. It was measured to be flat as expected by breaking the line-of-sight between the 4He scintillator detector and the NE-213 detector using a stack of lead (15 cm) and polyethylene (10 cm).
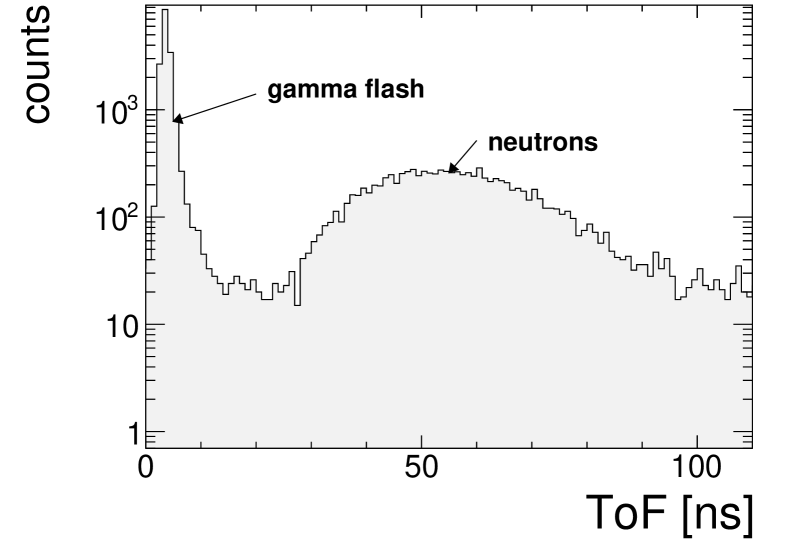
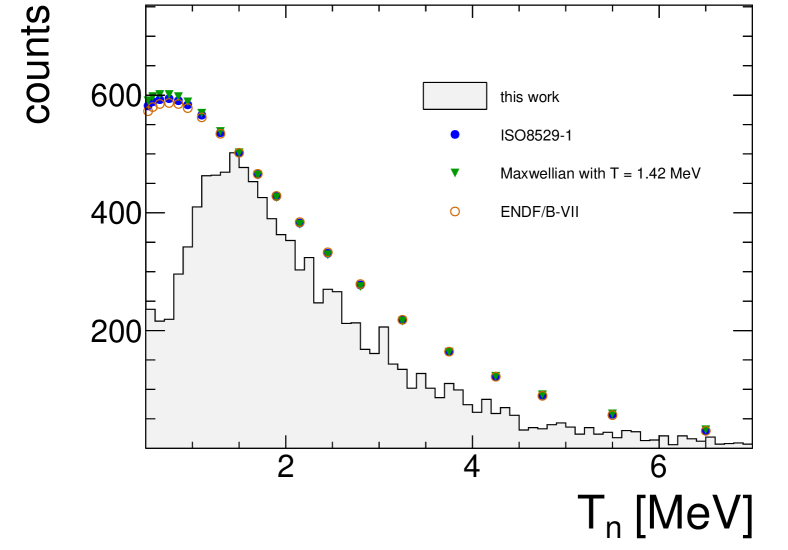
Figure 8 shows the fission-neutron TOF spectrum from Fig. 7 converted to a neutron kinetic-energy spectrum. To convert from TOF to neutron kinetic energy, we used the 5 ns position of the gamma-flash shown in Fig. 7 and the 106 cm distance between the 252Cf source and the center of the NE-213 liquid-scintillator cell. The data were then rebinned linearly in kinetic energy. Also shown are three representations of the neutron-kinetic energy distribution constructed using the information presented by Thomas in Ref. [26]. We note that there are small differences between the representations, so a normalization factor has been applied to each so that they coincide with our data at 1.5 MeV. It should be emphasized that the present data have not been corrected for neutron-detection efficiency and that, with the present hardware neutron-detector threshold, neutron energies below 1 MeV cannot be corrected for reliably. At 1 MeV, the agreement between all three representations is essentially exact. Between 1 MeV and 4 MeV, the Maxwellian approximation and the ISO 8529-1 representation both lie below the ENDF/B-VII suggestion by 2% and 1%, respectively. By 5 MeV, the agreement between all three is again essentially exact. Above 6 MeV, a divergence between the representations begins and by 8 MeV, both the Maxwellian and the ISO 8529-1 representations lie above the ENDF/B-VII suggestion by about 9% and 4%, respectively. The 1% level of agreement between all three representations of the 252Cf fission-neutron energy spectrum over the energy region from 1 to 6 MeV is well within any systematic uncertainty that we are likely to obtain in measurements of neutron-detection efficiency using the tagging technique presented here. Thus, they provide an excellent benchmark from which it will be possible to evaluate the neutron-detection efficiency.
4 Summary
As a first step towards the development of an apparatus for the measurement of neutron-detection efficiency at our source-based fast-neutron irradiation facility, we have employed coincidence and time-of-flight measurement techniques to “tag” neutrons emitted by a 252Cf source. The spontaneous-fission fragments are detected in a gaseous 4He scintillator detector. The neutrons are detected in a NE-213 liquid-scintillator detector. The resulting continuous polychromatic beam of tagged neutrons has a measured energy dependence that agrees qualitatively with expectations. This preliminary study strongly suggests that the method of neutron-energy tagging will work well and future investigations will concentrate on quantifying systematic effects in order to optimize the performance. We anticipate that the technique will provide a cost effective means for the characterization of neutron-detector efficiency, and note that this technique will work equally well for all spontaneous-fission neutron sources.
Acknowledgements
We acknowledge the support of the UK Science and Technology Facilities Council (Grant nos. STFC 57071/1 and STFC 50727/1) and the European Union Horizon 2020 BrightnESS Project, Proposal ID 676548.
References
- [1] J. Scherzinger et al., Applied Radiation and Isotopes 98 (2015) 74, doi: 10.1016/j.apradiso.2015.01.003.
- [2] A. Reiter et al., Nucl. Instr. and Meth. in Phys. Res. A 565 (2006) 753, doi: 10.1016/j.nima.2006.06.048.
- [3] NE-213 is no longer produced. Eljen Technologies offers EJ-301 (http://www.eljentechnology.com/index.php/products/liquid-scintillators/71-ej-301) while Saint Gobain offers BC-501 (http://www.detectors.saint-gobain.com/uploadedFiles/SGdetectors/Documents/Product_Data_Sheets/BC501-501A-519-Data-Sheet.pdf).
- [4] http://www.nndc.bnl.gov/nudat2/.
- [5] J.W. Boldeman, M.G. Hines, Nucl. Sci. Eng. 91 (1985) 114.
- [6] E.J. Axton, A.G. Bardell Metrologia 21 (1985) 59.
- [7] F.H. Fröner, Nucl. Sci. Eng. 106 (1990) 345.
- [8] Supplied by Eckert&Ziegler Isotope Products GmbH.
- [9] Testing performed 1 April 2015 at Eckert&Ziegler Isotope Products Medical Imaging Laboratory, 24937 Avenue Tibbitts, Valencia CA 91355, USA.
- [10] The theory and practice of scintillation counting, J.B. Birks, D.W. Fry, L. Costrell, K. Kandish, Pergamon Press, New York, U.S.A. (1964), ISBN: 978-0-08-010472-0.
- [11] The mechanism of noble gas scintillation, in Elementary particles and cosmic rays, B.A. Dolgosheim, B.U. Rodionov, Volume 2, Atomizdat, Moscow Russia (1969).
- [12] Radiation detection and measurement, G.F. Knoll, Wiley, New York, U.S.A. (1989), ISBN: 9780471815044, http://books.google.com/books?id=dyBRAAAAMAAJ.
- [13] Scintillation detectors, in Noble gas detectors, E. Aprile, A.E. Bolotnikov, A.I. Bolozdynya, T. Doke, Wiley-VCH Verlag GmbH, KGaA, Weinheim Germany (2006), ISBN: 978-3-527-40597-8
- [14] R. Al Jebali et al., Eur. Phys. J. A 51 123 (2015). doi: 10.1140/epja/i2015-15123-y.
- [15] http://www.eljentechnology.com/index.php/products/paints/86-ej-510.
- [16] https://my.et-enterprises.com/pdf/XP2262.pdf
- [17] http://www.eljentechnology.com/images/products/data_sheets/EJ-550_EJ-552.pdf
- [18] R. al Jebali et al., Nucl. Instr. and Meth. in Phys. Res. A 794 (2015) 102, doi:10.1016/j.nima.2015.04.058.
- [19] J. Scherzinger et al., Nucl. Instr. and Meth. in Phys. Res. A 840 (2016) 121, doi:10.1016/j.nima.2016.10.011.
- [20] http://www.us.schott.com/borofloat/english/index.html for details. Supplied by Glasteknik i Emmaboda AB, Utvägen 6 SE-361 31 Emmaboda, Sweden.
- [21] Poly(methyl-methacrylate), also known as acrylic, plexiglass, and lucite. Supplied by Nordic Plastics Group AB, Bronsyxegatan 6, SE-213 75 Malmö, Sweden.
- [22] www.et-enterprises.com/files/file/Pmtbrochure11.pdf for details.
- [23] H.H. Knox, T.G. Miller, Nucl. Instrum. and Meth. 101 (1972) 519.
- [24] R. Brun and Fons Rademakers, Proceedings AIHENP’96 Workshop, Lausanne, Sep. 1996; Nucl. Instr. and Meth. in Phys. Res. A 389 (1997) 81-86. See also http://root.cern.ch/.
- [25] J. van Aarle et al., Nucl. Phys. A578 (1994) 77, doi:10.1016/0375-9474(94)90970-9.
- [26] D. Thomas, ESARDA Bulletin 51 (2014) 45.