2016/07/01 \Accepted2016/11/07 \Published \SetRunningHeadQ. Wada et al.An X-ray Study of Dwarf Novae with Suzaku
binaries: close — stars: dwarf novae — stars: novae, cataclysmic variables — X-rays: stars
A Systematic X-ray Study of the Dwarf Novae Observed with Suzaku
Abstract
X-ray behavior of the dwarf novae (DNe) outside the quiescent state has not been fully understood. We thus assembled 21 data sets of the 15 DNe observed by the Suzaku satellite by the end of 2013, which include spectra taken during not only the quiescence, but also the transitional, outburst, and super-outburst states. Starting with the traditional cooling flow model to explain the X-ray emission from the boundary layer, we made several modifications to account for the observed spectra. As a result, we found that the best-fit spectral model depends strongly on the state of the DNe with only a few exceptions. Spectra in the quiescent state are explained by the cooling flow model plus a Fe fluorescent line emission attenuated by an interstellar extinction. Spectra in the transitional state require an additional partial covering extinction. Spectra in the outburst and super-outburst state require additional low-temperature thin-thermal plasma component(s). Spectra in the super-outburst state further require a high value of the minimum temperature of the boundary layer. We present an interpretation on the required modifications to the cooling flow model for each state.
1 Introduction
Dwarf novae (DNe) are semi-detached close binary systems consisting of a late-type star and a white dwarf (WD) with a weak magnetic field (106 G; [van Teeseling et al. (1996)]). The gas of the secondary star fills the Roche lobe and flows onto the WD. The accreting gas has an angular momentum, and an accretion disk is formed around the WD (see [Warner (1995)] for a review of DNe). The accretion disk has two stable states, in which the hydrogen is either neutral (103 K) or is fully ionized (104 K). These states correspond to the quiescent and the outburst state, respectively, in the optical light curve. The transition between the quiescent state and the outburst state is considered to be caused by thermal instability of the accretion disk (Osaki, 1974; Hōshi, 1979; Meyer & Meyer-Hofmeister, 1981). Some DNe also show super-outbursts, which are brighter and longer than normal outbursts. This is probably caused by thermal and tidal instability of the disk (Whitehurst, 1988; Osaki, 1989; Hirose & Osaki, 1990).
These sources are also known as copious EUV and X-ray photon emitters. Whereas the gas in the inner edge of the accretion disk follows the Kepler rotation, the rotation velocity of the WD is much slower. Therefore, when the gas falls to the WD surface, it is decelerated by a strong frictional force, and the kinetic energy is dissipated into thermal energy. This region is called the boundary layer (BL), and its temperature is heated to 108 K. The strong EUV and X-rays are mainly emitted from this region.
Baskill et al. (2005) and Pandel et al. (2005) carried out a systematic study of X-ray emission from DNe using the archival data set of the ASCA and XMM-Newton observatories, respectively. These authors revealed that the BL consists of optically thin multi-temperature plasma, that is explained by isobaric cooling flow model in the quiescent state. They also reported that spectra in the outburst state deviate from the isobaric cooling flow model. However, the number of samples in the outburst state is small in their data sets, thus the X-ray behavior of DNe during non-quiescent state was not fully described yet.
In this paper, we use the Suzaku X-ray archival data. A rich data set is found in the archive, including the quiescent, transition, outburst, and super-outburst states for the same several sources. Therefore, our catalog supplements the previous two studies and is well suited to investigate differences in the X-ray behavior among the states. There are two purposes of this paper; (1) to present a DNe X-ray spectral catalog from the Suzaku archive, and (2) to describe general X-ray spectroscopic features during each state.
2 Observations & Reduction
2.1 Suzaku
We used the archival data of the Suzaku satellite (Mitsuda et al., 2007). Suzaku has two instruments: one is the X-ray Imaging Spectrometer (XIS; Koyama et al. (2007)) and the other is the Hard X-ray Detector (HXD; Kokubun et al. (2007); Takahashi et al. (2007)). We concentrated on the XIS data, since no significant signals were detected with HXD for most data sets.
The XIS consists of four X-ray CCD cameras, each of which is located in the focal plane of the X-Ray Telescope (XRT; Serlemitsos et al. (2007)) modules. The XIS has a sensitivity in an energy range of 0.2–12.0 keV band. The XIS0, 2, and 3 are front-illuminated (FI) devices, while XIS1 is a back-illuminated (BI) device. The former has a higher quantum efficiency in the hard band, while the latter has in the soft band. The combination of the XIS and the XRT offers an imaging capability to cover a field of view of 17\farcm817\farcm8. The entire XIS2 and a part of XIS0 have been dysfunctional since 2006 November 9 and 2009 June 23, respectively, due to putative micro-meteorite hits. We thus used the remaining part of XIS0, XIS1, and XIS3 in all the data set.
2.2 Data set
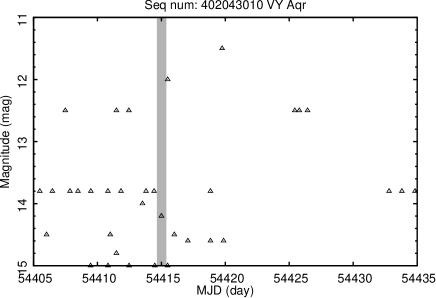
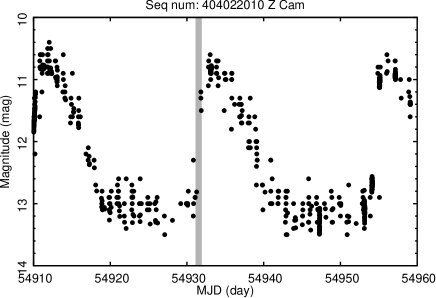
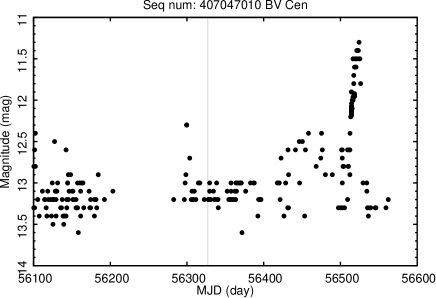
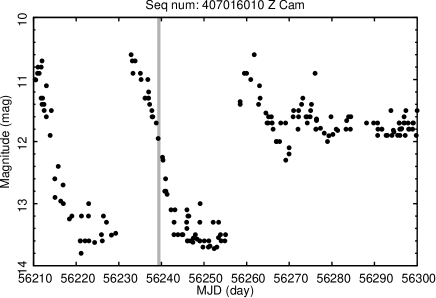
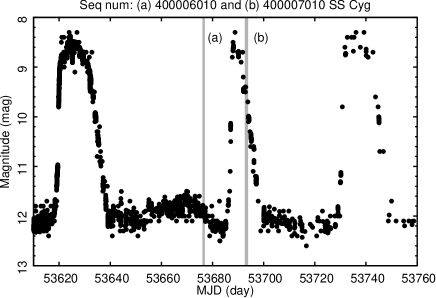
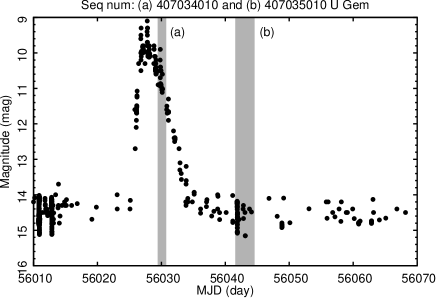
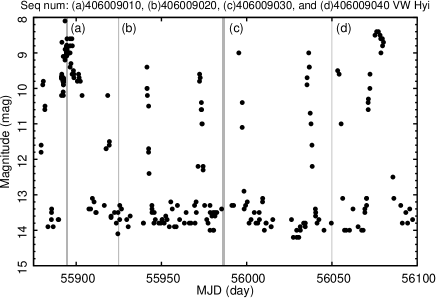
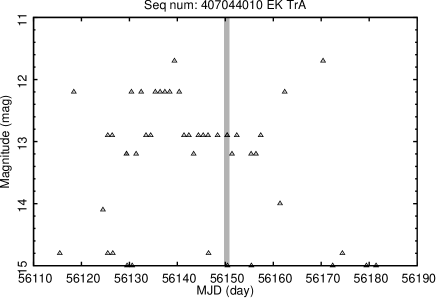
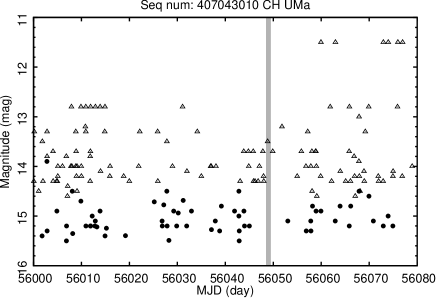
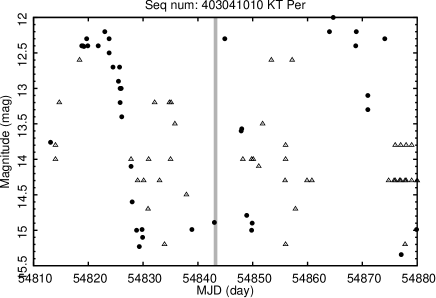
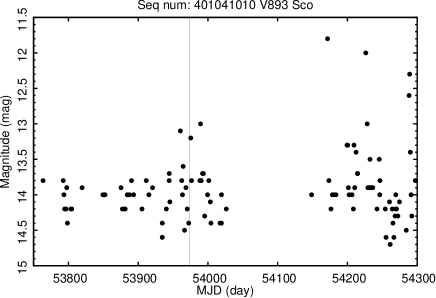
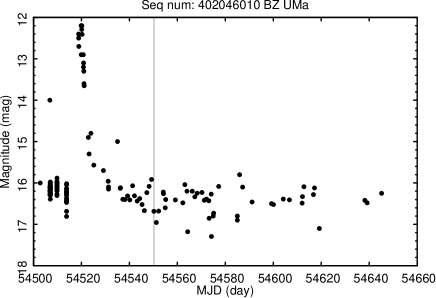
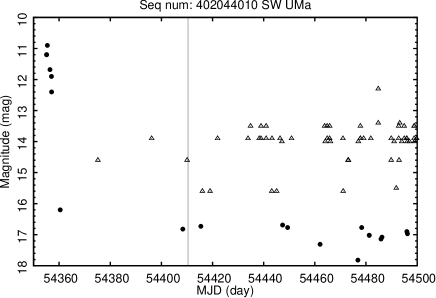
We constructed our sample list based on Ritter & Kolb (2003). Among those classified as DNe, 23 sources were found to be within 9\arcmin of the XIS field center. We removed sources (i) located in a globular cluster or unresolved from other sources, and (ii) with no significant detection of the XIS by quick-look analysis (CP Dra). For each observation, we constructed an optical light curves using the American Association of Variable Star Observers (AAVSO) 111See https://www.aavso.org/ for details. International Database (figure 1). As a result, we obtained a list of 15 DNe for various types (SU UMa, U Gem, Z Cam types) with 21 observations for various states (quiescent, outburst, super-outburst, and transitional states; table 1). Here, we define the “transitional state” as the period between the onset and the peak, and the “outburst state” from the peak to the quiescence level in an outburst by the optical light curve. Four DNe have multiple observations in different states, which is a uniqueness of our data set.


| Target | Type∗*∗*footnotemark: | State††\dagger††\daggerfootnotemark: | Obs date | Seq num | ‡‡\ddagger‡‡\ddaggerfootnotemark: | §§\S§§\Sfootnotemark: | Inclination | Distance | References |
| (ks) | (hr) | (pc) | |||||||
| VY Aqr | SU | Q | 2007-11-10 | 402043010 | 25.4 | 1.514 | 63\degree13\degree | 97 | 1, 2 |
| SS Aur | UG | Q | 2008-05-04 | 402045010 | 19.5 | 4.387 | 40\degree7\degree | 20026 | 3, 4, 5 |
| Z Cam | ZC | T | 2009-04-10 | 404022010 | 37.7 | 6.956 | 68\degree | 163 | 2, 6, 7 |
| O | 2012-11-08 | 407016010 | 35.9 | ||||||
| BV Cen | UG | Q | 2013-02-06 | 407047010 | 33.4 | 14.643 | 53\degree4\degree | 400 | 8, 9, 10 |
| SS Cyg | UG | Q | 2005-11-02 | 400006010 | 39.5 | 6.603 | 45\degree–56\degree | 1142 | 11, 12, 13 |
| O | 2005-11-18 | 400007010 | 56.1 | ||||||
| BF Eri | UG | Q | 2013-02-27 | 407045010 | 32.8 | 6.501 | 38\degree–40.5\degree | 700200 | 14 |
| U Gem | UG | O | 2012-04-12 | 407035010 | 50.3 | 4.246 | 69.7\degree0.7\degree | 96.44.6 | 5, 15, 16 |
| Q | 2012-04-24 | 407034010 | 119.1 | ||||||
| VW Hyi | SU | S | 2011-11-29 | 406009010 | 70.1 | 1.783 | 60\degree10\degree | 825 | 17, 18, 19 |
| Q | 2011-12-29 | 406009020 | 16.2 | ||||||
| Q | 2012-02-29 | 406009030 | 20.1 | ||||||
| Q | 2012-05-02 | 406009040 | 16.8 | ||||||
| KT Per | ZC | Q or T | 2009-01-12 | 403041010 | 29.2 | 3.904 | 60\degree | 180 | 10, 20, 21 |
| FL Psc | SU | Q | 2009-01-10 | 403039010 | 33.3 | 1.357 | – | 13030 | 22, 23 |
| V893 Sco | SU | Q | 2006-08-26 | 401041010 | 18.5 | 1.823 | 72.5\degree | 155 | 2, 24, 25 |
| EK TrA | SU | Q | 2012-08-10 | 407044010 | 77.9 | 1.509 | 58\degree7\degree | 180 | 26, 27 |
| BZ UMa | SU | Q | 2008-03-24 | 402046010 | 29.8 | 1.632 | 57\degree | 228 | 10, 29, 30 |
| CH UMa | UG | Q | 2012-05-01 | 407043010 | 45.2 | 8.236 | 21\degree4\degree | 480 | 10, 29, 30 |
| SW UMa | SU | Q | 2007-11-06 | 402044010 | 16.9 | 1.364 | 45\degree18\degree | 15922 | 4, 21, 31 |
| CP Dra | SU | Q | 2010-05-24 | 705054010 | 104.8 | 1.939 | — | — | 32 |
|
∗*∗*footnotemark:
The DNe sub-classification by Ritter & Kolb (2011):
UGU Gem, ZCZ Cam, and SUSU UMa type.
††\dagger††\daggerfootnotemark: States based on the optical light curve: Qquiescent, Ttransitional, Ooutburst, and Ssuper-outburst. ‡‡\ddagger‡‡\ddaggerfootnotemark: Exposure time. §§\S§§\Sfootnotemark: Orbital period. References–(1) Thorstensen & Taylor (1997); (2) Thorstensen (2003); (3) Shafter & Harkness (1986); (4) Shafter (1983); (5) Harrison et al. (1999); (6) Hartley et al. (2005); (7) Thorstensen & Ringwald (1995); (8) Hollander et al. (1993); (9) Watson et al. (2007); (10) Patterson (2011); (11) Hessman et al. (1984); (12) Bitner et al. (2007); (13) Miller-Jones et al. (2013); (14) Neustroev & Zharikov (2008) (15) Marsh et al. (1990); (16) Zhang & Robinson (1987); (17) van Amerongen et al. (1987); (18) Schoembs & Vogt (1981); (19) Barrett (1996); (20) Echevarría et al. (1999); (21) Thorstensen et al. (2008); (22) Kato et al. (2009); (23) Reis et al. (2013); (24) Mukai et al. (2009); (25) Mason et al. (2001); (26) Mennickent & Arenas (1998); (27) Godon et al. (2008); (28) Jurcevic et al. (1994); (29) Thorstensen et al. (2004); (30) Friend et al. (1990); (31) Howell & Szkody (1988); (32) Shears et al. (2011). |
|||||||||
2.3 Data reduction
For all observations, the XIS was operated with the normal clocking mode with a read-out time of 8 s. We discarded events during the South Atlantic Anomaly (SAA) passages and the elevation angles from the day Earth by 20\degree and the night Earth by 5\degree. We extracted source events within a 3\arcmin radius circle, and the background events from a 4–6\arcmin annulus for all the targets. For FL Psc, we further removed events within a 2\arcmin radius circle of a near-by point-like source.
Throughout this paper, we used HEADAS software package222See http://heasarc.gsfc.nasa.gov/docs/software/heasoft/ for details. version 6.15 for data reduction. The response files of XIS and XRT were generated using the xisrmfgen and the xissimarfgen (Ishisaki et al., 2007) tools, respectively.
3 Analysis
The average XIS1 spectra in the 0.25–8.0 keV band are shown for 21 observations in figure 2. Almost all the spectra exhibit a complex of Fe lines in the 6–7 keV band, which is composed of the fluorescent line from neutral or low ionized Fe, He line from Fe\emissiontypeXXV, and Ly line from Fe\emissiontypeXXVI. We use the 0.25–8.0 (BI) and 0.4–10.0 keV (FI) band spectra for the fitting. We inspected all the light curves and found no clear phase change, thus we only deal with time-averaged spectra unless otherwise noted.


3.1 Spectral hardness
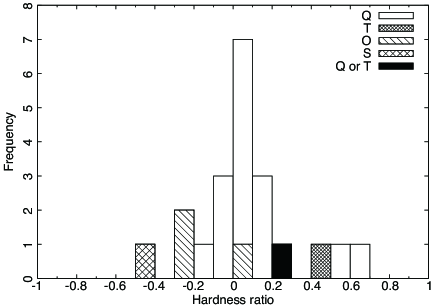
In order to have an overview of the spectral properties, we first investigated the hardness ratio (HR) defined as . Figure 3 shows the histogram of HR with different symbols for different states. The HR distribution shows that different states have different distributions despite the inhomogeneity of the date set: the transitional state exhibits hard spectra, and the outburst and the super-outburst states exhibit softer spectra than those in the quiescent state. This indicates that the state is a primary factor to characterize X-ray spectra of DNe.
3.2 Fiducial model
For spectral fitting, we begin with the isobaric cooling flow model (mkcflow: Mushotzky & Szymkowiak (1988)). In this model, the accreting gas cools as a steady flow with gradually changing temperatures under an equal pressure, and each temperature layer emits an optically-thin thermal plasma radiation. Despite its simplicity, the model is known to describe the X-ray spectra of DNe very well at least in the quiescent state (e.g., Mukai et al. (2003); Pandel et al. (2005)). The free parameters are the maximum and minimum temperatures of the plasma ( and ), the metal abundances (), and the normalization. The normalization represents the mass accretion rate (). We used the abundance table by Wilms et al. (2000) and varied the relative abundance collectively for all metals. We fixed to 80.8 eV unless otherwise noted. This is the lower limit value of the model in the XSPEC fitting package, which we assume to be the temperature of the WD surface.
We fitted the background-subtracted spectra using the cooling flow model attenuated by a photoelectric absorption (tbabs: Wilms et al. (2000)) to account for the extinction by the interstellar medium (ISM). Some sources show excess emission at 6.4 keV, which is presumably from the reprocessed Fe fluorescence emission. We added a Gaussian model for this line. We refer this model as the “fiducial model” in the rest of the paper.
The fitting result is shown in table ‣ 2. We fixed the values for Z Cam, SS Cyg, U Gem and VW Hyi based on ultraviolet spectral studies of individual sources (Baskill et al. (2005), Mauche et al. (1988), Long et al. (1996), and Polidan et al. (1990)). For the others, the value was a free parameter. The metal abundance was tied for all the spectra of the same source in the same state. We did not tie the metal abundance for spectra of the same source in different states. This is because, in general, the plasma temperature differs for different states, and the elements with the most prominent line emission change. Thus, it is not unexpected to have different best-fit values of metal abundance when they are thawed collectively.
It is remarkable that the result is quite distinctive between the quiescent state and the other states. If we adopt the reduced value of 1.33 to be the success or failure criterion of the fitting, all but two (BV Cen and V893 Sco) sources were fitted successfully with the fiducial model for the quiescent state. The fiducial model is not successful to explain the spectra in the other states.
| Target | State | Seq num | EW | (dof) | |||||
|---|---|---|---|---|---|---|---|---|---|
| (1020 cm-2) | (keV) | () | (10-11 yr-1) | (eV) | (1030 erg s-1) | ||||
| VY Aqr | Q | 402043010 | 3.3 | 18.4 | 1.0 | 0.070 | 225 | 2.18 | 1.07 (189) |
| SS Aur | Q | 402045010 | 1.3 | 26.5 | 2.3 | 0.53 | 96 | 22.2 | 1.12 (316) |
| Z Cam | T | 404022010 | 0.4††\dagger††\daggerfootnotemark: | 80 | 3.9 | 1.05 | 109 | 100.2 | 3.42 (2757) |
| O | 407016010 | 0.4††\dagger††\daggerfootnotemark: | 3.8 | 0.5 | 0.39 | 996 | 2.47 | 1.96 (183) | |
| BV Cen | Q | 407047010 | 51 | 77.0 | 2.6 | 3.74 | 60 | 352.2 | 1.48 (1334) |
| SS Cyg | Q | 400006010 | 0.35††\dagger††\daggerfootnotemark: | 52.5 | 1.22 | 1.50 | 65 | 103.5 | 1.13 (4200) |
| O | 400007010 | 0.35††\dagger††\daggerfootnotemark: | 7.26 | 0.63 | 2.84 | 137 | 36.6 | 2.58 (1592) | |
| BF Eri | Q | 407045010 | 1.3 | 10.2 | 0.04 | 6.84 | 144 | 118.7 | 1.02 (302) |
| U Gem | Q | 407034010 | 0.31††\dagger††\daggerfootnotemark: | 26.2 | 2.0 | 0.224 | 53 | 9.21 | 1.07 (990) |
| O | 407035010 | 0.31††\dagger††\daggerfootnotemark: | 16.5 | 1.7 | 0.69 | 139 | 19.7 | 1.60 (1161) | |
| VW Hyi | S | 406009010 | 0.006††\dagger††\daggerfootnotemark: | 2.18 | 0.53 | 1.54 | 694 | 4.77 | 1.78 (735) |
| Q | 406009020 | 0.006††\dagger††\daggerfootnotemark: | 9.3 | 1.80 | 0.53 | 23 | 9.08 | 1.32 (664) | |
| Q | 406009030 | 0.006††\dagger††\daggerfootnotemark: | 10.0 | 1.80 (tied) | 0.42 | 22 | 7.54 | 1.15 (680) | |
| Q | 406009040 | 0.006††\dagger††\daggerfootnotemark: | 9.8 | 1.80 (tied) | 0.45 | 9 | 7.96 | 1.15 (609) | |
| KT Per | Q or T | 403041010 | 27 | 14.5 | 0.6 | 0.72 | 62 | 17.9 | 1.06 (417) |
| FL Psc | Q | 403039010 | 1.0 | 15.0 | 1.2 | 0.048 | 228 | 1.25 | 1.00 (127) |
| V893 Sco | Q | 401041010 | 85 | 35.7 | 2.0 | 1.49 | 47 | 77.7 | 1.34 (1077) |
| EK TrA | Q | 407044010 | 2.5 | 12.4 | 1.2 | 1.17 | 24 | 25.7 | 1.12 (1593) |
| BZ UMa | Q | 402046010 | 0.21 | 13.7 | 1.0 | 1.07 | 59 | 25.7 | 1.02 (471) |
| CH UMa | Q | 407043010 | 4.9 | 15.0 | 1.4 | 5.4 | 68 | 140.2 | 1.18 (761) |
| SW UMa | Q | 402044010 | 0.4 | 7.5 | 0.6 | 0.69 | 197 | 9.4 | 1.15 (226) |
|
∗*∗*footnotemark:
Parameters are for the hydrogen column density
(), the maximum plasma temperature (), the metal
abundance with respect to the solar value (), the mass accretion rate
(), the equivalent width of 6.4 keV line (EW) and the luminosity
in the 0.5–10.0 keV band (). The reduced
() and the degree of freedom (dof) are also shown for
the goodness of the fitting. The errors indicate a 1 statistical
uncertainty.
††\dagger††\daggerfootnotemark: Hydrogen column density was fixed based on ultraviolet observations: Z Cam; Baskill et al. (2005), SS Cyg; Mauche et al. (1988), U Gem; Long et al. (1996), VW Hyi; Polidan et al. (1990). |
|||||||||
3.3 Modified model by an extra extinction
We inspected the spectra that were not fitted with the fiducial model, and found that the fitting can be improved by several different modifications for different groups of sources.
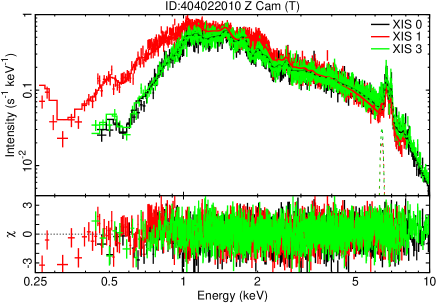
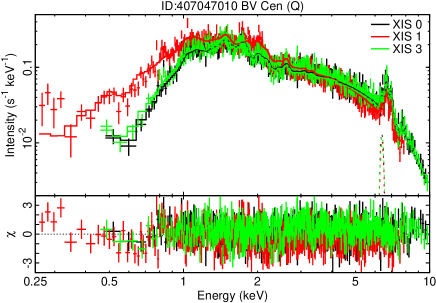
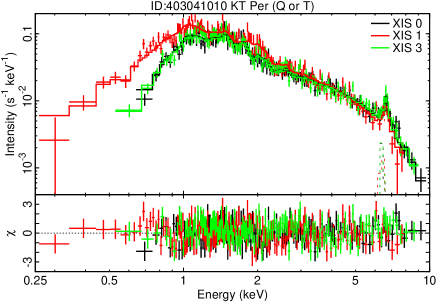
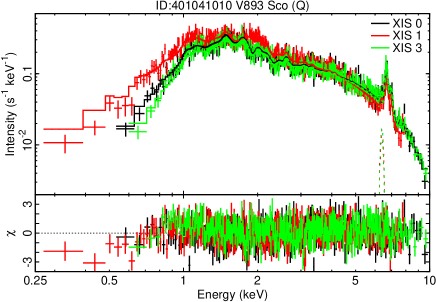
The first modification is to add an extinction, presumably by the intrinsic absorber, in addition to the ISM extinction. Three spectra (V893 Sco and BV Cen in the quiescent state and Z Cam in the transitional state) showed an improved fitting result by this modification. An intrinsic extinction should be also considered for sources with a spectrum fitted by the fiducial model if the best-fit value is too large for the ISM extinction. We found that KT Per is such a source.
For the four sources, we fixed the ISM extinction column to the value derived from the B–V color (table ‣ 3) in the fiducial model. Then, we multiplied an additional extinction model to represent the intrinsic absorber extinction. Two models were employed: full neutral extinction (tbabs) and a partial neutral extinction (pcfabs). The latter yielded a statistically better and acceptable fit for all the spectra. The best-fit model and parameters with the partial extinction model are shown in figure 4 and table ‣ 3.
| Target | State | Seq num | ††\dagger††\daggerfootnotemark: | ‡‡\ddagger‡‡\ddaggerfootnotemark: | ‡‡\ddagger‡‡\ddaggerfootnotemark: | EW | (dof) | ||||
| (1020 cm-2) | (1022 cm-2) | (keV) | () | (10-11 yr-1) | (eV) | (1030 erg s-1) | |||||
| Z Cam | T | 404022010 | 0.4 | 1.07 | 0.67 | 27.6 | 2.2 | 3.04 | 65 | 130.3 | 1.16 (2755) |
| BV Cen | Q | 407047010 | 5.8 | 1.42 | 0.78 | 27.5 | 1.9 | 9.21 | 65 | 394.4 | 1.20 (1333) |
| KT Per | Q or T | 403041010 | 3.9 | 0.72 | 0.69 | 10.5 | 0.7 | 1.04 | 73 | 19.2 | 0.99 (416) |
| V893 Sco | Q | 401041010 | 2.3 | 1.58 | 0.88 | 19.2 | 1.7 | 2.69 | 52 | 86.6 | 1.02 (1076) |
|
∗*∗*footnotemark:
The errors indicate a 1 statistical
uncertainty.
††\dagger††\daggerfootnotemark: The hydrogen column density in ISM () are fixed to the value derived from measurements for Z Cam (Baskill et al., 2005), BV Cen (Godon et al., 2012) and KT Per and V893 Sco (Özdönmez et al., 2015). ‡‡\ddagger‡‡\ddaggerfootnotemark: The hydrogen column density () and the covering fraction () of the the additional neutral partial covering absorption . |
|||||||||||
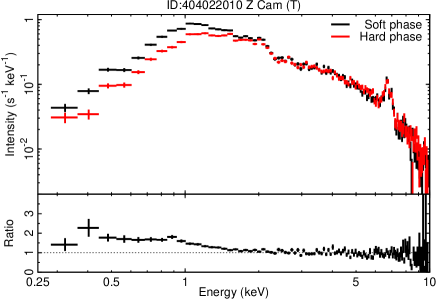
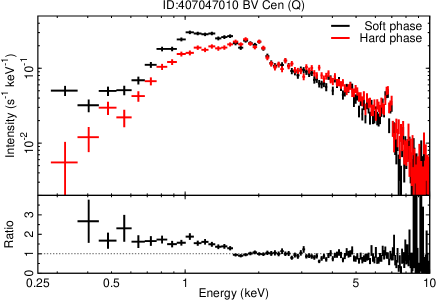
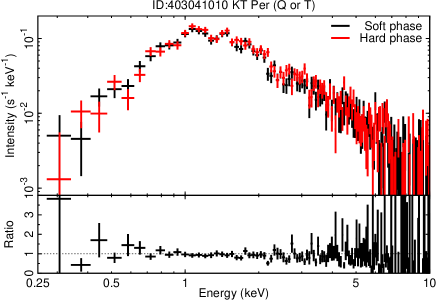
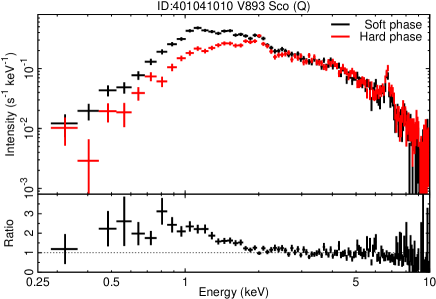
Next, we divided the events into two phases depending on the hardness ratio being greater or smaller than the median value in order to study origin of the spectral variations. We generated spectrum of each phase (figure 5). In all the spectra, there are no spectral changes in the hard band. However, in the soft band, the intensity is smaller during the hard phase. We fitted the total-band spectra in the soft and hard phases separately with the modified model, and found that the spectral variation is primarily explained by change of the partial covering fraction of the intrinsic extinction component (table ‣ 4).
| Target | State | Seq num | Phase | ††\dagger††\daggerfootnotemark: | ††\dagger††\daggerfootnotemark: | EW | (dof) | ||
| (1022 cm-2) | (keV) | (10-11 yr-1) | (eV) | ||||||
| Z Cam | T | 404022010 | Hard | 0.80 | 0.58 | 28.5 | 2.84 | 62 | 1.11 (1657) |
| Soft | 1.20 | 0.79 | 28.1 | 3.12 | 70 | 1.14 (1514) | |||
| BV Cen | Q | 407047010 | Hard | 1.10 | 0.70 | 27.2 | 8.5 | 67 | 1.21 (715) |
| Soft | 1.70 | 0.86 | 27.2 | 10.1 | 58 | 1.18 (704) | |||
| KT Per | Q or T | 403041010 | Hard | 0.42 | 0.65 | 9.5 | 0.98 | 114 | 1.14 (194) |
| Soft | 0.89 | 0.81 | 11.3 | 1.15 | 61 | 1.16 (210) | |||
| V893 Sco | Q | 401041010 | Hard | 1.19 | 0.85 | 20.9 | 2.43 | 40 | 0.98 (592) |
| Soft | 1.99 | 0.92 | 18.4 | 2.88 | 62 | 1.04 (519) | |||
|
∗*∗*footnotemark:
The errors indicate a 1 statistical uncertainty.
The hydrogen column density in ISM () and the metal
abundance () are fixed to the best-fit value listed in table ‣ 3.
‡‡\ddagger‡‡\ddaggerfootnotemark: The hydrogen column density () and the covering fraction () of the the additional neutral partial covering absorption . |
|||||||||
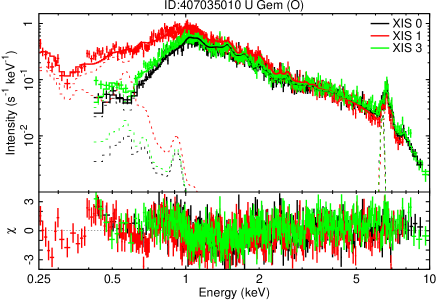
3.4 Modified model with extra soft-band emission
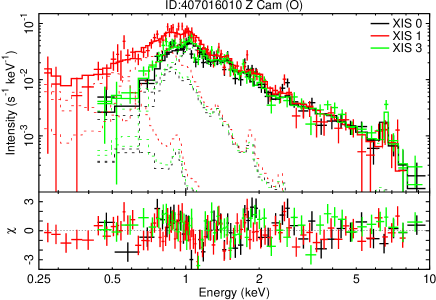
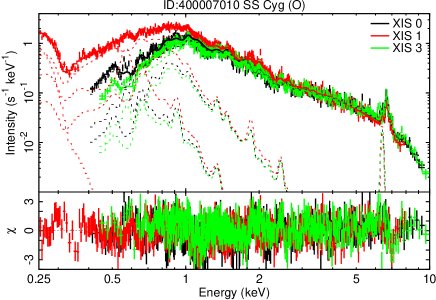
For other spectra during the outburst or the super-outburst states, the fitting with the fiducial model was not successful especially below 2 keV. This cannot be explained by adding an extra extinction (§ 3.3). However, when we restricted the energy range to 2–10 keV for the fiducial model fitting, the result was successful; the (and d.o.f) of Z Cam, SS Cyg, U Gem, and VW Hyi are 1.13 (55), 1.21 (582), 1.24 (508), and 1.25 (142), respectively. By extrapolating the best-fit fiducial model to the range below 2 keV, we clearly see the excess with line emission in the soft band, which suggests the presence of an additional thin-thermal plasma component.
In the cooling flow component of our fiducial model, the power-law slope of the differential emission measure distribution is fixed. Pandel et al. (2005) took a different approach by treating the power-law slope as a free parameter. This allows a more flexible distribution to be fitted. We followed this approach, but the soft excess emission was still found, suggesting that the additional component is something different from the BL plasma represented by a continuous differential emission measure distribution.
It is also suggested that the black body emission from the BL emerges during outbursts (Mauche et al., 1995; Long et al., 1996). The temperature is too low to constrain only from the XIS data, so we refer to the values derived in EUVE studies: 20 eV for SS Cyg (Mauche et al., 1995), 11.9 eV for U Gem (Long et al., 1996), and 10 eV for VW Hyi (Mauche, 1996). Z Cam has no reference, but has no excess emission in the softest band of the XIS spectrum like U Gem, so we used 11.9 eV as an upper limit. We did spectral fitting with the black body luminosity as an additional free parameter, and tested the fitting improvement by the statistics. The addition of the black body component was only justified for SS Cyg in outburst. We thus added a black body component only for this spectrum hereafter.
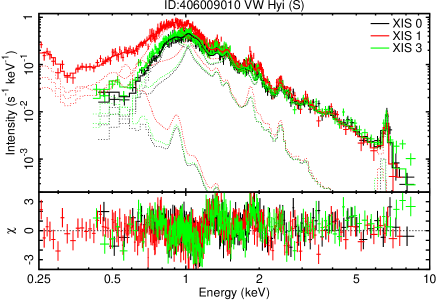
In the end, we evaluated this soft excess emission. After fixing the best-fit parameters of the fiducial model in the 2–10 keV band, we added a single temperature thermal plasma model (MEKAL; Mewe et al. (1985, 1986); Liedahl et al. (1995); Kaastra et al. (1996)). As a consequence, the fitting improved by adding one thermal plasma component in U Gem, or two components are required in SS Cyg and Z Cam (table ‣ 5 and figure 6). The super-outburst of VW Hyi is, however, not explained even by adding extra-soft components (table ‣ 5 and figure 6).
| Target | State | Seq num | ††\dagger††\daggerfootnotemark: | ‡‡\ddagger‡‡\ddaggerfootnotemark: | §§\S§§\Sfootnotemark: | EW | (dof) | ||||||
| (1020 cm-2) | (keV) | (keV) | () | (10-11 yr-1) | (keV) | (keV) | (eV) | (eV) | (1030 erg s-1) | ||||
| Z Cam | O | 407016010 | 0.4 | 0.0808¶¶\P¶¶\Pfootnotemark: | 8.0 | 2.2 | 0.17 | 0.14 | 0.60 | — | 36 | 2.68 | 1.57 (183) |
| SS Cyg | O | 400007010 | 0.35 | 0.0808¶¶\P¶¶\Pfootnotemark: | 11.6 | 1.22 | 1.72 | 0.17 | 0.61 | 20.0 | 73 | 39.6 | 1.39 (1591) |
| U Gem | O | 407035010 | 0.31 | 0.0808¶¶\P¶¶\Pfootnotemark: | 15.6 | 2.0 | 0.74 | 0.12 | — | — | 125 | 19.9 | 1.51 (1163) |
| VW Hyi | S | 406009010 | 0.006 | 0.0808¶¶\P¶¶\Pfootnotemark: | 3.28 | 1.80 | 0.72 | 0.12 | 0.62 | — | 76 | 4.97 | 1.68 (735) |
| 0.006 | 1.20 | 3.28 | 1.80 | 0.72 | 0.13 | 0.66 | — | 76 | 5.02 | 1.58 (734) | |||
|
∗*∗*footnotemark:
The errors indicate a 1 statistical
uncertainty. and show the temperature of the additional
thermal plasma component.
††\dagger††\daggerfootnotemark: The values of were fixed. (Z Cam; Baskill et al. (2005), SS Cyg; Mauche et al. (1988), U Gem; Long et al. (1996), VW Hyi; Polidan et al. (1990)) ‡‡\ddagger‡‡\ddaggerfootnotemark: Abundance is fixed to the best-fit values in the quiescent or the transitional state. §§\S§§\Sfootnotemark: The temperature of black body component for SS Cyg. The component was not necessary for other spectra. ¶¶\P¶¶\Pfootnotemark: is fixed to 80.8 eV. |
|||||||||||||

3.5 Modified model further with
One spectrum remained without being fitted successfully by any modifications discussed in § 3.3 and § 3.4, is the VW Hyi spectrum in the super-outburst state. Since there are large residuals in the 0.9–1.2 keV band (figure 6), which are presumably due to the Fe L emission line complex, we changed the value of in the cooling flow model to 1 keV, which is the only free parameter at this point. Consequently, the fitting improved by changing 1.20 keV with the probability of 3.810-11 against the null hypothesis that the improvement is random (table ‣ 5 and figure 6, 7).
4 Discussion
4.1 Comparison with preceding results
First, we compare our fitting results with those in preceding works using the same data set. Byckling et al. (2010) selected 12 DNe with a parallax measurement among the XMM-Newton, ASCA, and Suzaku archives for constructing a precise luminosity function of DNe. Eight of the samples are the same with ours. Seven are in the quiescent state, while one (KT Per) is in the outburst according to their classification. The states are consistent with ours except for KT Per, which we classify as the quiescent or transition state in our definition. They fitted all the spectra using the cooling flow model similarly to our fiducial model, including KT Per. All the parameters are consistent with ours except for the abundance. The difference of the abundance is presumably due to the use of different abundance table; Wilms et al. (2000) used in this work has about a half of Fe abundance than Anders & Grevesse (1989) used in Byckling et al. (2010); Fe dominates the abundance determination in the fitting for spectra in the quiescent state.
Saitou et al. (2012) and Ishida et al. (2009) studied individual sources (Z Cam in outburst and SS Cyg in both quiescence and outburst, respectively) in detail. Both work used not only the XIS but also the HXD data up to 40 keV, and fitted the spectra by considering the reflection component. Since we do not include the reflection component, our and are higher than their results. This also gives a slight change in the estimate of the intrinsic absorber extinction model. Saitou et al. (2012) derived a larger covering fraction by 10% and a smaller column density by 17% than ours. For other parameters, our results on Z Cam and SS Cyg are consistent with those by Saitou et al. (2012) and Ishida et al. (2009).
Mukai et al. (2009) studied V893 Sco and fitted the XIS spectrum based on the cooling flow model. They showed that a partial covering extinction in addition to the ISM extinction is needed to explain the XIS spectrum , which we confirmed.
4.2 X-ray spectral characteristics of each state
We started the spectral fitting with the fiducial model, and applied several modifications finally to explain all the spectra. We took a data-oriented approach, but the result shows that the best-fit model depends strongly on the state of DNe. Despite the diversity of the samples belonging to different types, the result is quite clear.
-
•
All but two (BV Cen and V893 Sco) spectra in the quiescent state were explained just by the fiducial model. The two exceptions require a partial covering absorption.
-
•
The only spectrum definitively in the transitional state (Z Cam) and another possibly in the transitional state (KT Per) were explained by an additional partial covering extinction upon the fiducial model.
-
•
All outburst spectra were explained by the fiducial model added by one or two thin-thermal plasma components in the soft band.
-
•
The only super-outburst spectrum required a further increase of .
In all the spectra, the fiducial model explained the spectra in the hard band, which indicates that the hard X-ray emission arises from the BL in all the states.
Possible explanations for the partial covering material include (i) a part of the accretion disk interrupts the X-ray emission from the BL, or (ii) a part of the X-ray emission is absorbed by an intervening matter such as clumpy disk wind. If the partial covering absorber is a part of the disk, the variation is expected to be related to the orbital period. We constructed light curves in the three energy bands (0.2–10.0, 0.2–1.5, and 1.5–10.0 keV band) and the hardness ratios in figure 8 for these sources. We do not see a clear variation synchronized with the orbital period, which suggests that the explanation (ii) is more likely. This is consistent with Saitou et al. (2012) using the same data set for Z Cam in the transitional state.
It is interesting to note that the Z Cam spectrum in the outburst state, which is newly presented in this work, does not require an additional partial extinction. This is in contrast with the ASCA result (Baskill et al., 2005), in which a partial covering was required during the outburst state. The disk wind in Z Cam may be prominent only during a part of the transitional and outburst states.
It is also noteworthy that an additional partial extinction was required also in two sources in the quiescent state. For one of them (V893 Sco), Mukai et al. (2009) argued that the origin of the intrinsic absorber is in the inner part of the disk, which is likely for a high-inclination systems. The other source, BV Cen, may be explained by the same interpretation, though its inclination is not very high (table 1).
Mukai et al. (2009) also found a dip in the X-ray light curve of V893 Sco, which does not accompany the change of the spectral shape. They attribute the dip to the partial covering by the companion star. In our data, KT Per have a similar behavior; it exhibits little change in the hardness ratio light curve unlike the other these sources, yet shows a clear decline in the last quarter of the X-ray light curve (figure 8). The decline does not repeat by the orbital phase, so the partial covering should be by something else. There may be several different origins, and a multiple of them are combined, for the additional extinction in DNe.


During the outbursts and super-outburst states, additional low-temperature thermal plasma emission was required to explain the soft excess below 2 keV (§ 3.4 and 3.5), which we consider to originate from a region different from the BL, such as a corona around the WD and/or the disk.
During the super-outburst of VW Hyi, a significant change of was observed, which may indicate that the plasma structure changed in the BL during this state. This can be explained if the inner edge of the accretion disk becomes so dense that the WD surface is beyond the depth seen from the observer. As a consequence, , which is the BL temperature at , becomes higher than the WD surface temperature.
5 Conclusions
We carried out a systematic analysis of 21 data sets of the 15 DNe observed by Suzaku. We classified DNe based on the optical light curves into the four states; quiescent, transitional, outburst, and super-outburst states. We revealed a general picture for each state in the X-rays.
For spectral analysis, we defined the isobaric cooling flow model with a Gaussian model at 6.4 keV attenuated by a photoelectric absorption as the “fiducial model”. All the X-ray spectra except two in the quiescent state were represented by the fiducial model. This result suggests, as Baskill et al. (2005) and Pandel et al. (2005) pointed out, the X-ray emission is radiated from the optically-thin multi-temperature plasma located in the boundary layer in this state. For one DN in the transition state and another possibly in the transition state, we fitted their spectra successfully with the fiducial model modified with a partial covering absorption by neutral matter, which we consider to be an intervening matter such as clumpy disk wind. However, the additional covering can be attributed by other mechanisms such as a partial eclipse by the inner part of the disk, the companion star, or something else. The outburst and super-outburst spectra can be fitted with the fiducial model only in the 2.0–10.0 keV band. We found a significant soft excess below 2.0 keV, which was reproduced by one or two thermal plasma components. We speculate that a possible origin for the soft excess emission is a corona somewhere in the system. Furthermore, in the super-outburst state, it was necessary to raise the minimum temperature of the white-dwarf surface in the fiducial model, suggesting that the plasma structure changes in this state.
We appreciate the critique by the anonymous referee for improving the manuscript. The authors are financially supported by the MEXT/JSPS KAKENHI Grant Numbers JP14J11810 (Q. W.), JP24105007, JP15H03642, and JP16K05309 (M. T.), JP16K05309 (K. E.), and JP15J10520 and JP26800113 (T. H.). We acknowledge the variable star observations from the AAVSO International Database contributed by observers worldwide. This research made use of data obtained from Data ARchives and Transmission System (DARTS), provided by Center for Science-satellite Operation and Data Archives (C-SODA) at ISAS/JAXA, and the software tools provided by HEASARC at NASA/GSFC.
New ANewA
References
- Anders & Grevesse (1989) Anders, E. & Grevesse, N. 1989, Geochim. Cosmochim. Acta, 53, 197
- Barrett (1996) Barrett, P. 1996, PASP, 108, 412
- Baskill et al. (2005) Baskill, D. S., Wheatley, P. J., & Osborne, J. P. 2005, MNRAS, 357, 626
- Bitner et al. (2007) Bitner, M. A., Robinson, E. L., & Behr, B. B. 2007, ApJ, 662, 564
- Byckling et al. (2010) Byckling, K., Mukai, K., Thorstensen, J. R., & Osborne, J. P. 2010, MNRAS, 408, 2298
- Echevarría et al. (1999) Echevarría, J., Pineda, L., & Costero, R. 1999, RMxAA, 35, 135
- Friend et al. (1990) Friend, M. T., Martin, J. S., Connon-Smith, R., & Jones, D. H. P. 1990, MNRAS, 246, 654
- Godon et al. (2008) Godon, P., Sion, E. M., Barrett, P. E., et al. 2008, ApJ, 679, 1447
- Godon et al. (2012) Godon, P., Sion, E. M., Levay, K., et al. 2012, ApJS, 203, 29
- Hōshi (1979) Hōshi, R. 1979, Progress of Theoretical Physics, 61, 1307
- Harrison et al. (1999) Harrison, T. E., McNamara, B. J., Szkody, P., et al. 1999, ApJ, 515, L93
- Hartley et al. (2005) Hartley, L. E., Long, K. S., Froning, C. S., & Drew, J. E. 2005, ApJ, 623, 425
- Hessman et al. (1984) Hessman, F. V., Robinson, E. L., Nather, R. E., & Zhang, E.-H. 1984, ApJ, 286, 747
- Hirose & Osaki (1990) Hirose, M. & Osaki, Y. 1990, PASJ, 42, 135
- Hollander et al. (1993) Hollander, A., Kraakman, H., & van Paradijs, J. 1993, A&AS, 101, 87
- Howell & Szkody (1988) Howell, S. & Szkody, P. 1988, PASP, 100, 224
- Ishida et al. (2009) Ishida, M., Okada, S., Hayashi, T., et al. 2009, PASJ, 61, 77
- Ishisaki et al. (2007) Ishisaki, Y., Maeda, Y., Fujimoto, R., et al. 2007, PASJ, 59, 113
- Jurcevic et al. (1994) Jurcevic, J. S., Honeycutt, R. K., Schlegel, E. M., & Webbink, R. F. 1994, PASP, 106, 481
- Kaastra et al. (1996) Kaastra, J. S., Mewe, R., & Nieuwenhuijzen, H. 1996, in UV and X-ray Spectroscopy of Astrophysical and Laboratory Plasmas, ed. K. Yamashita & T. Watanabe, 411–414
- Kato et al. (2009) Kato, T., Imada, A., Uemura, M., et al. 2009, PASJ, 61, 395
- Kokubun et al. (2007) Kokubun, M., Makishima, K., Takahashi, T., et al. 2007, PASJ, 59, 53
- Koyama et al. (2007) Koyama, K., Tsunemi, H., Dotani, T., et al. 2007, PASJ, 59, 23
- Liedahl et al. (1995) Liedahl, D. A., Osterheld, A. L., & Goldstein, W. H. 1995, ApJ, 438, L115
- Long et al. (1996) Long, K. S., Mauche, C. W., Raymond, J. C., Szkody, P., & Mattei, J. A. 1996, ApJ, 469, 841
- Marsh et al. (1990) Marsh, T. R., Horne, K., Schlegel, E. M., Honeycutt, R. K., & Kaitchuck, R. H. 1990, ApJ, 364, 637
- Mason et al. (2001) Mason, E., Skidmore, W., Howell, S. B., & Mennickent, R. E. 2001, ApJ, 563, 351
- Mauche (1996) Mauche, C. W. 1996, in Astrophysics and Space Science Library, Vol. 208, IAU Colloq. 158: Cataclysmic Variables and Related Objects, ed. A. Evans & J. H. Wood, 243
- Mauche et al. (1988) Mauche, C. W., Raymond, J. C., & Cordova, F. A. 1988, ApJ, 335, 829
- Mauche et al. (1995) Mauche, C. W., Raymond, J. C., & Mattei, J. A. 1995, ApJ, 446, 842
- Mennickent & Arenas (1998) Mennickent, R. E. & Arenas, J. 1998, PASJ, 50, 333
- Mewe et al. (1985) Mewe, R., Gronenschild, E. H. B. M., & van den Oord, G. H. J. 1985, A&AS, 62, 197
- Mewe et al. (1986) Mewe, R., Lemen, J. R., & van den Oord, G. H. J. 1986, A&AS, 65, 511
- Meyer & Meyer-Hofmeister (1981) Meyer, F. & Meyer-Hofmeister, E. 1981, A&A, 104, L10
- Miller-Jones et al. (2013) Miller-Jones, J. C. A., Sivakoff, G. R., Knigge, C., et al. 2013, Science, 340, 950
- Mitsuda et al. (2007) Mitsuda, K., Bautz, M., Inoue, H., et al. 2007, PASJ, 59, 1
- Mukai et al. (2003) Mukai, K., Kinkhabwala, A., Peterson, J. R., Kahn, S. M., & Paerels, F. 2003, ApJ, 586, L77
- Mukai et al. (2009) Mukai, K., Zietsman, E., & Still, M. 2009, ApJ, 707, 652
- Mushotzky & Szymkowiak (1988) Mushotzky, R. F. & Szymkowiak, A. E. 1988, in NATO ASIC Proc. 229: Cooling Flows in Clusters and Galaxies, ed. A. C. Fabian, 53–62
- Neustroev & Zharikov (2008) Neustroev, V. & Zharikov, S. 2008, MNRAS, 386, 1366
- Osaki (1974) Osaki, Y. 1974, PASJ, 26, 429
- Osaki (1989) Osaki, Y. 1989, PASJ, 41, 1005
- Özdönmez et al. (2015) Özdönmez, A., Ak, T., & Bilir, S. 2015, NewA, 34, 234
- Pandel et al. (2005) Pandel, D., Córdova, F. A., Mason, K. O., & Priedhorsky, W. C. 2005, ApJ, 626, 396
- Patterson (2011) Patterson, J. 2011, MNRAS, 411, 2695
- Polidan et al. (1990) Polidan, R. S., Mauche, C. W., & Wade, R. A. 1990, ApJ, 356, 211
- Reis et al. (2013) Reis, R. C., Wheatley, P. J., Gänsicke, B. T., & Osborne, J. P. 2013, MNRAS, 430, 1994
- Ritter & Kolb (2003) Ritter, H. & Kolb, U. 2003, A&A, 404, 301
- Ritter & Kolb (2011) Ritter, H. & Kolb, U. 2011, VizieR Online Data Catalog, 1, 2018
- Saitou et al. (2012) Saitou, K., Tsujimoto, M., Ebisawa, K., & Ishida, M. 2012, PASJ, 64, 88
- Schoembs & Vogt (1981) Schoembs, R. & Vogt, N. 1981, A&A, 97, 185
- Serlemitsos et al. (2007) Serlemitsos, P. J., Soong, Y., Chan, K.-W., et al. 2007, PASJ, 59, 9
- Shafter (1983) Shafter, A. W. 1983, PhD thesis, California Univ., Los Angeles.
- Shafter & Harkness (1986) Shafter, A. W. & Harkness, R. P. 1986, AJ, 92, 658
- Shears et al. (2011) Shears, J., Boyd, D., Buczynski, D., et al. 2011, Journal of the British Astronomical Association, 121, 36
- Takahashi et al. (2007) Takahashi, T., Abe, K., Endo, M., et al. 2007, PASJ, 59, 35
- Thorstensen (2003) Thorstensen, J. R. 2003, AJ, 126, 3017
- Thorstensen et al. (2004) Thorstensen, J. R., Fenton, W. H., & Taylor, C. J. 2004, PASP, 116, 300
- Thorstensen et al. (2008) Thorstensen, J. R., Lépine, S., & Shara, M. 2008, AJ, 136, 2107
- Thorstensen & Ringwald (1995) Thorstensen, J. R. & Ringwald, F. A. 1995, Information Bulletin on Variable Stars, 4249, 1
- Thorstensen & Taylor (1997) Thorstensen, J. R. & Taylor, C. J. 1997, PASP, 109, 1359
- van Amerongen et al. (1987) van Amerongen, S., Damen, E., Groot, M., Kraakman, H., & van Paradijs, J. 1987, MNRAS, 225, 93
- van Teeseling et al. (1996) van Teeseling, A., Beuermann, K., & Verbunt, F. 1996, A&A, 315, 467
- Warner (1995) Warner, B. 1995, Cambridge Astrophysics Series, 28
- Watson et al. (2007) Watson, C., Steeghs, D., Shahbaz, T., & Dhillon, V. 2007, MNRAS, 382, 1105
- Whitehurst (1988) Whitehurst, R. 1988, MNRAS, 232, 35
- Wilms et al. (2000) Wilms, J., Allen, A., & McCray, R. 2000, ApJ, 542, 914
- Zhang & Robinson (1987) Zhang, E.-H. & Robinson, E. L. 1987, ApJ, 321, 813