A very dark stellar system lost in Virgo: kinematics and metallicity of SECCO 1 with MUSE††thanks: Based on data obtained with the European Southern Observatory Very Large Telescope, Paranal, Chile, under the Programme 295.B-5013. Based on observations made with the NASA/ESA Hubble Space Telescope, obtained at the Space Telescope Science Institute, which is operated by the Association of Universities for Research in Astronomy, Inc., under NASA contract NAS 5-26555. These observations are associated with program GTO-13735.
Abstract
We present the results of VLT-MUSE integral field spectroscopy of SECCO 1, a faint, star-forming stellar system recently discovered as the stellar counterpart of an Ultra Compact High Velocity Cloud (HVC274.68+74.0), very likely residing within a substructure of the Virgo cluster of galaxies. We have obtained the radial velocity of a total of 38 individual compact sources identified as Hii regions in the main and secondary body of the system, and derived the metallicity for 18 of them. We provide the first direct demonstration that the two stellar bodies of SECCO 1 are physically associated and that their velocities match the Hi velocities. The metallicity is quite uniform over the whole system, with a dispersion lower than the uncertainty on individual metallicity estimates. The mean abundance, , is much higher than the typical values for local dwarf galaxies of similar stellar mass. This strongly suggests that the SECCO 1 stars were born from a pre-enriched gas cloud, possibly stripped from a larger galaxy. Using archival HST images we derive a total stellar mass of for SECCO 1, confirming that it has a very high Hi to stellar mass ratio for a dwarf galaxy, MHi/M. The star formation rate, derived from the Hα flux is a factor of more than higher than in typical dwarf galaxies of similar luminosity.
keywords:
ISM: Hii regions — galaxies: dwarf — galaxies: star formation1 Introduction
SECCO111http://www.bo.astro.it/secco (Bellazzini et al., 2015a, B15a, hereafter) is a survey aimed at searching for stellar counterparts of Ultra Compact High Velocity Clouds (UCHVC) of neutral hydrogen that have been recently proposed by different teams as candidate mini-halos residing in the Local Group or its surroundings ( Mpc; Adams et al., 2013; Saul et al., 2012, ALFALFA and GALFA-Hi surveys, respectively). The only way to confirm the nature of UCHVCs as small gas-rich dwarf galaxies is to identify a concomitant stellar population that can allow to constrain the distance to the system. Several groups have attempted this search, mainly using public archive data. On the other hand SECCO is based on very-deep, homogeneous, wide-field imaging obtained with the Large Binocular Telescope (MtGraham, AZ), allowing a full quantitative characterisation of non-detections (Beccari et al., 2016, B16, hereafter).
In B15a we identified a candidate faint and blue stellar counterpart to an UCHVC from the Adams et al. (2013, A13 hereafter) sample (HVC274.68+74.0). The spectroscopic follow-up of the brightest source of the system, by Bellazzini et al. (2015b, B15b, hereafter), showed that it is an Hii region at the same velocity222All the velocity values reported in this letter are heliocentric radial velocities (). of the cloud, km/s (A13), hence physically associated to it. As detailed in B15b, having considered several different hypotheses, we concluded that the newly discovered stellar system, that we baptised SECCO 1, is (most probably) a star-forming and extremely gas-rich () dwarf galaxy located in the Virgo cluster of galaxies. In particular, SECCO 1 likely resides within the substructure named Low Velocity Cloud (LVC) whose members span the range of radial velocity km/s km/s (Boselli et al., 2014). The coarse metallicity estimate we obtained in B15b was suggestive of a system much more metal-rich than the typical dwarf of similar luminosity. Sand et al. (2015) confirmed our conclusions with independent data but did not provide an independent estimate of the metallicity. On the other hand they identified a second small group of blue stars Northeast of the main body of SECCO 1, suggesting that the two systems are associated. In the following we will refer to the original stellar system found by B15a as the main body (MB) of SECCO 1, and to the new group as its secondary body (SB). In B16 we showed that SB is indeed recognisable in our original SECCO images and that some additional blue sources possibly associated with SECCO 1 can be identified also to the East of the main body. Moreover, by comparison with very low-surface-brightness dwarfs also residing in Virgo, identified in the same images as SECCO 1, we were able to constrain any population older than Gyr within SECCO 1 to have surface brightness significantly fainter than mag/arcsec2.
Finally, Adams et al. (2015, A15, hereafter) presented new Hi observations that resolved the original HVC274.68+74.0 cloud (that was seen as an individual entity of size at the resolution of the ALFALFA survey) into a main cloud nearly centred on MB (AGC 226067), likely connected by a thin bridge to a smaller cloud (, AGC 229490) located to the West of SB. A15 concluded that (a) with the revised estimates of the mass of the gas clouds the gas-to-stellar-luminosity(mass) ratio becomes less extreme than that derived by B15b and S15, and more similar to the galaxies studied by Cannon et al. (2011), and (b) that SECCO 1 MB (AGC 226067), SB (which they call AGC 229491) and the nearby cloudlet AGC 229490 are two or three low-mass galaxies within the Virgo cluster having some kind of mutual interaction (see A15 for a detailed discussion, and Bekki, 2015, for a theoretical analysis).
Here we present the velocity field and the metallicity of several Hii regions in SECCO 1 MB and SB obtained with the Multi Unit Spectroscopic Explorer (MUSE) at the VLT. Archival images data taken with the Hubble Space Telescope (HST) are used in support of our study. A thorough analysis of the full wealth of information contained in the MUSE and HST data is deferred to a future contribution, where we will discuss in depth the various hypotheses for the origin of SECCO 1. According to Mei et al. (2007) the Virgo cluster has a significant depth along the line of sight (the range is Mpc). Hence it should be kept in mind that the distance of SECCO 1 is not so tightly constrained by its membership to Virgo; the LVC probably lies slightly behind the core of the cluster (Mei et al., 2007). In the following we adopt the conventional distance D=17.0 Mpc, after Boselli et al. (2014) and consistent with A15.
2 Observations and data reduction
MUSE is a panoramic integral-field spectrograph able to acquire low resolution spectra (, from the bluest to the reddest wavelength) in the spectral range m (Bacon et al., 2014). The adopted Wide Field Mode (WFM) provides a field of view (FoV) of , with a pixel scale pix. A total of 4 h of telescope time were allocated to the Director’s Discretionary Time program 295.B-5013 (PI: Beccari).
Two pointings were sufficient to sample the MB and the SB of SECCO 1. For each target we acquired 6 exposures of 1000 s each. We used a simple dither pattern and applied 90 deg offset to the de-rotator between each consecutive exposure, to improve the flat fielding and to ensure an homogeneous image quality across the FoV. The average seeing during the exposures was , corresponding to a measured full width at half maximum (FWHM) of px on the final image. The raw data from each exposure were reduced and combined with the MUSE pipeline v1.4 (Weilbacher et al., 2012) run under the esoreflex environment (Freudling et al., 2013). The final cubes were split into 3801 single layers (i.e. single frames), sampling the targets from to with a step in wavelength of .
The modest degree of crowding in our data allowed us to extract the background subtracted flux of any source from every single layer of the cube using a standard aperture photometry routine with the task phot of iraf . A master list of objects was created by searching for individual sources with significant peaks ( above the background) a) in an image obtained collapsing few frames located around the H line, and also b) in an image obtained by collapsing the entire cube into a single frame, and then merging together the two lists. This approach allowed us to recover either sources dominated by H emission or by the stellar continuum. The extraction of the spectra was performed using an aperture of radius=5 pix, i.e. FWHM. A larger aperture of 10 pix was also adopted for flux calibration purposes. With this method we extracted the spectra of 68 and 45 sources in the MB and SB, respectively. Further analysis revealed that only 26(12) of them can be reliably associated to MB(SB), the remaining ones being background galaxies or sources lacking spectral features allowing a reliable velocity estimate. These 26+12 =38 bona-fide SECCO 1 sources, listed in Table 1, have spectra typical of Hii regions and are the subject of the following analysis. It cannot be excluded that some of the listed sources are not independent individual Hii regions but are in fact emission peaks within larger complexes. For the purpose of the present analysis this does not seem to be a serious concern. A complementary view not based on integrated spectra of individual sources but on a pixel-by-pixel analysis will be presented in a forthcoming paper (Magrini et al. in prep).
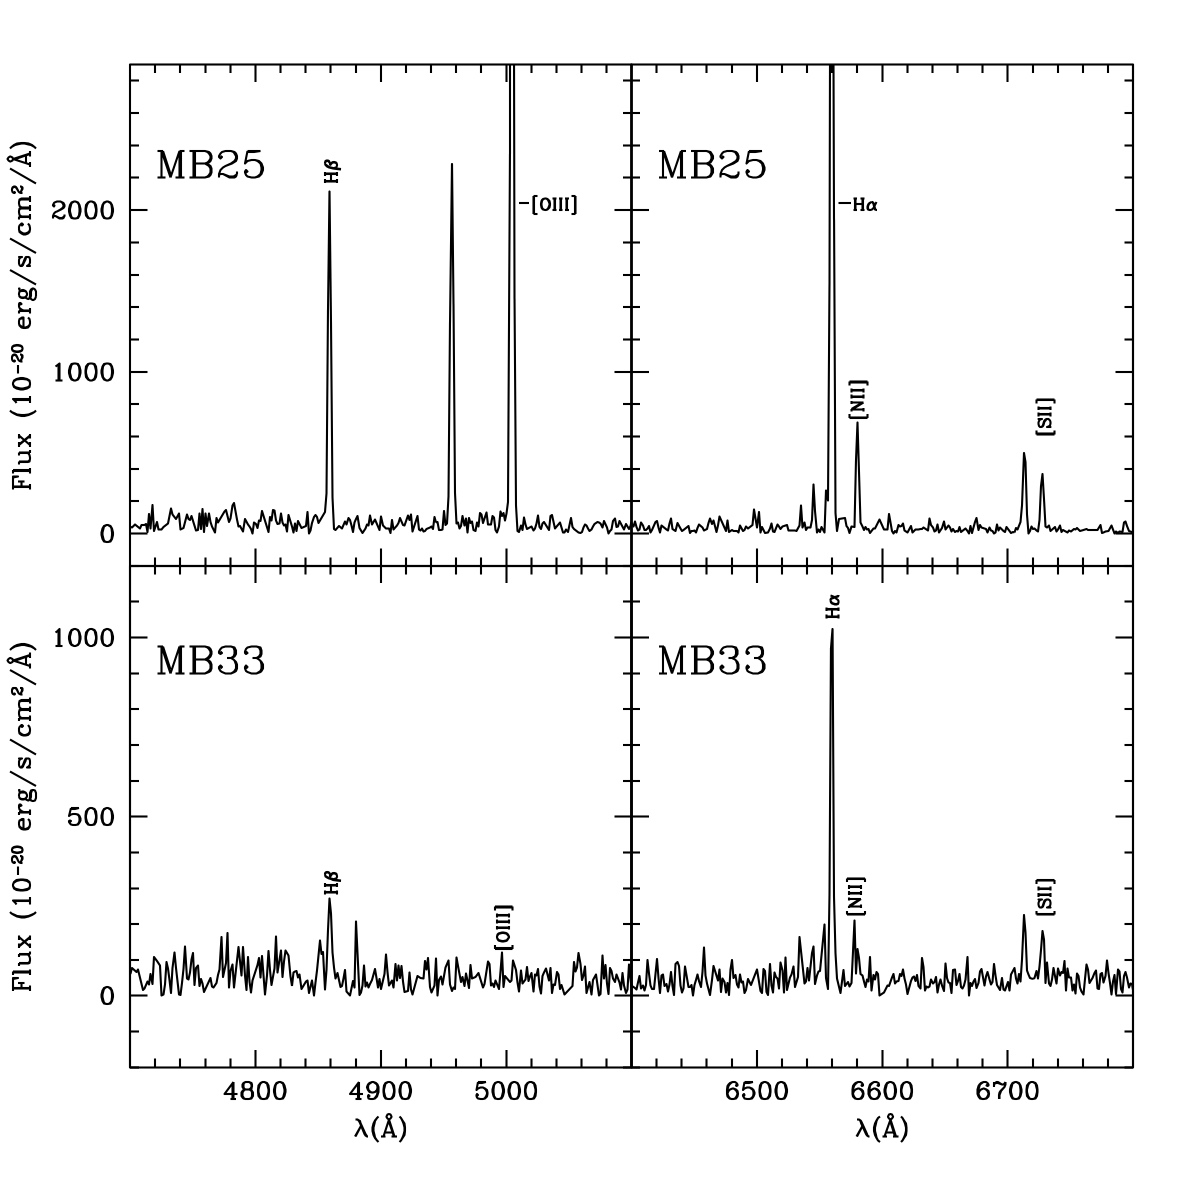
In Fig. 1 we show two illustrative examples of the 1-D spectra extracted from the MUSE cubes, bracketing the range of signal-to-noise ratio (S/N) where we were able to derive reliable metallicity estimates (see Sect. 4, below). The superb sensitivity of MUSE, the possibility to integrate the entire flux of each source inherent to 2-D spectrographs, and the lack of any slit-aligmnent issue (that plagued B15b observations) makes the quality and the S/N of the MUSE spectra presented here much higher than those analysed in B15b (see their figure 2 for comparison). Moreover the spectral range covered by MUSE spectra is much wider than in B15b, e.g., including Hβ, that was not reached in B15b spectra. All these factors imply a significant improvement in the precision and reliability of the new metallicity estimates for sources of similar luminosity, with respect to that analysis (see Sect. 4, for further discussion).
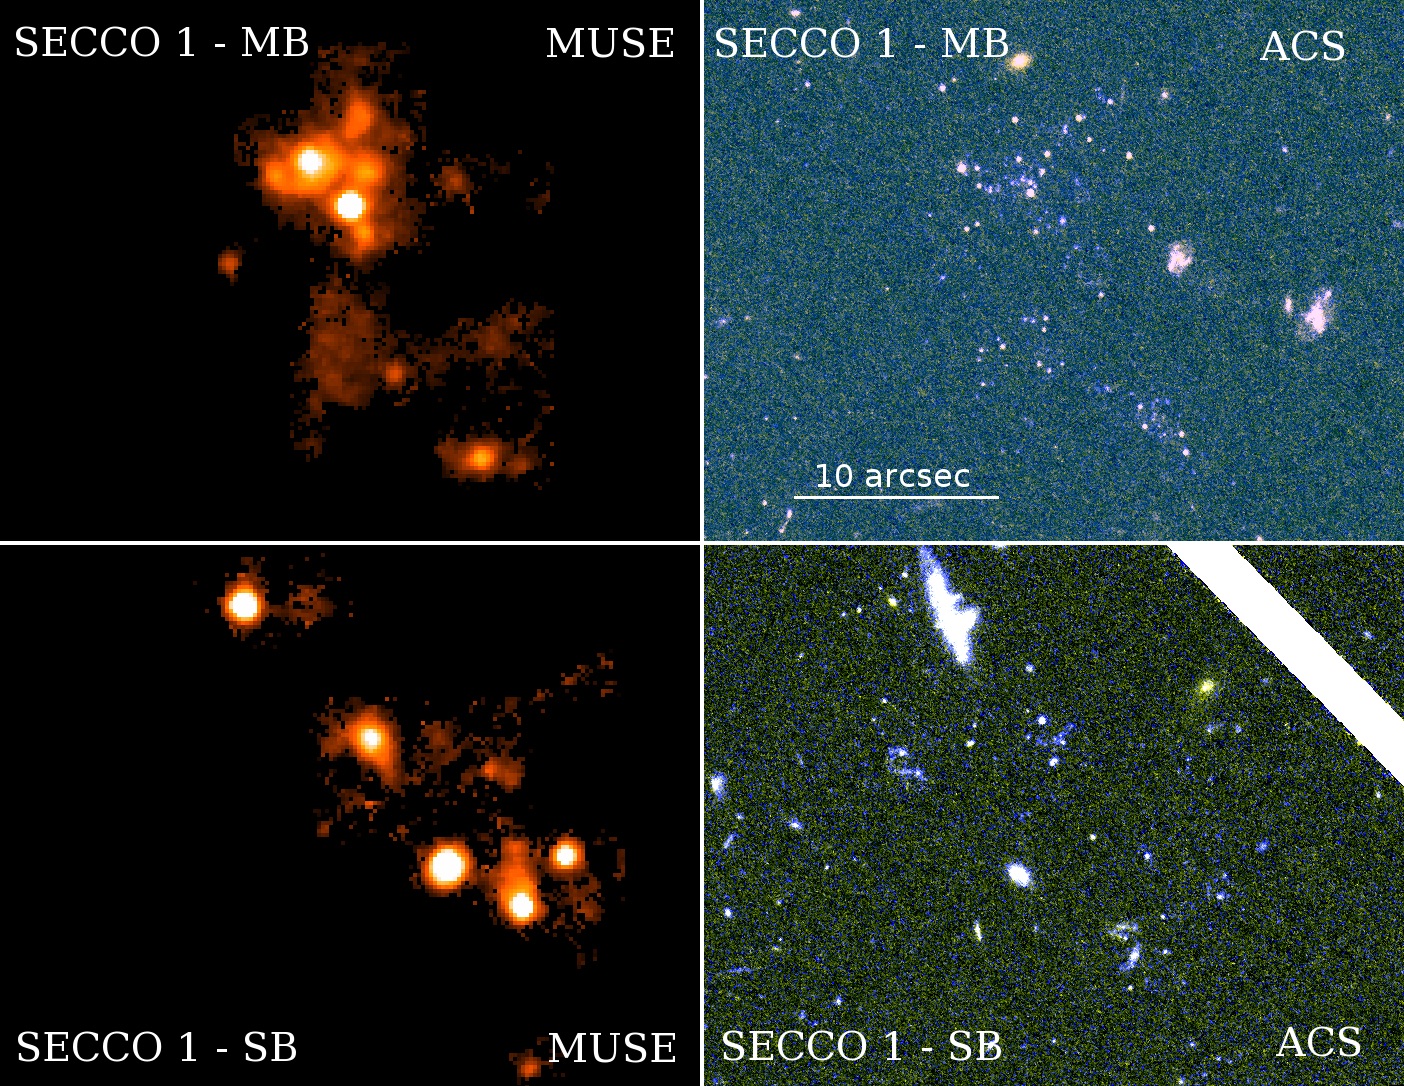
The left panels of Fig. 2 show stamp-size H images of SECCO 1 MB and SB obtained from the MUSE cube. It is clear that, in addition to several individual sources (likely Hii regions) there is also diffuse hot gas emitting in H. In the right panels, we show the corresponding portions of the combined F606W ( s) and F814W ( s) images from the HST GO-13735 program (PI: Sand), that we retrieved from the STScI archive. These images resolve many of the structures seen in the H images into individual bright and very blue compact sources. The correspondence between the sources identified in the MUSE image and those seen in the ACS ones is excellent. We note that four SB sources are superposed on the prominent background disk galaxy at the upper margin of the image in the lower right panel of Fig. 2. The lines of this galaxy (at z=0.187), as well as those of the more distant smaller spiral the lower end of its disc (at z=0.752), are both seen in the spectra of these SB sources, a remarkable case of multiple chance superposition. No underlying over-density of old stars (i.e. Red Giant Branch stars, with age Gyr) associated with SECCO 1 is readily visible in the ACS image, in agreement with the conclusions by B16.
| Name | RAJ2000 | DecJ2000 | V | N | Hα Fluxc |
| [deg] | [deg] | [km/s] | 10-18 erg cm-2 s-1 | ||
| MB14 | 185.47292 | 13.45734 | 2 | ||
| MB15 | 185.47360 | 13.45784 | 3 | ||
| MB25 | 185.47537 | 13.46103 | 7 | ||
| MB26 | 185.47644 | 13.46143 | 3 | ||
| MB27 | 185.47583 | 13.46145 | 7 | ||
| MB28 | 185.47683 | 13.46176 | 5 | ||
| MB29 | 185.47600 | 13.46184 | 7 | ||
| MB30 | 185.47559 | 13.46189 | 6 | ||
| MB31 | 185.47440 | 13.46191 | 2 | ||
| MB32 | 185.47605 | 13.46241 | 3 | ||
| MB33 | 185.47515 | 13.46244 | 4 | ||
| MB34 | 185.47470 | 13.46269 | 1 | ||
| MB38 | 185.47599 | 13.46325 | 1 | ||
| MB39 | 185.48480 | 13.46324 | 1 | ||
| MB56 | 185.47591 | 13.46160 | 7 | ||
| MB57 | 185.47710 | 13.46022 | 1 | ||
| MB58 | 185.47473 | 13.45869 | 1 | ||
| MB59 | 185.47516 | 13.46063 | 7 | ||
| MB60 | 185.47386 | 13.46140 | 1 | ||
| MB61 | 185.47513 | 13.46149 | 7 | ||
| MB62 | 185.47534 | 13.46228 | 5 | ||
| MB63 | 185.47349 | 13.45754 | 3 | ||
| MB64 | 185.47299 | 13.45942 | 3 | ||
| MB65 | 185.47556 | 13.45894 | 2 | ||
| MB66 | 185.47582 | 13.45961 | 1 | ||
| MB68 | 185.47523 | 13.46229 | 5 | ||
| SB01 | 185.48451 | 13.48588 | 6 | ||
| SB02 | 185.48465 | 13.48644 | 6 | ||
| SB03 | 185.48285 | 13.48419 | 4 | ||
| SB33 | 185.48427 | 13.48577 | 3 | ||
| SB34 | 185.48272 | 13.48436 | 4 | ||
| SB35 | 185.48314 | 13.48445 | 4 | ||
| SB36 | 185.48105 | 13.48392 | 3 | ||
| SB38 | 185.47995 | 13.48273 | 3 | ||
| SB39 | 185.48163 | 13.48259 | 5 | ||
| SB41 | 185.48058 | 13.48202 | 5 | ||
| SB42 | 185.48046 | 13.47975 | 1 | ||
| SB45 | 185.48455 | 13.48620 | 6 | ||
| a Heliocentric radial velocity. | |||||
| b Number of emission lines used to estimate the radial velocity. | |||||
| c Observed flux, not extinction corrected. | |||||
3 Radial velocity
We derived the radial velocity of each individual compact source by determining the wavelength shift of the available emission lines relative to their rest wavelengths. To estimate the peak of each emission line we used a gaussian fitting algorithm. The final radial velocity was obtained from the average wavelength shift; the velocity uncertainties, given by the RMS divided by the square root of the number of measured lines, encompass the range km/s, with an average value of km/s (see Table 1).
| name | note | note | ||||
| [km/s] | [km/s] | [mag] | ||||
| SECCO 1 MB | from 25 Hii regionse | from 4 Hii regionsd | ||||
| AGC226067 | Hi (from A15) | |||||
| SECCO 1 SB | from 8 Hii regione | from 5 Hii regionsd | ||||
| AGC229490 | Hi (from A15) | |||||
| a Straight mean standard deviation | ||||||
| b Integrated apparent magnitude from aperture photometry on the ACS images | ||||||
| c Computed with a Maximum Likelihood algorithm that take into account the effect of errors on individual velocities | ||||||
| d Only the sources where a reliable metallicity estimate can be obtained and not affected by contamination from nearby regions , see Tab. 4 | ||||||
| e MB: Excluding MB64. SB: Excluding the four most northern sources, that are superposed to two background galaxies | ||||||
In Table 2 we report the mean velocity and metallicity of SECCO 1 MB and SB, separately, and the velocities of the associated Hi clouds, from A15, for comparison. The reported mean velocities and velocity dispersions have been computed with a Maximum Likelihood (ML) algorithm that finds the most likely parameters of a gaussian model taking into account (and correcting for) the effects of the errors on individual velocities, following Martin et al. (2007). The small difference in mean velocity ( km/s, to be compared with the velocity dispersion of the LVC, km/s, Boselli et al., 2014) implies that MB and SB are indeed physically associated. MB and the AGV226067 Hi cloud have compatible systemic radial motions; the same is true for SB and AGC229490, in spite of the spatial offset between the two systems. On the other hand, we cannot exclude a small ( km/s) but real mismatch between the systemic velocity of the MB and SB Hii regions and the corresponding Hi clouds, as the small spatial offset between SB and AGC229490 may suggest ongoing ejection of the neutral gas from their stellar counterparts. The velocity dispersion of the two stellar systems is only marginally resolved in our data. This may be partly due to the contamination among spectra of overlapping sources, especially in the densest region of MB, that can result in spurious correlations of velocities. Moreover, we have excluded from the ML analysis one source from the MB sample and four sources from the SB sample, having discrepant velocities (see below). If we compute the unweighted mean and standard deviation from all the measured sources we obtain km/s and km/s for MB, and km/s and km/s for SB, leaving substantially unchanged the above conclusions and indicating that the true dispersion should be similar to that measured in Hi. The isolated source at (X,Y) provides significant support to the hypothesis that a few additional components associated with SECCO 1 are indeed present to the East of MB, as suggested by B16.
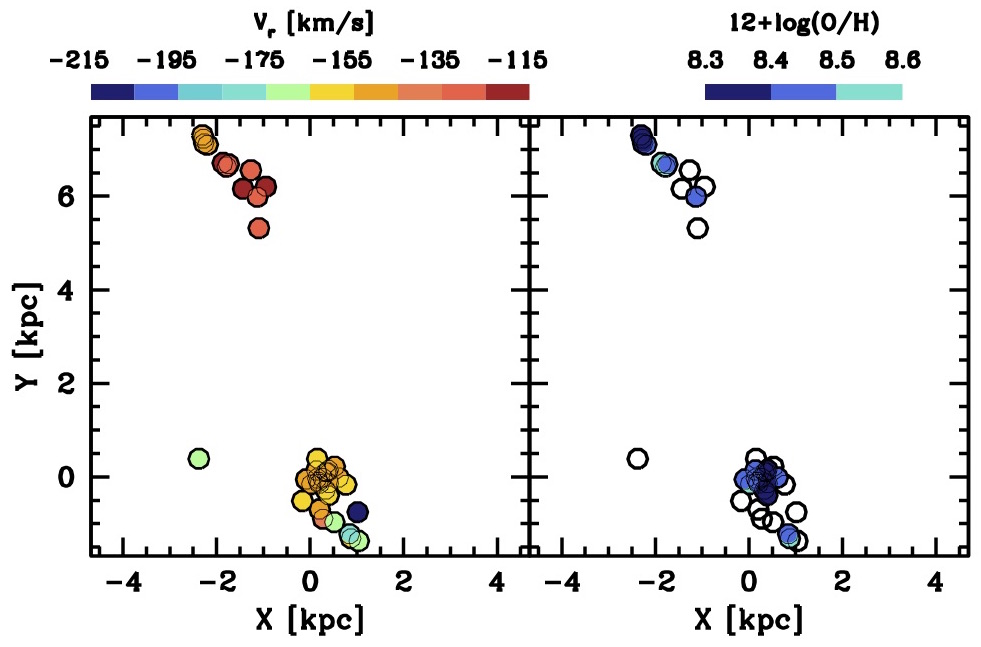
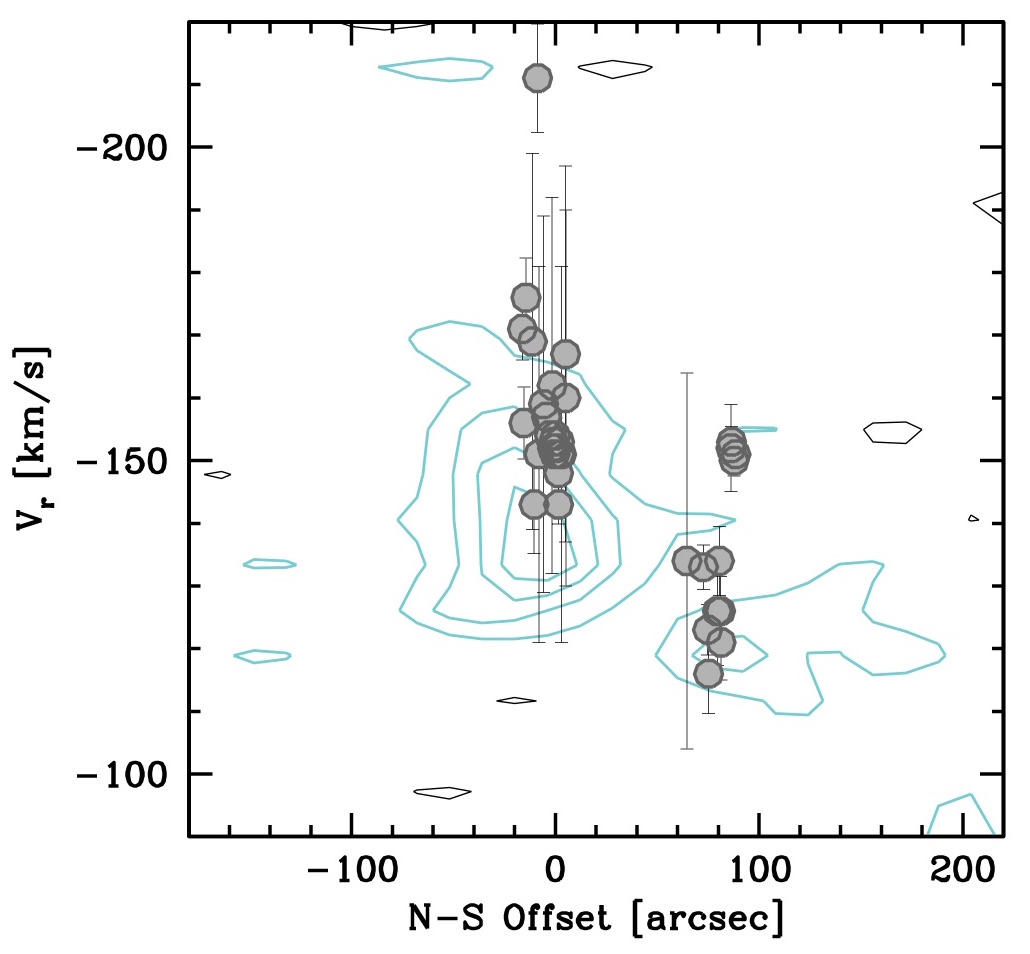
The left panel of Fig. 3 shows that the Hii regions within MB display a weak velocity gradient very similar to that displayed by the Hi (A15). In general, the overall velocity fields traced by the Hii regions and by the neutral hydrogen are remarkably similar, within the uncertainties. A direct comparison is presented in Fig. 4, where our sources are superimposed on the North-South position-velocity slice we derived from the A15 data (kindly provided by E. A. K. Adams). A few sources do not follow the general pattern, including, e.g. the source with km/s at (X,Y), and the four SB sources superposed on a background spiral at (X,Y). It is interesting to note that these velocity outliers seem to have Hi counterparts, albeit of weak intensity. To check the significance of these sources we used Barolo (Di Teodoro & Fraternali, 2015) to run a source detection in the HI data-cube. The only two sources detected at high resolution with reliable sensitivities (thresholds between 2.5 and 3.0 were Secco 1 MB and a cloud a much smaller velocity ( at RA=185.466 an DEC=13.459) probably belonging to the Milky Way environment, if real. At lower spatial resolution () more sources are found, some emission appears in the region of the SB and further out with some hint of a general gradient in velocity. However it is very hard with these data to assess its reliability.
| Name | [OIII] | Hα | [NII] | [SII] | [SII] |
|---|---|---|---|---|---|
| 5007Å | 6563Å | 6584Å | 6717Å | 6730Å | |
| MB14 | - | 28920 | - | - | - |
| MB15 | 7325 | 28940 | 3223 | 8427 | 3323 |
| MB25 | 25616 | 28918 | 324 | 334 | 254 |
| MB26 | 569 | 28923 | 529 | 569 | 439 |
| MB27 | 13010 | 28920 | 446 | 506 | 375 |
| MB28 | 6834 | 28960 | 3233 | 7138 | 3434 |
| MB29 | 607 | 28920 | 547 | 557 | 396 |
| MB30 | 11811 | 28922 | 528 | 518 | 397 |
| MB31 | 12538 | 28948 | 5234 | 5935 | 4334 |
| MB32 | 5122 | 28133a | 3521 | 8523 | 4922 |
| MB33 | 2917 | 28935 | 1917 | 5719 | 4919 |
| MB56 | 757 | 28919 | 526 | 547 | 386 |
| MB59 | 23816 | 28918 | 285 | 325 | 265 |
| MB61 | 28218 | 28918 | 415 | 375 | 295 |
| MB62 | 6915 | 28930 | 5815 | 5915 | 4815 |
| MB63 | 3116 | 28930 | 3917 | 8019 | 4117 |
| MB68 | 7016 | 28933 | 6417 | 5817 | 4816 |
| SB01 | 11212 | 28922 | 297 | 237 | 197 |
| SB02 | 9910 | 28919 | 276 | 276 | 216 |
| SB03 | 159 | 28924 | 4711 | 6012 | 3810 |
| SB33 | 13616 | 28927 | 4112 | 1911 | 2411 |
| SB34 | 179 | 26520a | 269 | - | - |
| SB35 | 3112 | 28925 | 4212 | 5513 | 3912 |
| SB41 | 8011 | 28924 | 419 | 319 | 288 |
| SB45 | 10010 | 28920 | 256 | 266 | 226 |
| Only lines used for metallicity estimates are included. | |||||
| a Negative extinction constant, null extinction assumed. | |||||
4 Metallicity
All measured line intensities were corrected for extinction computing the ratio between the observed and theoretical Balmer decrement for the typical conditions of an Hii region (see Osterbrock & Ferland, 2006). In the few cases, where the extinction constant is negative we assumed a null extinction. The extinction in both the MB and SB is quite low, with average c in the MB and SB equal to 0.290.24 and 0.220.26, respectively. We measured the line fluxes with the task splot of iraf. In the MUSE spectral range, we measured recombination lines of H (H and H) and collisional lines of several ions ([Oiii], [Nii], [Sii], and in a few cases [Oii], [Ariii], and [Siii]). All the diagnostic plots based on the ratios between available lines consistently classify all the identified sources as Hii regions. The fluxes of the lines that were used for the estimate of the metallicity are presented in Table 3, in a scale where the flux of is conventionally set to 100. The conversion to physical units can be obtained with the fluxes provided in Table 1, as some sources lack a reliable estimate of the flux.
Due to the absence of electron-temperature diagnostic lines, the gas-phase oxygen abundance of each source is determined with three different strong-line ratios: N2=[Nii]/H, O3N2=([Oiii]/H)/([Nii]/H) (Pettini & Pagel, 2004, hereafter PP04) and O3S2N2, a combination of the line ratios R3=([Oiii](4959+5007))/H, N2, and NS=([Sii](6717+6730))/H, also known as S2 (Pilyugin & Mattsson, 2011). N2 and O3N2 from PP04 have indeed proved to be the strong-line diagnostics that give metallicity values very close to those obtained by directly measuring the electron temperature of the gas through [O iii]4363 line (see, e.g. Andrews & Martini, 2013). On the other hand, when [Oiii], [Sii], [Nii], H, and H are all simultaneously available with good signal-to-noise ratios, we take advantage of the NS method that allows us to estimate the ionising field in absence of the [O ii] lines and has been successfully validated against oxygen abundances computed using the electron temperature (López-Sánchez et al., 2012). Finally, we compute the average of the abundances from N2 and O3N2. We combine N2 and O3N2 to compensate for the effect of a varying ionisation. We rejected all metallicity estimates including line ratios with S/N. Once this selection is applied we get reliable estimates of the metallicity, at least from one indicator, for 18 sources, 10 in MB and 8 in SB.
All the metallicity estimates from individual indicators as well as the adopted mean from different indicators are reported in Table 4, where we list also the estimates obtained from N2 and O3N2 (and their average) adopting the calibration by Marino et al. (2013), instead of Pettini & Pagel (2004). Table 4 provides all the information to evaluate the (negligible) effect of adopting one of the different indicators and/or calibrations chosen on our results. Six sources whose line ratios was found to change varying from 5 px to 10 px the radius of the aperture used of the flux’s extraction are marked with and asterisk in Table 4, and have been excluded when computing the average metallicity obtained from estimates involving the [OIII] line. In fact, the changes are small and limited to line ratios including [OIII] and are due to contamination from the two very bright adjacent sources MB25 and MB61, that have very strong [OIII] lines. We verified, using the Dopita et al. (2016) diagnostic diagrams, that the higher EW([OIII]) in these sources is not associated to metallicity effects but to an increase of the ionisation parameter. A detailed discussion of the ionisation conditions across SECCO 1 will be presented in a forthcoming paper (Magrini et al. in prep.). The last four rows of the table report the straight mean (Mean) and standard deviation (), the mean and standard deviation obtained with with the same ML algorithm used in Sect. 3 (MeanML and ) with the associated uncertainties, and the number of sources used to derive these parameters (N).
Note that each calibration has an intrinsic uncertainty of about 0.2 dex and that they are not exactly on the same absolute scale; it is reassuring that, nevertheless, they provide fully consistent results. In particular, the spread in metallicity is always consistent with zero, within the uncertainties: even the straight standard deviation is smaller than the uncertainty on the individual 12+log(O/H) estimates, independently of the adopted indicator, implying a strong degree of chemical homogeneity among the various SECCO 1 sources. In the following we will adopt metallicities from the combination of the PP04’s methods as our reference values (second column of Tab. 4). The mean abundance from this combination of indicators is , corresponding to (assuming the solar abundance of Grevesse et al., 2007). The average values for MB and SB are the same within the uncertainty, and , respectively (see Tab. 2).
The mean abundance of SECCO 1 is much higher than in dwarf galaxies with similar stellar mass (see, e.g., Lee et al., 2003, and B15b), being more typical of galaxies as conspicuous as as M33 (Magrini et al., 2010) or the LMC (Carrera et al., 2008; Pagel et al., 1978). It is also interesting to note that the observed abundance of SECCO 1 Hii regions is significantly higher than the hot intra-cluster medium at the same projected distance from the center of Virgo (, Urban et al., 2011).
In the right panel of Fig. 3 the sources for which a reliable estimate of the metallicity can be obtained are color-coded according to their 12+log(O/H) values. The map illustrates very clearly the chemical homogeneity of all the sources, already noted above, with no detectable trend with position or velocity.
| Name | 12+log(O/H) | 12+log(O/H) | 12+log(O/H) | 12+log(O/H) | 12+log(O/H) | 12+log(O/H) | 12+log(O/H) |
|---|---|---|---|---|---|---|---|
| Ind(Cal) | N2+O3N2(PP04) | N2(PP04) | O3N2(PP04) | NS(PM11) | N2(M13) | O3N2(M13) | N2+O3N2(M13) |
| MB25 | 8.33 0.21 | 8.36 0.08 | 8.30 0.11 | 8.31 0.18 | 8.30 0.08 | 8.25 0.11 | 8.28 0.19 |
| MB26∗ | 8.52 0.22 | 8.48 0.10 | 8.57 0.17 | 8.33 0.22 | 8.40 0.10 | 8.43 0.17 | 8.41 0.20 |
| MB27∗ | 8.43 0.21 | 8.44 0.09 | 8.43 0.11 | 8.33 0.17 | 8.37 0.09 | 8.34 0.11 | 8.35 0.19 |
| MB29∗ | 8.53 0.21 | 8.49 0.08 | 8.57 0.14 | 8.35 0.18 | 8.41 0.08 | 8.42 0.14 | 8.42 0.19 |
| MB30∗ | 8.47 0.22 | 8.48 0.10 | 8.47 0.13 | 8.37 0.20 | 8.40 0.10 | 8.36 0.13 | 8.38 0.19 |
| MB56 | 8.50 0.21 | 8.47 0.09 | 8.53 0.12 | 8.35 0.17 | 8.40 0.09 | 8.40 0.12 | 8.40 0.19 |
| MB59 | 8.30 0.22 | 8.32 0.10 | 8.28 0.13 | 8.26 0.22 | 8.27 0.10 | 8.24 0.13 | 8.26 0.20 |
| MB61 | 8.36 0.21 | 8.42 0.08 | 8.31 0.11 | 8.36 0.18 | 8.35 0.08 | 8.26 0.11 | 8.30 0.19 |
| MB62∗ | 8.53 0.25 | 8.50 0.15 | 8.56 0.25 | 8.36 0.33 | 8.42 0.15 | 8.42 0.25 | 8.42 0.23 |
| MB68∗ | 8.54 0.26 | 8.52 0.16 | 8.57 0.26 | 8.46 0.42 | 8.44 0.16 | 8.42 0.26 | 8.43 0.23 |
| SB01 | 8.37 0.24 | 8.34 0.14 | 8.40 0.18 | 8.29 0.35 | 8.29 0.14 | 8.31 0.18 | 8.30 0.22 |
| SB02 | 8.36 0.23 | 8.31 0.12 | 8.40 0.17 | 8.24 0.28 | 8.27 0.12 | 8.31 0.17 | 8.29 0.21 |
| SB03 | 9999 999 | 8.45 0.13 | 9999 999 | 8.25 0.28 | 8.38 0.13 | 9999 999 | 9999 999 |
| SB33 | 8.41 0.26 | 8.41 0.16 | 8.41 0.22 | 8.29 0.49 | 8.35 0.16 | 8.32 0.22 | 8.34 0.23 |
| SB34 | 9999 999 | 8.33 0.18 | 9999 999 | 9999 999 | 8.28 0.18 | 9999 999 | 9999 999 |
| SB35 | 9999 999 | 8.43 0.16 | 9999 999 | 8.25 0.33 | 8.36 0.16 | 9999 999 | 9999 999 |
| SB41 | 8.45 0.24 | 8.42 0.13 | 8.49 0.19 | 8.34 0.31 | 8.35 0.13 | 8.37 0.19 | 8.36 0.21 |
| SB45 | 8.35 0.24 | 8.30 0.13 | 8.39 0.18 | 8.23 0.30 | 8.26 0.13 | 8.31 0.18 | 8.28 0.21 |
| Mean | 8.38 | 8.41 | 8.39 | 8.32 | 8.35 | 8.31 | 8.31 |
| 0.06 | 0.07 | 0.08 | 0.06 | 0.06 0.05 | 0.04 | 0.05 | |
| MeanML | 8.38 0.07 | 8.42 0.02 | 8.37 0.05 | 8.32 0.06 | 8.35 0.03 | 8.30 0.05 | 8.31 0.07 |
| 0.00 0.08 | 0.00 0.03 | 0.00 0.07 | 0.00 0.06 | 0.00 0.03 | 0.00 0.05 | 0.00 0.07 | |
| N | 9 | 18 | 9 | 17 | 18 | 9 | 9 |
| PP04=Pettini & Pagel (2004); PM11=Pilyugin & Mattsson (2011); M13=Marino et al. (2013). The NS indicator is also known as S2. | |||||||
| a Average of the values from N2(PP04) and O3N2(PP04). Adopted as reference in the analysis. | |||||||
| b Average of the values from N2(M13) and O3N2(M13). Reported for comparison. | |||||||
| ∗ [OIII] flux possibly affected by contamination from nearby bright sources in r=10 px apertures. | |||||||
5 Stellar Mass and Star Formation Rate
The very irregular morphology of SECCO1 as well as the lack of detection of an underlying unresolved population makes the estimate of the integrated luminosity quite challenging. Our MUSE data give us the unprecedented capability of distinguishing sources that are members of SECCO 1 from unrelated background galaxies over the whole extension of the system. This factor, coupled with the use of deep high-resolution ACS images, allow us to obtain a new estimate of the total luminosity of SECCO 1 that is much more robust and reliable than previous ones (e.g., B15b, A15). We used the Aperture Photometry Tool (APT, Laher et al., 2012) to estimate the total (sky-subtracted) flux within a few non-overlapping circular apertures of different radii () properly placed to enclose all the MB and SB sources and their surroundings while avoiding contamination by nearby background sources (mainly distant galaxies). The sky was estimated as the median value over wide annuli surrounding each aperture. The resulting F606W and F814W integrated magnitudes were transformed into V magnitudes using Eq. 1 of Galleti et al. (2006). We obtain and for MB and SB, respectively. The F606W-F814W colors are and , respectively. Adopting E(B-V)=0.048 from B15a and D= Mpc, the absolute magnitudes are and for MB and SB, respectively, corresponding to and ; the total V luminosity of SECCO1 (MB+SB) is . The new value for MB is one full magnitude fainter than what obtained by B15b and 0.7 mag fainter than that reported by A15333Converted from Mg and with the equation , derived in the same way as Eq. 5 and Eq. 6 by Bellazzini et al. (2011), and valid for ., with the same assumptions on distance and reddening. The difference is due to the removal of the contribution of background sources from the luminosity budget of SECCO1, which was not possible with the data available to B15a or A15. Note however, that, because of the considerable uncertainty associated with these measures, the newly derived value is within of previous estimates.
From the above numbers and the new Hi mass estimates by A15, considering only the spatially coincident AGC226067 Hi cloud and assuming a 10 per cent error in , we obtain, for the main body of SECCO 1 . A similar ratio is obtained considering SB and AGC 229490, but given the spatial offset between the two systems it is unclear how meaningful is in this specific case.
The fact that all the detected sources are Hii regions implies that the stellar population largely dominating the light from SECCO 1 has an age Myr. There is general consensus that such a population should have a stellar ratio , with decreasing for younger ages. For example, the models by Maraston (1998) predict for a Simple Stellar Population (SSP) of age=30 Myr with [Z/H]=-1.35, and for [Z/H]=-0.33, assuming a Salpeter (1955) Initial Mass Function (IMF). The corresponding numbers for a Kroupa (2001) IMF are and . The BASTI solar-scaled models (Pietrinferni et al., 2004; Percival et al., 2009) predicts for SPSS with age=30(50) Myr and [Fe/H]=-0.66, and for [Fe/H]=-1.49. for SPSS with age=30(50) Myr is also predicted by the widely used Bruzual & Charlot (2003) models, with negligible dependence on metallicity and on the adopted set of stellar models (see, e.g., their Fig. 1 and Fig. 2). Assuming, conservatively and for simplicity, , we obtain a stellar mass for MB and for the whole SECCO 1 system.
Given the very low stellar mass, the number of Hii regions found in SECCO 1 may appear quite large, if taken at face value (but see Sect. 2, above). For example, the relatively large dIrr WLM has a stellar mass and a Hi mass (McConnachie, 2012) and it hosts “only” 21 Hii regions (Hodge & Miller, 1995). We verified that the observed number of Hii regions in SECCO 1 does not imply an anomalous IMF. Adopting, conservatively, an IMF as bottom-heavy as the Salpeter (1955), a population with the stellar mass of is expected to produce stars with , more than sufficient to populate all the observed Hii regions.
On the other hand, integrating the extinction-corrected luminosity over all the 38 Hii regions and adopting the calibration by Kennicutt (1998), we obtain a total star formation rate (SFR) of 444The much lower value reported in B15a was derived from the only two Hii regions considered in that paper, hence it was based on a severely incomplete census of the luminosity of the system as a whole.. This is significantly higher than the typical SFR observed in dwarf galaxies of comparable luminosity (; James et al., 2015, see, e.g., their Fig. 6), suggesting that the ongoing star formation episode that made SECCO 1 detectable is indeed exceptionally strong for such a low-mass system.
6 Discussion and Conclusions
From the results described above we can draw several important conclusions shedding new light onto the nature of SECCO 1.
First of all, it is demonstrated beyond any doubt that MB, SB (and possibly also a few additional and nearly-isolated Hii regions in the surroundings) are physically associated. The remarkable homogeneity in metallicity strongly suggest that the various pieces of SECCO 1 originated from a single, chemically homogeneous Hi cloud that is now disrupting, probably because of its interaction with the cluster environment. This would make the system unlikely to be in dynamical equilibrium, precluding a dynamical mass estimate
Second, the new observations seem to confirm, albeit with the large associated uncertainties, that the system has an extreme under-abundance of stars given its Hi content, in agreement with B15b and S15, and contrary to the conclusions of A15. The stellar mass estimate obtained in Sect. 5 implies that the Hi-to-stellar mass ratio is , placing SECCO 1 straight in the realm of almost-dark galaxies, as defined by Cannon et al. (2015, see also ).
Finally, the very high mean metallicity given the stellar mass (, for MB, and , for SB) strongly suggests that the gas from which SECCO 1 stars were born was pre-enriched elsewhere, possibly torn apart by tides from the disk of a spiral galaxy during its in-fall into Virgo. Indeed, the location of SECCO 1 in a luminosity-metallicity plot is typical of tidal galaxies (Sweet et al., 2014). The (apparent) lack of an old population would also be consistent with this hypothesis. The extreme SFR, given the total luminosity, may be suggestive of a star formation episode induced by some kind of interaction. As noted in B15a there are no obvious candidate parent galaxies in the immediate surroundings of SECCO 1. An intriguing candidate, for the kind of system that can have produced SECCO 1 as a tidal galaxy is the interacting pair NGC 4299 + NGC 4294 (Chung et al., 2009), which show prominent Hi tails, have velocity and distance compatible with membership to the LVC, and lie at the projected distance of kpc from SECCO 1. However, an origin from this interacting system would place the detachment of SECCO 1 about 1.2 Gyr in the past (assuming the current radial velocity difference as a reference value), implying a long traveling within Virgo/LVC before the occurrence of the first feeble burst of star formation, just a few tens of Myr ago. This simple consideration suggests that other evolutionary paths are worth to be considered for this intriguing object, that may hint at the existence of an additional class of extremely dark stellar systems. A thorough comparative discussion of alternative hypothesis on the origin of SECCO 1 is clearly beyond the scope of the present contribution and is deferred to a future paper.
Acknowledgements
We thank the anonymous referee for her/his very thorough reading of our manuscript, and suggestions that substantially improved our paper. We warmly thank Elizabeth Adams for kindly providing the VLA Hi data-cube of AGC 226067. G.B. gratefully acknowledges the financial support by the Spanish Ministry of Economy and Competitiveness under the Ramón y Cajal Program (RYC-2012-11537). This research has made use of the SIMBAD database, operated at CDS, Strasbourg and of the NASA/IPAC Extragalactic Database (NED) which is operated by the Jet Propulsion Laboratory, California Institute of Technology, under contract with NASA.
References
- Adams et al. (2013) Adams, E.K., Giovanelli, R., Haynes, M.P., 2013, ApJ, 768, 77 (A13)
- Adams et al. (2015) Adams, E.K., Cannon, J.M., Rhode, K.L., et al., 2015, A&A, 580, A134 (A15)
- Andrews & Martini (2013) Andrews, B. H., & Martini, P. 2013, ApJ, 765, 140
- Bacon et al. (2014) Bacon, R., Vernet, J., Borisova, E., et al. 2014, The Messenger, 157, 13
- Bellazzini et al. (2011) Bellazzini, M., Beccari, G., Oosterloo, T.A., et al., 2011, A&A, 527, A58
- Bellazzini et al. (2015a) Bellazzini, M., Beccari, G., Battaglia, et al., 2015a, A&A, 575, 126 (B15a)
- Bellazzini et al. (2015b) Bellazzini, M., Magrini, L., Mucciarelli, A., et al., 2015b, ApJ, 800, L15 (B15b)
- Beccari et al. (2016) Beccari, G., Bellazzini, M., Battaglia, G., et al., 2016, A&A, 591, 56 (B16)
- Bekki (2015) Bekki, K., 2015, MNRAS, 454, L41
- Boselli et al. (2014) Boselli, A., Voyer, E., Boissier, S., et al., 2014, A&A, 570, A69
- Bruzual & Charlot (2003) Bruzual, G., Charlot, S., 2003, MNRAS, 344, 1000
- Cannon et al. (2011) Cannon, J.M., Giovanelli, R., Haynes, M.P., et al., 2011, ApJ, 739, L22
- Cannon et al. (2015) Cannon, J.M., Martinkus, C.P., Leisman, L., et al., 2015, AJ, 149, 72
- Carrera et al. (2008) Carrera, R., Gallart, C., et al. 2008, AJ, 135, 836
- Chung et al. (2009) Chung, A., van Gorkom, J.H., Kenney, J.D.P., et al., 2009, AJ, 138, 1742
- Di Teodoro & Fraternali (2015) Di Teodoro, E. M., & Fraternali, F. 2015, MNRAS, 451, 3021
- Donovan Meyer et al. (2015) Donovan Meyer, J., Martini, P., Leroy, A., et al., 2015, ApJ, 808, 136
- Dopita et al. (2016) Dopita, M. A., Kewley, L. J., Sutherland, R. S., & Nicholls, D. C. 2016, Ap&SS, 361, 61
- Eckert et al. (2015) Eckert, K., Kannappan, S.J., Stark, D.V., et al., 2015, ApJ, 810, 166
- Freudling et al. (2013) Freudling, W., Romaniello, M., Bramich, D. M., et al. 2013, A&A, 559, A96
- Galleti et al. (2006) Galleti, S., Federici, L., Bellazzini, M., Buzzoni, A., Fusi Pecci, F., 2006, ApJ, 650, L107
- Grevesse et al. (2007) Grevesse, N., Asplund, M., Sauval, A.J., 2007, Space Sci. Rev., 130, 105
- James et al. (2015) James et al. 2015, MNRAS, 448, 2687
- Hodge & Miller (1995) Hodge, P., Miller, B.W., 1995, ApJ, 451, 176
- Kennicutt (1998) Kennicutt, R.C.Jr, 1998,ARA&A, 36, 186
- Kroupa (2001) Kroupa, P., 2001, MNRAS, 322, 231
- Laher et al. (2012) Laher, R.R., Gorjian, V., Rebull, L.M., et al., 2012, PASP, 124, 737
- Lee et al. (2003) Lee, H., Grebel, E.K., Hodge, P.W., 2003, A&A, 401, 141
- López-Sánchez et al. (2012) López-Sánchez, Á. R., Dopita, M. A., Kewley, L. J., et al. 2012, MNRAS, 426, 2630
- Magrini et al. (2010) Magrini, L., Stanghellini, L., Corbelli, E., et al., 2010, A&A, 512, A63
- Maraston (1998) Maraston, C., 1998, MNRAS, 300, 872
- Marino et al. (2013) Marino, R.A., Rosales-Ortega, F.F., Sánchez, F.F., et al., 2013, A&A, 559, 114 (M13)
- Martin et al. (2007) Martin, N. F., Ibata, R. A., Chapman, et al., 2007, MNRAS, 380, 281
- McConnachie (2012) McConnachie, A.W., 2012, AJ, 144, 4
- Mei et al. (2007) Mei, S., Blakeslee, J.P., Côté, P., et al., 2007, ApJ, 655, 144
- Osterbrock & Ferland (2006) Osterbrock, D. E., & Ferland, G. J. 2006, Astrophysics of gaseous nebulae and active galactic nuclei, 2nd. ed. by D.E. Osterbrock and G.J. Ferland. Sausalito, CA: University Science Books, 2006,
- Pagel et al. (1978) Pagel, B.E.J., Edmunds, M.G., Fosbury, R.A., Webster, B.L., 1978, MNRAS, 184, 569
- Percival et al. (2009) Percival, S.M., Salaris, M., Cassisi, S., Pietrinferni, A., 2009, ApJ, 690, 427
- Pettini & Pagel (2004) Pettini, M., & Pagel, B. E. J. 2004, MNRAS, 348, L59 (PP04)
- Pietrinferni et al. (2004) Pietrinferni, A., Cassisi, S., Salaris, M., Castelli, F., 2004, ApJ, 612, 168
- Pilyugin & Mattsson (2011) Pilyugin, L. S., & Mattsson, L. 2011, MNRAS, 412, 1145
- Salpeter (1955) Salpeter, E.E., 1955, ApJ, 121, 161
- Sand et al. (2015) Sand, D.J., Crnojević, D., Bennet, P., et al., 2015, ApJ, 806, 95
- Saul et al. (2012) Saul, D. R., Peek, J. E. G., Grcevich, J., et al. 2012, ApJ, 758, 44
- Sweet et al. (2014) Sweet, S.M., Drinkwater, M.J., Meurer, G., Bekki, K., 2014, ApJ, 782, 35
- Tollerud et al. (2015) Tollerud, E.J., Geha, M.C., Grchevic, J., et al., 2015, ApJ, 798, L21
- Urban et al. (2011) Urban, O., Werner, N., Simionescu, A., et al., 2011, MNRAS, 414, 2101
- Weilbacher et al. (2012) Weilbacher, P. M., Streicher, O., Urrutia, T., et al. 2012, Proc. SPIE, 8451, 84510B