On significance of VLBI/Gaia position offsets
Abstract
We have cross matched the Gaia Data Release 1 secondary dataset that contains positions of 1.14 billion objects against the most complete to date catalogue of VLBI positions of 11.4 thousand sources, almost exclusively active galactic nuclei. We found 6,064 matches, i.e. 53% radio objects. The median uncertainty of VLBI positions is a factor of 4 smaller than the median uncertainties of their optical counterparts. Our analysis shows that the distribution of normalized arc lengths significantly deviates from Rayleigh shape with an excess of objects with small normalized arc lengths and with a number of outliers. We found that 6% matches have radio optical offsets significant at 99% confidence level. Therefore, we conclude there exists a population of objects with genuine offsets between centroids of radio and optical emission.
keywords:
galaxies: active – radio continuum: galaxies – astrometry: reference systems1 Introduction
The secondary dataset of the first release of astrometric data from the European Space Agency mission Gaia contains positions of 1.14 billion objects (Lindegren et al., 2016). Of them, the vast majority are stars, though over one hundred thousands of extragalactic objects, namely active galactic nuclei (AGN), were also included in the catalogue. The position uncertainty of the Gaia DR1 secondary dataset, 2.3 mas median, is two orders of magnitude higher than the uncertainty of previous large all-sky catalogue in optical wavelengths NOMAD (Zacharias et al., 2004) of 1.17 billion objects. The only technique that can determine positions of target sources with comparable accuracy is very long baseline interferometry (VLBI). The first insight on comparison of Gaia and VLBI position catalogues can be found in Mignard et al. (2016), who found that the overall agreement between the optical and radio positions is excellent, though a small number of sources (%) show significant offsets.
In this letter we make our own comparison of Gaia and VLBI positions beyond that reported in Mignard et al. (2016). Several factors motivated us. Firstly, the authors of the cited paper ran their comparison against the auxiliary Gaia quasar solution for some 135,000 quasars. This solution is not yet published in full, and only positions of 2% of the objects were reported. The question of how results of the comparison against this auxiliary solution are representative to the main solution of one billion objects remained opened.
Secondly, Mignard et al. (2016) used the ICRF2 catalogue (Fey et al., 2015) for their comparison. This catalogue assembled in 2008–2009 represented the state of the art by 2008 and comprised of sources observed in geodetic programs (Ma et al., 1998; Petrov et al., 2009) and six Very Long Baseline Array (VLBA) Calibrator Surveys (Beasley et al., 2002; Fomalont et al., 2003; Petrov et al., 2005, 2006; Kovalev et al., 2007; Petrov et al., 2008). Since that, there was an explosive growth of absolute astrometry VLBI programs: VLBA and European VLBI network Galactic plane surveys (Petrov et al., 2011a; Petrov, 2012); VLBA Imaging and Polarimetry Survey (VIPS) (Petrov & Taylor, 2011); Australian Long Baseline Calibrator Survey (LCS) (Petrov et al., 2011b); the VLBA Calibrator Search for the BeSSel Survey (Immer et al., 2011); the VLBA survey of bright 2MASS galaxies (V2M) (Condon et al., 2016); the VLBA+EVN survey of optically bright extragalactic radio sources (OBRS–1,OBRS–2) (Petrov, 2011, 2013); the second epoch VLBA calibrator survey observations (VCS-ii), (Gordon et al., 2016). Besides, there is a number of ongoing surveys: the VLBI Ecliptic Plane Survey (VEPS) (Shu et al., 2016), the wide-band VCS7,VCS8,VCS9 surveys (Petrov, 2016), and the VLBI survey of Fermi detected -ray sources (Schinzel et al., 2015). By September 14, 2016, the date of Gaia DR1 release, the total number of sources with positions determined with absolute astrometry using VLBI reached 11,444, a factor of 3.5 increase with respect to the ICRF2.
Thirdly, the analysis of Mignard et al. (2016) showed that there exist sources with significant radio-optical offsets. Early comparisons of source positions from VLBI and ground optical observations prompted Zacharias & Zacharias (2014) and Orosz & Frey (2013) to surmise there is a population of radio optical offset objects with position differences in a range of 10–100 mas. Large offsets can occur either due to unaccounted errors in optical positions or a gross oversight in deriving VLBI coordinates, or due to an offset between the centroids of radio and optic emission. We call latter objects genuine radio optical offset (thereafter, GROO) sources. An increase in the accuracy of the optical positions by two orders magnitude allows us to re-examine the question of the GROO population existence. If such a population exists, it poses a challenge to explain significant radio-optical offsets.
2 Association of VLBI and Gaia objects
Our study is based on the analysis of the catalogue called Gaia DR1 secondary dataset. We used for our work positions, their uncertainties, correlations between right ascension and declination for 1,142,679,769 objects. We did not analyze Gaia data and took the catalogue as it is. On the other hand, we reprocessed all publicly available VLBI data listed in the previous section from the level of visibilities using VLBI data analysis software 111See http://astrogeo.org/pima. Detailed description of the analysis strategy and comparison with the methods adopted in the past and those used for processing the data can be found in Petrov et al. (2011a). An important conclusion of that comparison was that it does not introduce systematic differences at least above the 0.2 mas level with respect to the old processing pipeline. The specific VLBI catalogue used in our study is rfc_2016c222Available online at http://astrogeo.org/rfc. It is based on all geodesy and absolute astrometry VLBI data since April 1980 through July 2016, including all observations used for deriving the ICRF2 catalogue and those that became publicly available since 2008.
At the first step we identified all Gaia sources that lie within of VLBI objects and found 6954 preliminary matches. We should note the source density of Gaia DR1 is substantially heterogeneous (see Figure 9 in Lindegren et al. 2016): the density in the Galactic plane exceeds by two order of magnitude the density near the Galactic poles. To take into account variations of Gaia spatial source density, we counted Gaia sources on the regular grid and normalized the count to the number of sources per steradian. Then for a given match we computed the probability of false association (PFA) as the product of local Gaia source density and the area where ), is the arc length VLBI/Gaia, and are semi-major error ellipse axes for Gaia and VLBI respectively. This conservative estimate of the PFA takes into account possible errors that affect and represents rather its upper limit. The total number of matches with the PFA less than is 6064. Of them, 9 are radio stars. We have excluded them from further analysis. According to the selected PFA cutoff criterion, the mathematical expectation of the number of spurious matches within our conservative sample is 0.03, i.e. less than one object. We certainly missed some real matches, but for the purpose of this letter it is more important to prevent false matches in the sample.
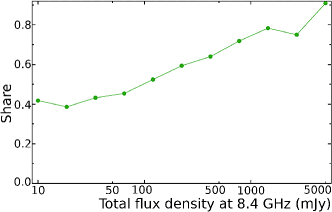
In total, 53% VLBI sources are associated with a Gaia counterpart. The fraction of VLBI/Gaia matches monotonically decreases with a decrease of radio flux density: from 0.8 for sources with flux density Jy at 8 GHz to 0.4 for sources with flux density in range of 10–40 mJy — see Figure 1. At the same time, the diagram flux density versus G magnitude does not show any correlation. Since according to Lindegren et al. (2016), the Gaia DR1 is not complete in any sense, we defer analysis why the share of VLBI/Gaia matches drops with a decrease of flux density till deep optical surveys, such as Pan-STARRS that is expected to be complete at least to 23 mag, will become available.
3 Analysis of VLBI/Gaia arc lengths
We computed the normalized arc lengths between VLBI positions from rfc_2016c solution and the Gaia auxiliary quasar solution. We normalize the arc lengths exactly the same way as Mignard et al. (2016):
where are VLBI/Gaia offsets in right ascension multiplied by factor and declination, and are reported uncertainty in right ascensions (including the factor ) of Gaia and VLBI positions respectively, and , are reported uncertainties in declinations.
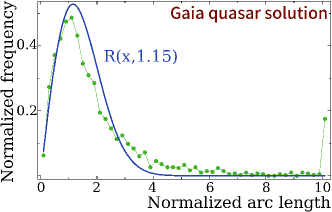
The distribution of normalized arc lengths, square root of of that sub-sample denoted as QS is shown in the left part of Figure 2. The distribution is very close to that shown in Figure 8 of Mignard et al. (2016) based on analysis of the auxiliary Gaia quasar solution and the ICRF2 catalogue. The blue line in the left part of Figure 2 shows the Rayleigh distribution333If position errors over each coordinate obey the Gaussian distribution, then the normalized arc lengths obey the Rayleigh distribution. with that fit best to the histogram that again is very close to the value 1.11 reported by Mignard et al. (2016). This confirms our previous assertion that the differences in positions of sources common for the ICRF2 and rfc_2016c catalogues are not essential for the present study.
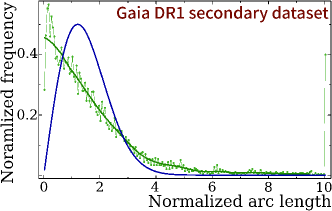
However, the distribution of normalized arc lengths between positions from the Gaia DR1 secondary solution and VLBI is remarkably different (right part of Figure 2). It is definitely very far from the Rayleigh distribution.
The normalized arc lengths depend on both arc lengths and uncertainties in Gaia and VLBI position estimates. Figure 3 demonstrate that the Gaia position errors dominate over VLBI positions in normalized arc lengths. In particular, the median of the matches is 0.50 mas, while the median is 2.15 mas (compare with 2.3 mas for the total Gaia DR1 sample), i.e. a factor of four greater. The shape of the distribution remains non-Rayleighian even when we preform analysis of Gaia DR1 and VLBI rfc_2016c solutions among 2088 matches of the QS sample. Therefore, we conclude the shape of the distribution is due to a peculiarity of the Gaia DR1 secondary solution errors that did not affect strongly the Gaia quasar auxiliary solution.
It is important to note that proper motions and parallaxes were estimated in the Gaia secondary solution. Since the time span of the dataset used in producing the Gaia DR1 solution, 14 months, in general is not sufficient for providing good estimates of parallax and proper motions, constraints were applied. The reciprocal weights of constraints were adjusted to make realistic errors of positions and parallaxes of stars (Michalik et al., 2015) that do have proper motions and parallaxes. This disfavored treatment of AGNs that have negligible parallaxes and proper motion. Estimating proper motions and parallaxes in addition to positions of AGNs inflated their formal uncertainties. See Michalik et al. (2015) for further details.
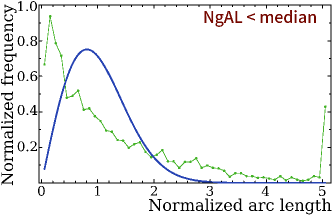
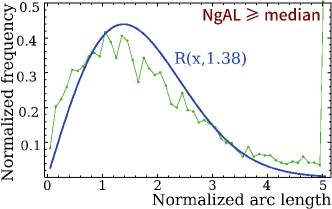
In order to check this hypothesis, we examined the parameter called the number of good observations along scan direction (NgAL) provided in the Gaia catalogue. NgAL varies from 2 to 1875 among the matches with the median value of 80. This parameter is proportional to the number of view crossings. We split the sample of matches into two equal sub-samples with NgAL below and above the median. The distributions among these sub-samples are indeed very different (Figure 4). The distribution in the sub-sample with NgAL median fits reasonably well to the Rayleigh distribution with , but the sub-sample with NgAL median does not. This confirms our conjecture that estimation of parallaxes and proper motions is responsible for inflation of the reported uncertainties.
We sought for a simple smooth function close to the Rayleigh distribution that can approximate the empirical distribution of normalized arc lengths. Our further analysis showed that the distribution has different shape for small and large Gaia position uncertainties. We found that the distribution of normalized arc lengths of the sub-samples with Gaia semi-major error axes shorter and longer 5 mas can be represented as the Rayleigh distribution after applying the power law transformation with different power and scale parameters. The Table 1 shows parameters of the transformation and Figure 5 illustrates the distributions of two sub-samples after the power law transformation and their best fit to the Rayleigh distributions.
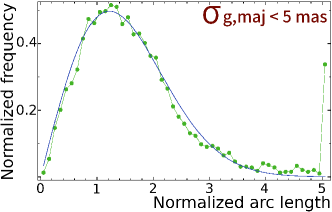
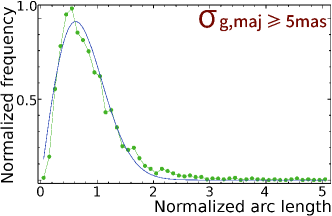
| Range | rms | ||
|---|---|---|---|
| mas | 0.829 | 1.220 | 0.017 |
| mas | 0.465 | 0.622 | 0.158 |
We split the matches into the bulk subset which distribution obeys the the power-law Rayleigh functions and a subset of matches with the probability to belong to the bulk subset below some threshold, i.e. outliers. We consider the offsets from the bulk subset are due to the random noise.
Since the probability for the Rayleigh distribution, we compute the probability for a given source to have the normalized power-law scaled arc length equal or greater than a given value due to the random noise as , where and are parameters from Table 1.
4 Sources with statistically significant offsets
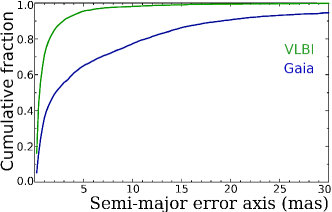
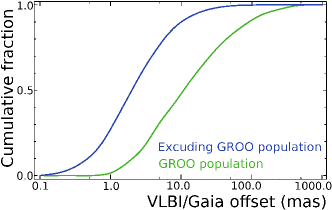
We consider an offset between VLBI and Gaia positions statistically significant if both the PFA is less than 0.0002 and the probability that the position offset is caused by the random noise (RNP) is less than 0.01. There are 384 matches (6%) that satisfy these criteria. See their cumulative distribution in Figure 6. Table 2 shows these sources. Table 3 with remaining 5671 matches with PFA and RNP is given in the electronic attachment only. It should be noted the share of outliers among matches with the Gaia DR1 solution is very close to the share of outliers with the Gaia auxiliary quasar solution (also 6%).
| VLBI ID | Gaia ID | PFA | RNP | q | (mas) | (mas) |
|---|---|---|---|---|---|---|
| RFC J00003221 | Gaia 2314315845817748992 | 20.78 | -6.51 | -0.83 | ||
| RFC J00040802 | Gaia 2441584492826114432 | 4.73 | -21.39 | -14.39 | ||
| RFC J00053820 | Gaia 2880735411259458048 | 10.80 | 5.77 | -3.43 | ||
| RFC J00082339 | Gaia 2337107759788510464 | 8.84 | 1.17 | -3.88 | ||
| … |
A number of reasons may result in statistically significant offsets: a) errors in Gaia positions; b) errors in VLBI positions; c) genuine radio optic offset (GROO). We will consider both Gaia and VLBI errors that led to significant offsets as failures of quality control rather than random errors. We investigated which objects are more common among the sources with statistically significant offsets and found three groups: 1) sources with mas (a factor of 1.9 more common); 2) sources brighter 17 mag (a factor of 2.7); and 3) sources with mas (a factor of 1.6). The dominance of sources with position uncertainties greater 5 mas indicates a possible failure of the quality control of VLBI data analysis for some sources in that group. Position uncertainties greater than 5 mas are usually obtained when a source was close to the detection limit and too few observations were collected. The weaker the signal to noise ratio, the more chances that a wrong maximum in the delay resolution function will be selected. Errors in group delay that correspond to the wrong maximum are significantly greater than their formal uncertainty computed assuming a correct maximum was found. The fewer observations, the more chances that a failure in fringe fitting will remain undetected. During past iterations of VLBI data analysis, a number of group delay estimates that correspond to an incorrect maximum in the delay resolution function were identified and fixed, which resulted in a change of source coordinate estimates. It is conceivable that not all such observations have been identified and eliminated. But such oversights in quality control affects noticeably only positions of sources with too few observations, usually less than 20. The share of sources with 40 or less VLBI observations is 36% among the objects with statistically significant offsets. That means that more than 2/3 matches with significant offsets cannot be affected by oversights in VLBI quality control.
A greater share of optically bright sources with small Gaia position errors favours a hypothesis that at least a part of objects with significant radio optic offsets are GROO: smaller position uncertainties make position offsets statistically more significant if they are real.
Analysis of the group of sources with statistically significant offsets revealed there several gravitation lenses and a number of optically bright galaxies, but did not show any outstanding features that singles out these objects. The evidence collected so far supports the presence of the GROO population since observed significant radio/optic offsets cannot be explained only by failures in quality control. In order to explain the phenomenon of GROO, additional information should be examined. Kovalev et al. (2016) investigated a connection between directions of AGN jets and offset directions. More studies focused on explanation of the GROO population are anticipated in the future.
5 Summary
We explored offsets between Gaia DR1 and VLBI positions. We used the secondary dataset for optical positions and recent VLBI solution rfc_2016c based on analysis of all available observations suitable for absolute astrometry collected since 1980 through July 2016. We have found 6055 matched AGNs using the criterion set on their arc lengths, such that the mathematical expectation of the number of spurious matches in this sample is less than one object. When we used the Gaia auxiliary quasar solution, we were able to reproduce closely results of Mignard et al. (2016).
Comparison of Gaia DR1 and VLBI solutions revealed the following.
-
•
The median position offset is 2.2 mas — very close to the median semi-major axis of the error ellipse of Gaia positions in the entire dataset.
-
•
The median semi-major axis of the error ellipse of Gaia positions among the matches, 2.1 mas, is a factor of 4 greater than the median semi-major axis of the error ellipse of VLBI positions.
-
•
The distribution of normalized arc lengths is significantly non-Rayleighian. We found evidence that the analysis strategy implemented in Gaia DR1 disfavored sources with negligible parallaxes and proper motions, which inflated their uncertainties.
-
•
There exits a population of sources with offsets statistically significant at the 99% confidence level (6% of the matches). We admit that some these objects may have statistically significant offset due to failures in quality control in both VLBI and Gaia but certainly, not all: at maximum 1/3. An increased share of optically bright objects with small position uncertainties in this population suggests that some these objects have genuine radio optical offsets (GROO).
The emission center in optic and in radio may not always coincide for a number of reasons. Firstly, the centroid of the core may be shifted with frequency (e.g., Lobanov, 1998; Kovalev et al., 2008). Secondly, unaccounted radio structure may cause an offset of the reference point with respect to the jet base, although such a shift is usually below 1 mas. Thirdly, as Condon et al. (2016) shown, there exist interacting galaxies within an optically weaker component hosting a bright radio source. In the era of ground optical astrometry, a study of such objects was limited to pairs at least apart. Gaia astrometry has a potential to find such objects separated at milliarcsecond level. Finally, the presence of bright components along the jet may shift the optic centroid. At the moment, little is known about properties of jets at milliarcsecond scales in optic wavelengths. Investigation of the GROO population opens a new window into study of AGNs.
We should stress that this analysis is based on Gaia DR1 secondary dataset and we expect statistics of comparison VLBI positions and future Gaia releases will be significantly different because of anticipated changes in data analysis strategy of Gaia observations.
Acknowledgments
It is our pleasure to thank Alexey Butkevich, Sergei Klioner, Alexandr Plavin, and Eduardo Ros for fruitful discussions. We are very grateful to Lennart Lindegren for a detailed referee report and suggestions that helped us greatly to improve the manuscript and fix an error in numerical tables. This work is supported by the Russian Science Foundation grant 16–12–10481.
References
- Beasley et al. (2002) Beasley A. J., Gordon D., Peck A. B., Petrov L., MacMillan D. S., Fomalont E. B., Ma C., 2002, ApJS, 141, 13
- Condon et al. (2016) Condon J. J., Darling J., Kovalev Y. Y., Petrov L., 2016, preprint (arXiv:1606.04067)
- Fey et al. (2015) Fey A. L., et al., 2015, AJ, 150, 58
- Fomalont et al. (2003) Fomalont E. B., Petrov L., MacMillan D. S., Gordon D., Ma C., 2003, AJ, 126, 2562
- Gordon et al. (2016) Gordon D., et al., 2016, AJ, 151, 154
- Immer et al. (2011) Immer K., et al., 2011, ApJS, 194, 25
- Kovalev et al. (2007) Kovalev Y. Y., Petrov L., Fomalont E. B., Gordon D., 2007, AJ, 133, 1236
- Kovalev et al. (2008) Kovalev Y. Y., Lobanov A. P., Pushkarev A. B., Zensus J. A., 2008, A&A, 483, 759
- Kovalev et al. (2016) Kovalev Y. Y., Petrov L., Plavin A. V., 2016, A&A Letters, in press (arXiv:1611.02632)
- Lindegren et al. (2016) Lindegren L., et al., 2016, A&A, 595, A4
- Lobanov (1998) Lobanov A., 1998, A&A, 330, A79
- Ma et al. (1998) Ma C., et al., 1998, AJ, 116, 516
- Michalik et al. (2015) Michalik D., Lindegren L., Hobbs D., Butkevich A. G., 2015, A&A, 583, A68
- Mignard et al. (2016) Mignard F., et al., 2016, A&A, 595, A5
- Orosz & Frey (2013) Orosz G., Frey S., 2013, A&A, 553, A13
- Petrov (2011) Petrov L., 2011, AJ, 142, 105
- Petrov (2012) Petrov L., 2012, MNRAS, 419, 1097
- Petrov (2013) Petrov L., 2013, AJ, 146, 5
- Petrov (2016) Petrov L., 2016, preprint (arXiv:1610.04951)
- Petrov & Taylor (2011) Petrov L., Taylor G. B., 2011, AJ, 142, 89
- Petrov et al. (2005) Petrov L., Kovalev Y. Y., Fomalont E. B., Gordon D., 2005, AJ, 129, 1163
- Petrov et al. (2006) Petrov L., Kovalev Y. Y., Fomalont E. B., Gordon D., 2006, AJ, 131, 1872
- Petrov et al. (2008) Petrov L., Kovalev Y. Y., Fomalont E. B., Gordon D., 2008, AJ, 136, 580
- Petrov et al. (2009) Petrov L., Gordon D., Gipson J., MacMillan D., Ma C., Fomalont E., Walker R. C., Carabajal C., 2009, Journal of Geodesy, 83, 859
- Petrov et al. (2011a) Petrov L., Kovalev Y. Y., Fomalont E. B., Gordon D., 2011a, AJ, 142, 35
- Petrov et al. (2011b) Petrov L., Phillips C., Bertarini A., Murphy T., Sadler E. M., 2011b, MNRAS, 414, 2528
- Schinzel et al. (2015) Schinzel F. K., Petrov L., Taylor G. B., Mahony E. K., Edwards P. G., Kovalev Y. Y., 2015, ApJS, 217, 4
- Shu et al. (2016) Shu F., Petrov L., Jiang W., McCallum J., Yi S.-O., Takefuji K., Li J., Lovell J., 2016, preprint (arXiv:1605.07036)
- Zacharias & Zacharias (2014) Zacharias N., Zacharias M. I., 2014, AJ, 147, 95
- Zacharias et al. (2004) Zacharias N., Monet D. G., Levine S. E., Urban S. E., Gaume R., Wycoff G. L., 2004, in AAS Meeting Abstracts. p. 1418