Diffusion and Clustering of Carbon Dioxide on non-porous Amorphous Solid Water
Abstract
Observations by ISO and Spitzer towards young stellar objects (YSOs) showed that CO2 segregates in the icy mantles covering dust grains. Thermal processing of ice mixture was proposed as responsible for the segregation. Although several laboratory studied thermally induced segregation, a satisfying quantification is still missing. We propose that the diffusion of CO2 along pores inside water ice is the key to quantify segregation. We combined Temperature Programmed Desorption (TPD) and Reflection Absorption InfraRed Spectroscopy (RAIRS) to study how CO2 molecules interact on a non-porous amorphous solid water (np-ASW) surface. We found that CO2 diffuses significantly on a np-ASW surface above 65 K and clusters are formed at well below one monolayer. A simple rate equation simulation finds that the diffusion energy barrier of CO2 on np-ASW is 215050 K, assuming a diffusion pre-exponential factor of 1012 s-1. This energy should also apply to the diffusion of CO2 on wall of pores. The binding energy of CO2 from CO2 clusters and CO2 from H2O ice have been found to be and K, respectively, assuming the same prefactor for desorption. CO2-CO2 interaction is stronger than CO2-H2O interaction, in agreement with the experimental finding that CO2 does not wet np-ASW surface. For comparison, we carried out similar experiments with CO on np-ASW, and found that the CO-CO interaction is always weaker than CO-H2O. As a result, CO wets np-ASW surface. This study should be of help to uncover the thermal history of CO2 on the icy mantles of dust grains.
1 Introduction
CO2 constitutes a significant fraction of ices coating dust grains in interstellar clouds, with CO2 abundance ranging between 15% and 40%. Other major ice components include water, the most abundant, and CO and CH3OH (Pontoppidan et al., 2008; Boogert et al., 2015). Through observations of solid state of CO2 and CO IR features a picture of the state and history of the cloud (Nummelin et al., 2001; Whittet et al., 1998, 2007, 2009; Boogert et al., 2015; Cook et al., 2011) can be obtained. By analyzing the double-peak feature of CO2 bending mode at 660 cm-1, CO2 in the pure form has been found by ISO (Gerakines et al., 1999) and Spitzer (Pontoppidan et al., 2008) towards young stellar objects (YSOs). The fact that this double-peak feature is only observed toward regions where the protostar has already “turned on” (see Öberg et al. (2009); Pontoppidan et al. (2008); Boogert et al. (2015) and references therein) suggests that the segregation of CO2 is induced by thermal processing of the ice mixture. To explain these observations and characterize the segregation of CO2 in ices, the following three mechanisms are possible: (a) collapse of the porous ice structure that causes CO2 molecules to move and get trapped in pockets of high CO2 concentration; (b) penetration of CO2 molecules through bulk non-porous amorphous solid water ice (np-ASW) by diffusion; (c) diffusion of CO2 along the wall of pore surfaces. The first one requires highly porous structure and relatively high concentration of CO2 with respect to water, a scenario not yet confirmed by observations (Keane et al., 2001). The second one requires a low energy barrier for diffusion in the bulk, but experiments show otherwise (Öberg et al., 2009; Mispelaer et al., 2013). The third one — diffusion along the surfaces of the walls of ice — is the most probable mechanism for CO2 segregation, and is the focus of this study.
There have been several laboratory works that studied mid-IR features of CO2, i.e., the bending mode at 660 cm-1 and the asymmetric stretch band at 2340 cm-1 and near-IR overtones and combination bands (Ehrenfreund et al., 1998; Dartois et al., 1999; Baratta et al., 2000; Palumbo & Baratta, 2000; Bernstein et al., 2005; Hodyss et al., 2008; Öberg et al., 2009; Isokoski et al., 2014). Studies of CO2:H2O binary and CO2:H2O:CH3OH ternary ices have found that segregation becomes significant above 50–60 K and up to 85 K (Ehrenfreund et al., 1998; Palumbo & Baratta, 2000; Bernstein et al., 2005; Hodyss et al., 2008), although quantitative values so obtained differ among these measurements (these temperature values refer to laboratory experimental conditions; in space they would be lower, see below). Palumbo & Baratta (2000) studied the dependence of the mixing ratio CO2:H2O on segregation, and found that below 10% CO2 in H2O there is no segregation of CO2. Öberg et al. (2009) did a comprehensive study of segregation in binary mixtures (CO2:H2O); they found a thickness as well as a composition dependence. Coupling data with a Monte Carlo simulation, they reported an energy barrier of 1080 190 K for segregation of CO2 at the surface of the ice. Isokoski et al. (2014) studied segregation of CO2 in H2O using the combination bands at 3704 cm-1 and at 3597 cm-1 which are sensitive to the local environment (Keane et al., 2001). Their study, which explored the influence of morphology of the ice, showed that high porosity facilitates CO2 segregation. Indeed this and other studies suggest the link between diffusion of CO2 molecules on the surface of ice and segregation. The work presented here addresses this issue in a quantitative way.
Surface diffusion of CO2 on ice (whether on pores or at the interface between the ice surface and vacuum) is much faster than through ice (Öberg et al., 2009); thus, recent studies were concentrated on studying diffusion and aggregation on the surface of water ice. Ghesquière et al. (2015) studied in the laboratory the diffusion of CO2 through compact ASW, but in the experiments the ice was deposited at 80 K, which may not be high enough to be truly compact. On the contrary, our laboratory measurements show no evidence of CO2 penetration into np-ASW deposited at 130 K. Another important factor for the formation of CO2 clusters is the binding energy of CO2 from CO2 clusters and CO2 from water ice surface. Clusters can be formed only when the binding energy of CO2 from CO2 clusters is stronger than that of CO2 from water ice surface. To study the binding energies, Noble et al. (2012) used temperature programmed desorption (TPD) to measure the TPD of CO2 on a np-ASW surface down to 0.5 monolayer (ML) coverage; based on the argument that CO2 interaction energy with the water ice surface is stronger than the interaction energy at monolayer coverage, they argued for non-wetting. However, the measurement at 0.5 ML coverage is not low enough to study the onset of segregation or cluster formation (see below); therefore the behavior of CO2 at lower coverages is unknown. Karssemeijer et al. (2014) used molecular dynamics simulation with a new ab initio calculation of the interaction energy of CO2-H2O and CO2-CO2 in the gas phase and on water ice. They found that in the gas phase the CO2-H2O interaction strength is twice as the CO2-CO2, while in the solid state the difference between them is much smaller. The result of their molecular dynamics simulations found no indication of island formation or clustering during deposition of CO2 on water ice. Because the simulation occurs on time scales orders of magnitude faster than an actual deposition, some caution should be exercised in applying these results.
To resolve this issue and obtain information of how CO2 molecules diffuse on water ice, as well as the binding energies, we used a combination of TPD and RAIRS techniques to study systematically the interaction of CO2 with np-ASW. For comparison purposes, some of the experiments were also done with CO. We explored both the temperature and coverage dependence of CO2 clustering on np-ASW, and found how the diffusion rate determines the clustering of CO2. An estimate of the energy barrier to diffusion of CO2 molecules on water ice is also obtained. Technical improvements allowed us to study the CO2-H2O system down to % ML coverage of CO2. This is an important step that allows us to better approximate the conditions of the experiment to the conditions in the ISM. By choosing a np-ASW ice, we single out the interaction between CO2 and the surface of water, and we avoid the complication of the structural changes of porous ice and of the trapping of CO2 in pores that affect the segregation rate. However, our results should be translatable to more porous ice surfaces.
2 Experimental Setup
Experiments were carried out in an ultra-high vacuum (UHV) chamber connected to two molecular beam lines. The pressure in the UHV chamber reaches torr after bake-out. Ices are grown on a gold coated copper disk located at the center of the UHV chamber. The sample disk can be cooled by liquid helium to K and heated up to 450 K by a resistive heater. The temperature of the sample disk was measured by a calibrated silicon diode (Lakeshore DT 670) and controlled by a Lakeshore 336 temperature controller with an uncertainty of less than 50 mK. A Hiden Analytical quadrupole mass spectrometer (QMS) was mounted on a rotatable flange that can be used to measure the intensity of the incoming molecular beam or the molecules desorbing from the sample in Temperature Programmed Desorption (TPD) experiments. A Nicolet 6700 Fourier Transform Infrared (FTIR) spectrometer in Reflection Absorption InfraRed Spectroscopy (RAIRS) setup was used to monitor ices grown on the substrate. The infrared beam was focused by an off-axis paraboloidal mirror before entering the chamber through a differentially pumped KBr window. It is then reflected from the sample at incidence angle and exits the chamber through another KBr window,; it is then focused by an off-axis ellipsoidal mirror before entering a MCT-B detector with a working range from 650 to 4000 cm-1. For experiments carried out in this work, the highest resolution 1 cm-1 was used. Spectra were collected by averaging 22–23 scans every 30 seconds.
Water ice was grown by vapor deposition from the background using a capillary array (He et al., 2016a). The capillary array is facing empty space in the chamber for background deposition onto the substrate. A nude ionization pressure gauge was used to monitor the pressure in the chamber. We assume that during background deposition, the pressure readout from the pressure gauge is the same as that close to the substrate. Distilled water was used for water deposition. It went through at least three freeze-pump-thaw cycles before being introduced into the chamber. In this work we mostly use non-porous amorphous solid water (np-ASW), which was grown by background deposition of water vapor when the substrate was at 130 K. After deposition, the ice remained at 130 K for 20 minutes to stabilize the ice structure before cooling down for further experiments. CO2 ice was grown either by deposition from the molecular beam or by background deposition from the capillary array. The thickness of CO2 ice grown from background deposition was calculated by integrating the chamber pressure over time. The ion gauge correction for different gases was taken into account. The recording of the pressure in the chamber and the calculation of the thickness (in Langmuir) in real time were handled by a LabVIEW program. This ensures that the thickness of deposition can be controlled accurately within an uncertainty of 3%. Unity sticking is assumed for all of the experiments in this work, and this is supported by previous sticking measurement by our group (He et al., 2016b). At room temperature (294 K), 1 Langmuir (1L= torrs) of H2O, CO, and CO2 amounts to , , and molecules cm-2, respectively — see the Appendix for details. The column density of CO2 in units of L can be converted to thickness as 1 L=1.9Å, assuming a CO2 density of 1.28 gcm-3 (Gerakines & Hudson, 2015). From CO TPD spectra in Section 3 we show that 1 L of CO corresponds to about 1 monolayer (ML) coverage on np-ASW. We assume that the number of CO2 molecules in 1 ML coverage is the same as that of CO, and in the remaining part of this work we use L and ML interchangeably for both CO2 and CO.
Details of the molecular beam can be found in a previous publication (He et al., 2016b). The deposition rate from the beam was controlled by an Alicat MCS-5 mass flow controller with a relative uncertainty of less than 1%. The beam deposition time was automated using a computer controlled flag with an accuracy down to 50 ms. The molecular beam is at with respect to surface normal, and covers most of the sample surface area, which is 1 cm2. Because the infrared beam does not overlap perfectly with the molecular beam on the sample, the calibration of thickness needs special attention. Usually the ice thickness can be calculated by integrating the absorption of a known absorption band and comparing it with the absorption intensity found in the literature. But this method does not apply here, because the molecular beam covers a smaller area than the infrared beam. We instead compared the infrared spectrum of CO2 from beam deposition and from background deposition on annealed water ice to calibrate the beam deposition rate/beam flux. More details of the calibration is in the Appendix.
3 Results and Analysis
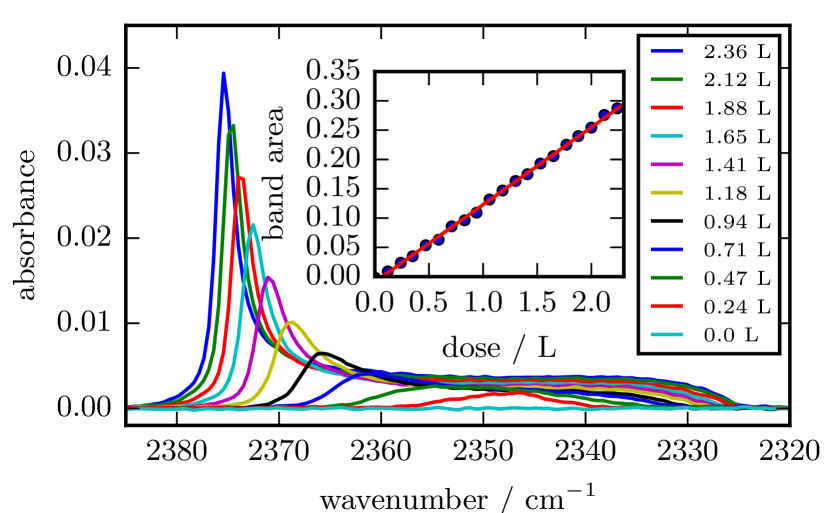
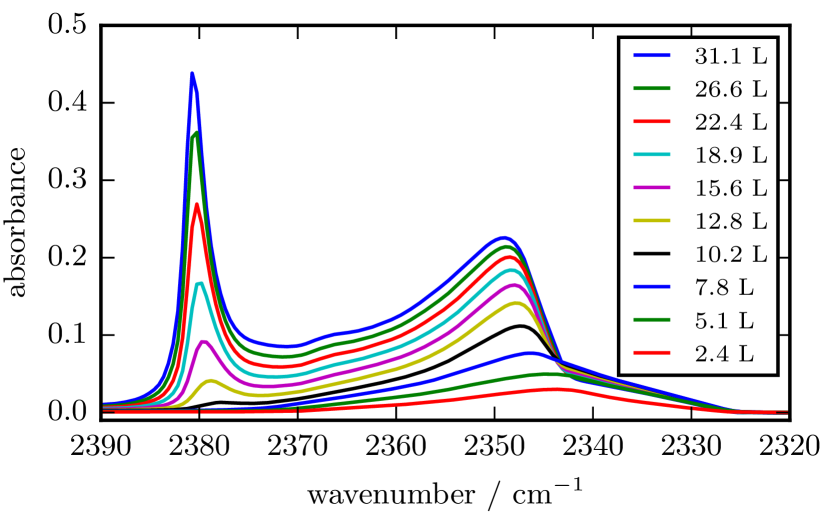
In the first experiment, CO2 was deposited from the beam onto the np-ASW ice at 10 K. Infrared spectra were recorded during deposition, see Figure 1. At very low dose, CO2 molecules are isolated on the surface and interact primarily with the water surface, as indicated by the asymmetrical stretch absorption peak at 2347 cm-1. As the CO2 concentration increases, CO2 molecules interact primarily among themselves in clusters. In the RAIRS geometry of absorption and reflection at glancing angle, solid state CO2 aggregates are characterized by a peak at 2380 cm-1 (Escribano et al., 2013; Edridge et al., 2013) due to the LO phonon mode (Berreman, 1963). Also shown in Figure 1 is the integrated area of band, which is linear with deposition dose, regardless of the peak shape and position.
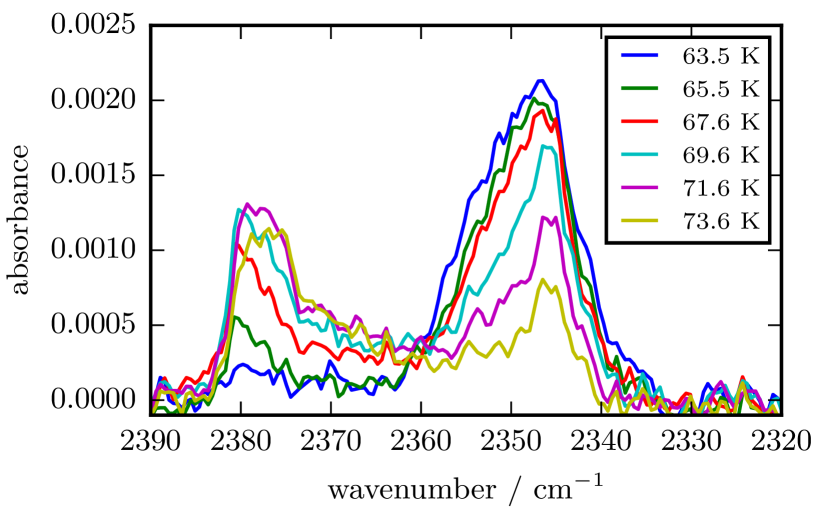
In the second experiment, 0.23 L of CO2 was deposited from the beam at a rate of 0.35 Lminute-1 on np-ASW surface at 10 K, and it was followed by a linear increase of the temperature at 2 Kminute-1. Figure 2 shows the spectra of band during heating. Compared with Öberg et al. (2009)’s and Noble et al. (2012)’s work, we focus on a much lower surface coverage of CO2 in order to find the temperature at which CO2 starts to diffuse on the surface. At low temperature and low surface coverage, the isolated CO2 molecules have an absorption band at around 2347 cm-1. As the sample is heated to 65 K, the band at 2347 cm-1 decreases and another band emerges at 2380 cm-1, which is associated with aggregated CO2. This indicates that at 65 K, the diffusion rate of CO2 on np-ASW becomes significant and CO2 molecules are able to move around and form clusters. The IR spectrum therefore shows a decrease in the band of CO2-water interaction and an increase in the one of CO2-CO2 interaction. From this experiment we found that in the laboratory time scale, the ice temperature needs to be close to or higher than 65 K for CO2 segregation/clustering to happen.
Clustering behavior of CO2 also depends on surface coverage. The more CO2 is on the surface, the easier is to form clusters. At a given temperature, there exists a threshold coverage above which CO2 forms clusters. We carried out the following experiment to find out the clustering threshold at 65 K. With np-ASW at 65 K we deposited CO2 continuously at a rate of 0.035 Lminute-1 and monitored the IR spectrum. At this surface temperature CO2 should be mostly mobile. Figure 3 shows that there is only one peak at 2347 cm-1 below 0.17 L, while at and above 0.17 L the peak at 2380 cm-1 begins to emerge. Therefore 0.17 L is the clustering threshold at 65 K. The existence of a coverage threshold for clustering is consistent with Palumbo & Baratta (2000), which found a concentration threshold of 10% for clustering. At higher surface temperature, the threshold can be lower.

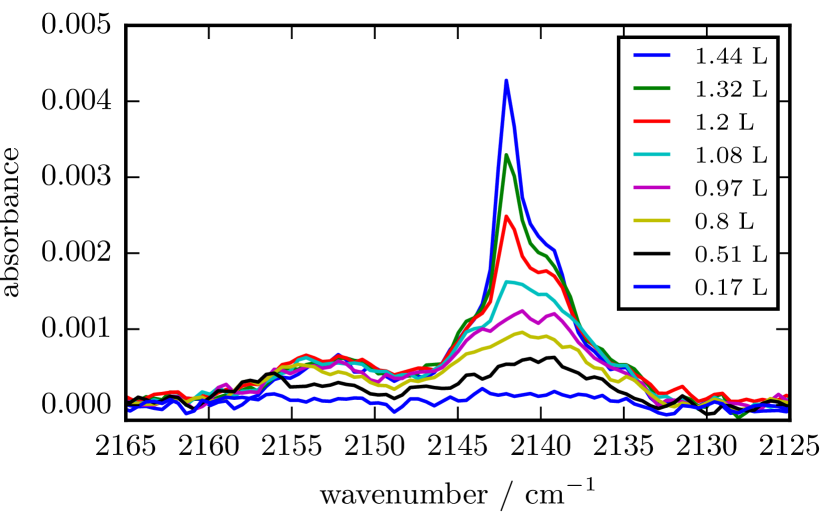
Similar experiments were carried out for CO on np-ASW. Lauck et al. (2015) have already found that the diffusion of CO becomes significant at K. We kept the np-ASW at 22 K, at which the diffusion is fast, while the desorption is still negligible (He et al., 2016a). Based on previous measurement from our group (He et al., 2016b), at 22 K the sticking of CO is unity. CO was deposited continuously from the beam at a rate of 0.035 Lminute-1. The measured IR spectra are shown in Figure 4. Three different absorption bands can be seen in the figure, at 2140 cm-1, 2142 cm-1, and 2152 cm-1. The assignment of these peaks are discussed extensively in Palumbo et al. (2006); Palumbo (2006); Cuppen et al. (2011). At low coverage there are only two peaks at 2140 cm-1 and 2152 cm-1, growing linearly with coverage. The former has been seen towards numerous young stellar objects (Pontoppidan et al., 2003) and is due to the interaction of CO with non-dangling bond sites. The latter is due to CO interacting with dangling-bond (dOH) sites (Al-Halabi et al., 2004). After 0.6 L, the band at 2152 cm-1 saturates while the 2140 cm-1 peak continues to increase linearly until about 1.1 L, at which the peak at 2142 cm-1 due to pure CO (CO in CO environment) emerges. We used two Gaussian distributions to fit the components at 2152 and 2140 cm-1, and one Lorentzian distribution to fit the component at 2142 cm-1 (He et al., 2016). The corresponding areas of these three components are shown in Figure 5.
For CO the critical coverage at which CO in the pure form emerges is at L, which is much higher than that for CO2. Later it will be shown that 1 L corresponds to 1 ML. This suggests that CO completely wets the surface before building up layers. The underlying reason is because the CO-CO interaction is weaker than the CO-water interaction. On the contrary, the CO2-CO2 interaction is stronger than the CO2-water interaction and CO2 forms clusters. This is a well-known case in thin film growth, also called Vollmer-Weber growth. On the other extreme of the adsorbate-adsorbate versus adsorbate-substrate interaction, growth occurs layer-by-layer. This is the so called Frank-van der Merwe growth (e.g. Ratsch & Venables, 2003).

In surface science literature, one of the tools to study the formation of islands or clusters on a surface is TPD. TPD spectra are usually analyzed using the Polanyi-Wigner equation:
| (1) |
where is the desorption pre-exponential factor (or prefactor). In this work we take the widely used value of s-1. is the coverage defined as percentage of a monolayer (ML), i.e., the number of adsorbate particles divided by the number of adsorption sites on the surface, is the order of desorption, is the binding energy, which can depend on coverage, is Boltzmann constant, is the temperature of the surface. For , the desorption rate does not depend on the amount of material on the surface. Thus, this indicates desorption from multilayer films. or close to it applies also in the desorption of clusters of particles on the surface. Zeroth order desorption is recognized by the fact that TPD traces of film with different values of the coverage have overlapping leading edges (Kolasinski, 2008).
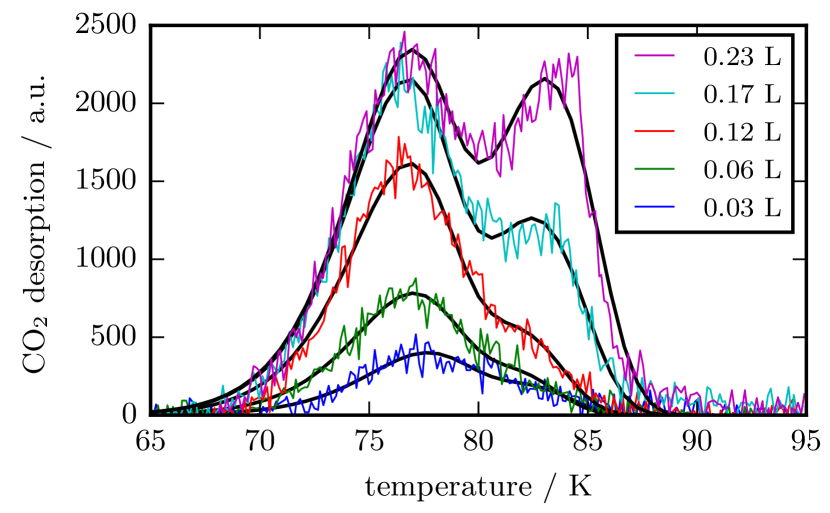
We carried out TPDs of both CO2 and CO on np-ASW, see Figure 6 and 7, respectively. For CO2, 13CO2 was used to obtain higher signal-to-noise ratio. From here on the isotope label is dropped. In the TPD experiments for both CO and CO2, the deposition rate is 0.70 Lminute-1, and the heating ramp rate is 0.5 Ks-1. These TPD spectra of CO2 and CO are similar to our previous measurement (He et al., 2016a), except here the signal-to-noise ratio is better. The CO2 TPDs here are for submonolayer coverage; for higher and multilayer coverage, see He et al. (2016a). In the case of CO on np-ASW at a coverage from zero to 0.7 L, the TPD traces show a similar shape and the peak temperature shifts to lower values with increasing deposition. This translates to a decrease in the binding energy with coverage. Between 0.7 L and 0.87 L, a second peak emerges, but it does not have the characteristics of zeroth order desorption yet, such as a common leading edge. At this point, the interaction of CO is with both H2O and CO. Above 1.05 L, the peak at 30 K is due to the CO-CO interaction, as is evident from the common leading edge, indicating multilayer growth. In the submonolayer regime, trailing edges overlap, which indicates that CO occupies deep adsorption sites before shallow sites. We applied the same direct inversion procedure as in He et al. (2016a) to obtain the desorption energy distribution (not shown); we find that it is close to the distribution reported in He et al. (2016a). The binding energy of CO-CO (870 K) is located at or below the lower boundary of CO-H2O binding energy (870–1600 K). At about 1.05 L zeroth order desorption is observed, which suggests that a multilayer CO is building up. This coincides with the infrared measurements shown in Figure 4. We define 1 ML coverage as the amount of CO molecules that fully covers the surface area on np-ASW, and in the case of CO on np-ASW 1 ML corresponds to moleculescm-2 (see Section 2). This number may also be used for other molecules after taking into account the correction factor for the size of molecules.


In the CO2 TPDs, from 0.01 L to 0.06 L there is only one peak centered at 76 K with small variation with coverage, which indicates first order desorption. At 0.12 L, a second peak at 84 K emerges and continues to grow as coverage increases. This second peak is due to the formation of CO2 clusters. At coverage higher than 0.35 L, the first peak at 76 K begins to drop (see traces at 0.47 L and 0.58 L). This is because at higher coverage, as CO2 cluster formation begins, there is an decreasing number of isolated CO2 molecules and an increasing number of CO2 molecules in clusters. At even higher coverages, the TPD shows features of typical zeroth order desorption (He et al., 2016a).
To obtain CO2-H2O and CO2-CO2 interaction energies, we fitted the low coverage CO2 TPDs in Figure 6 using two first order desorption peaks. Strictly speaking, the second peak due to CO2 desorption from CO2 clusters is not first order. But when the coverage is much lower than the coverage at which zero order desorption is significant, it is a good approximation. We only fit TPDs up to 0.23 L because at higher coverages the fitting is no longer satisfactory. The fitting result is shown in Figure 8. The best fitting energies are K and K for the first peak (CO2-H2O) and second peak (CO2-CO2), respectively. This CO2-H2O interaction energy value is comparable with the value of 2268 K on the same type of ice obtained by Noble et al. (2012). Figure 9 shows the area of the two peaks with coverage. The first peak for discrete CO2 shows saturation after 0.17 L. The second peak for clusters grows slowly at very low coverage and becomes faster when the first peak saturates.

4 Discussion and Astrophysical Implications
Following the observation of pure CO2 in low mass young stellar objects (Pontoppidan et al., 2008), it has been proposed (Gerakines et al., 1999; Pontoppidan et al., 2008) that CO2 could be used as a tracer of the temperature of the ice. Pontoppidan et al. (2008); Ioppolo et al. (2009, 2013) showed there are two ways to explain the aggregation of CO2 in ices; it is either by segregation—which involves diffusion in the ice matrix, or by distillation, that is the sublimation of CO in CO-CO2 mixed layers. Using the data of Ehrenfreund et al. (1999), they came up with an activation energy for segregation of 4900 K. In new IR studies of CO2-water ice mixtures, Öberg et al. (2009) fitted the amount of segregated CO2 as a function of time using an Arrhenius expression, finding an activation energy of 1080190 K and a pre-exponent of for a H2O:CO2=2:1 mixture. The very high concentration of CO2 prevents them to single out the effect of surface diffusion. Our investigation is instead centered on cluster formation at much lower concentration of CO2 in water ice. Therefore, it complements the work of Öberg et al. (2009).
To extract the diffusion energy barrier for a single CO2 molecule on the surface of np-ASW, we developed a simple rate equation model to simulate the formation of clusters. We assume that takes a single value instead of a continuous distribution. We assume that clusters do not diffuse. The rate equation deals only with diffusion and ignores desorption. Consequently, we only attemp to fit K part of the experiment. The diffusion rate is expressed as:
| (2) |
where is the pre-exponential factor for diffusion, which is assumed to be the same as desorption prefactor s-1. This is a reasonable assumption considering that we describe the motion of a single small molecule largely unaffected by the presence of other CO2 molecules. We denote as the coverage of isolated CO2 molecules at time ; this is also the surface density of isolated CO2 molecules divided by the density of adsorption sites. Similarly, the coverage of CO2 clusters with size is denoted by . The total density of CO2 in clusters divided by the density of adsorption sites is . In the simulation we consider up to 4. We therefore have the following rate equations:
| (3) | ||||
| (4) | ||||
| (5) | ||||
| (6) |
Based on this simple rate equation model, we run simulations for the experiment shown in Figure 2. The initial condition of the simulation is taken to be and , where 0.23 ML is the initial surface coverage. Figure 10 shows the comparison between experimental and simulation results of the coverage of CO2 both in clusters and as isolated molecules. The measured coverages are normalized to the coverage 0.23 ML. At above 70 K, CO2 desorption begins, which is not simulated by the model. It can been seen that K fits the experimental data well.
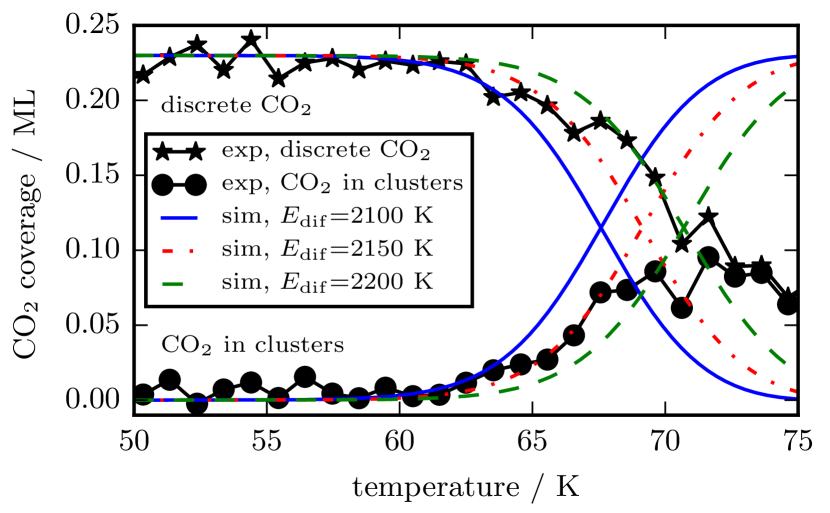
We performed a calculation similar to that in Öberg et al. (2009) to predict the segregation temperature at an astrophysical relevant timescale. We assumed three different heating rates of dust grains, , , and K per year, which covers a wider range than in a typical warm-up model. The energy barrier for diffusion is K. We assume that on average it takes each CO2 molecule 5 diffusion steps to encounter another CO2 and segregate or form clusters, which is a reasonable estimate considering the CO2 abundance with respect to water. It is found that the segregation temperature K. This is higher than the value obtained by Öberg et al. (2009) who assumed a heating rate of 30 K in 4,000 years and a CO2 concentration of 0.16 in water ice.
In summary, we found that the diffusion energy barrier for a CO2 molecule diffusing on np-ASW is 215050 K, assuming a diffusion prefactor of s-1. A calculation shows that at astrophysical timescales the CO2 segregation temperature is K. This temperature is higher than the one at which there is CO distillation in CO:CO2 ice (Pontoppidan et al., 2008). Assuming the same prefactor for desorption, we also obtained the binding energies of CO2 on CO2 ice and CO2 on np-ASW to be K and K, respectively. A stronger binding of CO2-CO2 than CO2-H2O is consistent with the non-wetting of CO2 on water ice. These values can then be used in simulations of the formation and evolution of mixed ices in the ISM.
5 Acknowledgments
This research was supported by NSF Astronomy & Astrophysics Division Grants #1311958 and #1615897.
6 Appendix
The deposition of CO2 on np-ASW is obtained either from filling the chamber at a given pressure for a given time (background deposition) or using the molecular beam. The molecular beam deposition is slow and has a narrow angular spread, thus it is targeted to the sample with minimal deposition of CO2 molecules on other parts of the apparatus. The deposition rate from background can be calculated by
| (7) | |||
| (8) |
where is the density in the gas phase, is the velocity of the gas particle, is the pressure in the chamber, and is the gas temperature. The gas pressure was assumed to be homogeneous in the chamber. The gas specific correction factor of ionization gauge was already taken into account. The temperature of the gas was taken to be the same as the chamber wall. The deposition rate from the beam was obtained by comparing the IR of CO2 deposited from the beam with that from background deposition. In the calibration experiments, CO2 was deposited on 100 L of water that was deposited at 10 K and warmed to 67 K. At 67 K CO2 is mobile on the water surface. RAIRS spectra were taken during CO2 deposition as shown in the Figure 11. At increasing coverage, the 2344 cm-1 feature moves to higher wavenumber, while the 2380 cm-1 peak begins to emerge (for clarity, only traces at selected exposures are shown). The benchmark coverage was chosen to be the one at which the 2344 cm-1 peak is at the same height as the 2380 cm-1 peak. This benchmark coverage is independent of deposition method—background and beam deposition. It only depends on the coverage of CO2 on the part of the water ice that is covered by CO2. Therefore this is a reliable method to obtain the absolute intensity of the beam. The relative uncertainty of the beam intensity calibration is 5%.
References
- Al-Halabi et al. (2004) Al-Halabi, A., Fraser, H. J., Kroes, G. J., & van Dishoeck, E. F. 2004, A&A, 422, 777
- Baratta et al. (2000) Baratta, G. A., Palumbo, M. E., & Strazzulla, G. 2000, A&A, 357, 1045
- Bernstein et al. (2005) Bernstein, M. P., Cruikshank, D. P., & Sandford, S. A. 2005, Icar, 179, 527
- Berreman (1963) Berreman, D. W. 1963, PhRv, 130, 2193
- Boogert et al. (2015) Boogert, A. C. A., Gerakines, P. A., & Whittet, D. C. B. 2015, ARA&A, 53, 541
- Cook et al. (2011) Cook, A. M., Whittet, D. C. B., Shenoy, S. S., et al. 2011, ApJ, 730, 124
- Cuppen et al. (2011) Cuppen, H. M., Penteado, E. M., Isokoski, K., van der Marel, N., & Linnartz, H. 2011, MNRAS, 417, 2809
- Dartois et al. (1999) Dartois, E., Schutte, W., Geballe, T. R., et al. 1999, A&A, 342, L32
- Edridge et al. (2013) Edridge, J. L., Freimann, K., Burke, D. J., & Brown, W. A. 2013, RSPTA, 371, 20110578
- Ehrenfreund et al. (1998) Ehrenfreund, P., Dartois, E., Demyk, K., & D’Hendecourt, L. 1998, A&A, 339, L17
- Ehrenfreund et al. (1999) Ehrenfreund, P., Kerkhof, O., Schutte, W. A., et al. 1999, A&A, 350, 240
- Escribano et al. (2013) Escribano, R. M., Munoz Caro, G. M., Cruz-Diaz, G. A., Rodriguez-Lazcano, Y., & Mate, B. 2013, PNAS, 110, 12899
- Gerakines & Hudson (2015) Gerakines, P. A., & Hudson, R. L. 2015, ApJ, 808, L40
- Gerakines et al. (1999) Gerakines, P. A., Whittet, D. C. B., Ehrenfreund, P., et al. 1999, ApJ, 522, 357
- Ghesquière et al. (2015) Ghesquière, P., Mineva, T., Talbi, D., et al. 2015, PCCP, 17, 11455
- He et al. (2016a) He, J., Acharyya, K., & Vidali, G. 2016a, ApJ, 825, 89
- He et al. (2016b) —. 2016b, ApJ, 823, 56
- He et al. (2016) He, J., Emtiaz, S., & Vidali, G. 2016, in prep.
- Hodyss et al. (2008) Hodyss, R., Johnson, P. V., Orzechowska, G. E., Goguen, J. D., & Kanik, I. 2008, Icar, 194, 836
- Ioppolo et al. (2009) Ioppolo, S., Palumbo, M. E., Baratta, G. A., & Mennella, V. 2009, A&A, 493, 1017
- Ioppolo et al. (2013) Ioppolo, S., Sangiorgio, I., Baratta, G. A., & Palumbo, M. E. 2013, A&A, 554, A34
- Isokoski et al. (2014) Isokoski, K., Bossa, J.-B., Triemstra, T., & Linnartz, H. 2014, PCCP, 16, 3456
- Karssemeijer et al. (2014) Karssemeijer, L. J., de Wijs, G. A., & Cuppen, H. M. 2014, PCCP, 16, 15630
- Keane et al. (2001) Keane, J. V., Boogert, A. C. A., Tielens, A. G. G. M., Ehrenfreund, P., & Schutte, W. A. 2001, A&A, 375, L43
- Kolasinski (2008) Kolasinski, K. 2008, Surface Science: Foundations of Catalysis and Nanoscience (Wiley)
- Lauck et al. (2015) Lauck, T., Karssemeijer, L., Shulenberger, K., et al. 2015, ApJ, 801, 118
- Mispelaer et al. (2013) Mispelaer, F., Theulé, P., Aouididi, H., et al. 2013, A&A, 555, A13
- Noble et al. (2012) Noble, J. A., Congiu, E., Dulieu, F., & Fraser, H. J. 2012, MNRAS, 421, 768
- Nummelin et al. (2001) Nummelin, A., Whittet, D. C. B., Gibb, E. L., Gerakines, P. A., & Chiar, J. E. 2001, ApJ, 558, 185
- Öberg et al. (2009) Öberg, K. I., Fayolle, E. C., Cuppen, H. M., van Dishoeck, E. F., & Linnartz, H. 2009, A&A, 505, 183
- Palumbo (2006) Palumbo, M. E. 2006, A&A, 453, 903
- Palumbo & Baratta (2000) Palumbo, M. E., & Baratta, G. A. 2000, A&A, 361, 298
- Palumbo et al. (2006) Palumbo, M. E., Baratta, G. A., Collings, M. P., & McCoustra, M. R. S. 2006, Physical Chemistry Chemical Physics (Incorporating Faraday Transactions), 8, 279
- Pontoppidan et al. (2003) Pontoppidan, K. M., Fraser, H. J., Dartois, E., et al. 2003, A&A, 408, 981
- Pontoppidan et al. (2008) Pontoppidan, K. M., Boogert, A. C. A., Fraser, H. J., et al. 2008, ApJ, 678, 1005
- Ratsch & Venables (2003) Ratsch, C., & Venables, J. A. 2003, JVST, 21, S96
- Whittet et al. (2009) Whittet, D. C. B., Cook, A. M., Chiar, J. E., et al. 2009, ApJ, 695, 94
- Whittet et al. (2007) Whittet, D. C. B., Shenoy, S. S., Bergin, E. A., et al. 2007, ApJ, 655, 332
- Whittet et al. (1998) Whittet, D. C. B., Gerakines, P. A., Tielens, A. G. G. M., et al. 1998, ApJ, 498, L159