EpistAid: Interactive Interface for Document Filtering in Evidence-based Health Care
Abstract
Evidence-based health care (EBHC) is an important practice of medicine which attempts to provide systematic scientific evidence to answer clinical questions. In this context, Epistemonikos (www.epistemonikos.org) is one of the first and most important online systems in the field, providing an interface that supports users on searching and filtering scientific articles for practicing EBHC. The system nowadays requires a large amount of expert human effort, where close to 500 physicians manually curate articles to be utilized in the platform. In order to scale up the large and continuous amount of data to keep the system updated, we introduce EpistAid, an interactive intelligent interface which supports clinicians in the process of curating documents for Epistemonikos within lists of papers called evidence matrices. We introduce the characteristics, design and algorithms of our solution, as well as a prototype implementation and a case study to show how our solution addresses the information overload problem in this area.
keywords:
Evidence-Based Health Care; Intelligent User Interfaces; Information Filtering; Visualization.category:
H.5.m. Information Interfaces and Presentation (e.g. HCI) Graphical User Interfacescategory:
H.3.3 Information Search and Retrieval Information filtering1 Introduction
Evidence-Based Health Care (EBHC) is a medical practice approach that emphasizes the use of research evidence to justify a medical treatment. Sackett et al. defined it as “the conscientious, explicit, and judicious use of current best evidence in making decisions about the care of individual patients” [29]. EBHC has produced a large impact in the practice and teaching of medicine, since applying the knowledge gained from large clinical trials to patient care promotes consistency of treatment and optimal outcomes, in contrast to solely relying on habits or anecdotal cases [28].
Despite its growing importance in health care, the process of answering a medical question is currently very expensive in time [3], [21]. Clinicians pose a question, seek studies related to it, select the most relevant to the question, then perform analysis to finally obtain conclusions. This situation can be problematic because in practice, health-care related decisions must be made quickly [33]. Moreover, with the explosion of scientific knowledge being published, it is difficult for clinicians to stay updated.
In this context, some systems attempt to support clinicians in the process of collecting, organizing, and searching for scientific evidence such as Embase [10], DARE [23], and Epistemonikos[26]. In particular, Epistemonikos is a collaborative database which stores research articles that provide the best evidence according to the EBHC principles [26]. Since the evidence comes from scientific literature, this information is collected from specialized online sites such as PubMed and Cochrane, among more than 20 other sources of scientific information.
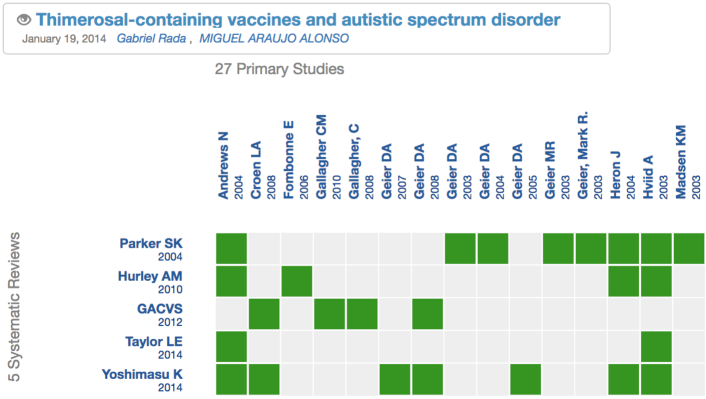
In addition to collecting, indexing and classifying medical research articles for EBHC, Epistemonikos developed “Evidence Matrices”, a matrix visualization of a list of articles which provide the best evidence to answer a specific medical question, as seen in Figure 1. Nowadays, the process of creating an evidence matrix is slow since it requires a large amount of manual and iterative effort from experts.

Contribution. In this article, we introduce EpistAid, a system with an intelligent user interface which support physicians in the process of creating these evidence matrices within Epistemonikos. Then, we contribute to EBHC and to the area of intelligent user interfaces by: (a) integrating dimensionality reduction and leveraging relevance feedback for assisting incremental document classification in EBHC, and (c) designing and implementing an interactive user interface which integrates the aforementioned methods to reduce the effort required to finish this important task of health care. Although previous works attempted to solve this issue automatically or with semi-supervised approaches, to the best of our knowledge this is the first work which integrates machine learning and information retrieval with an interactive user interface for EHBC. In this area, it is essential to keep a “human in the loop” in the process, since physicians require control and transparency while filtering documents to answer a clinical question.
2 Building Evidence Matrices
The evidence matrix is the basic unit in Epistemonikos. It is made of a list of papers which provide the evidence to answer a clinical question such as “Is there a relationship between vaccines with thimerosal and autism?”. In the matrix, rows represent systematic reviews (SR) and columns are primary studies (PS) which have been cited in those SR, as seen in Figure 1. PS is an umbrella term that includes any study design, qualitative or quantitative, where data is collected from individuals or groups of people. On the other side, the main objective of a SR is to synthesize primary studies.
The process of creating a final evidence matrix is iterative, since involves the manual process of curating an automatically created matrix . The method for building the initial matrix is shown in Figure 2. It starts with a user selecting a seed SR, based on a clinical question. Using Breadth-First Search over the citation graph [8], all the PS cited in the seed SR are added to the matrix as columns (L1-PS). Next, other SR in the database citing the L1-PS are added as rows (L2-SR). Finally, other PS cited in the L2-SR are added as additional columns (L3-SR).
The problem. must be modified by clinicians until getting to by: (i) removing papers not related to the clinical question, and (ii) adding new SR and PS strongly related to the clinical question. This process can take several months, especially (ii), since it involves manually searching and checking for papers which are not explicitly linked in the Epistemonikos’ citation database.
Our solution. We call our solution EpistAid. We propose a series of methods which combined with an interactive user interface aim at reducing the time to produce from . Our solution involves dimensionality reduction over the text of the articles [9], and utilizing the Rocchio algorithm for relevance feedback [20].
3 Dataset
Epistemonikos collects articles from 26 online sources [12]. The database contains around 370,000 documents of five types: (a) Primary Study, (b) Systematic Review, (c) Overview, (d), Structured Summary of PS, and (e) Structured Summary of SR. Among them, only (a) corresponds to specific studies, and the rest (b)-(e) are surveys of different level of detail, being (b) Systematic Review the most used. Table 1 shows the number of items per publication type in Epistemonikos.
| Type of publication | Articles in database |
|---|---|
| (a) Primary Study | 261,085 |
| (b) Systematic Review | 71,597 |
| (c) Overview | 1,068 |
| (d) Structured Summary of PS | 1,344 |
| (e) Structured Summary of SR | 37,735 |
Currently, there are about 2,700 public evidence matrices, but only close to 400 are in their final revised version. Physicians require 2-6 months to get from an initial version to a final revise .
4 EpistAid
Our solution encompasses a user interface and algorithms that can assist physicians during the process of filtering (removing and adding) documents related to a clinical question they want to answer. We present EpistAid in three parts: (i) User interface, which describes the layout and visual components, (ii) Interactions, where we justify and describe our design based on Schneidermann’s visual Information-Seeking mantra [31], and (iii) Algorithms, which support the intelligence behind the filtering process.
4.1 User interface
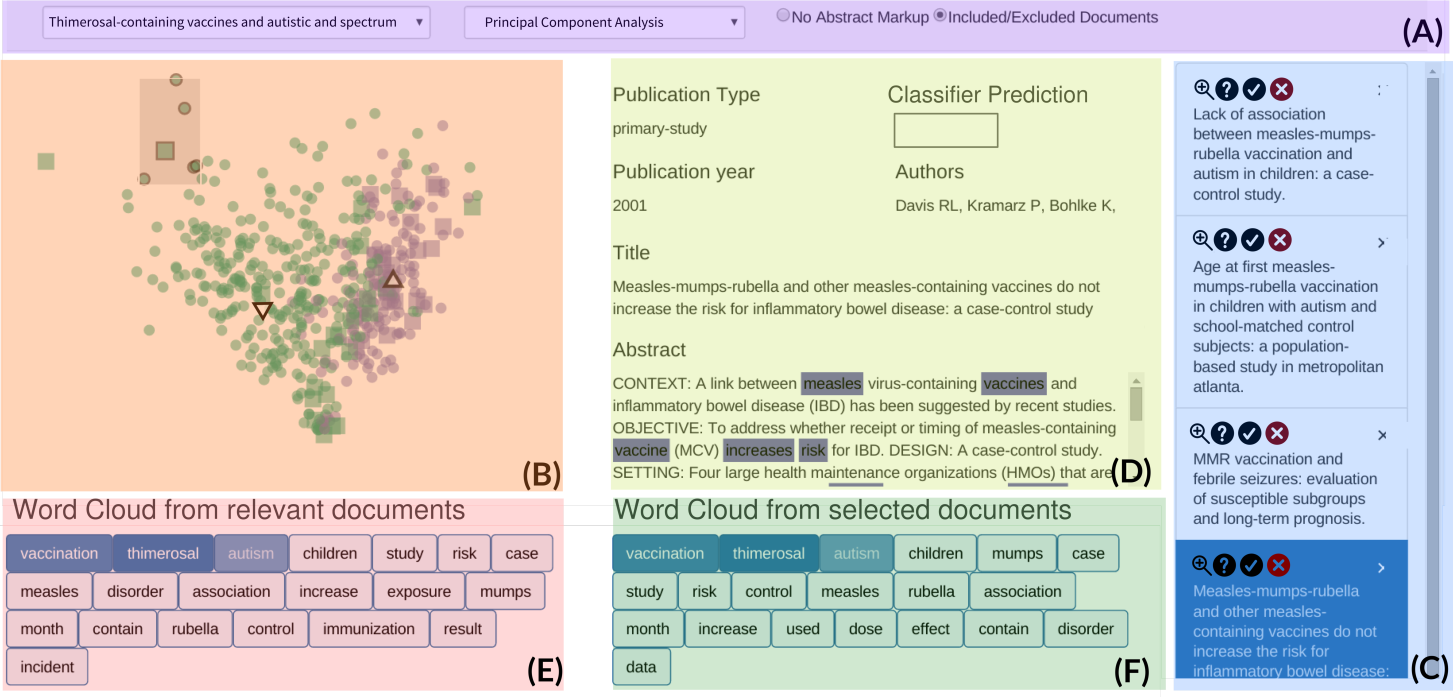
EpistAid user interface was developed using D3.js [5] and Bootstrap [24]. The GUI layout, shown in Figure 3, has 6 parts and is described as follows:
(A) Question Selection. This navigation area lets the users choose an evidence matrix, i.e., the document set they want to see and classify. Since we represent this set of documents as a document-term matrix (DTM) using a vector space model [20], we perform dimensionality reduction over this DTM to represent each document with a low-rank vector of two dimensions. Users can choose the type of dimensionality reduction (PCA, LDA, MDS [11]) they prefer in order to eventually visualize the documents in the two dimensional (2D) chart shown as (B). In Figure 3, the user chose Principal Component Analysis over the documents of the evidence matrix “Thimerosal containing vaccines and autistic spectrum disorder.”
(B) Documents Visualization. This area shows the documents as figures in a 2D chart. Its purpose is to provide an overview of the document set associated with the current evidence matrix , and to let the user explore the content based on proximity among documents. As explained in the previous paragraph, the dimensionality reduction is chosen from the list in (A). In the 2D chart, the primary studies (PS) are represented by circles and the systematic reviews (SR) by slightly larger squares. The color is used to discriminate the current status of the document: relevant, non-relevant or unknown. Two unfilled triangles with thick borders represent the centroids of the relevant (pointing upwards) and non-relevant documents (pointing downwards).
For selecting a set of documents, the user can draw a rectangle with custom dimensions, what we call a brush. The brush enables the user to navigate through all the documents by sub-setting them based on their positions in the 2D projections. The selected document are displayed as a list in the right-side panel (C).
(C) Selected Documents List. This panel lists the documents selected with the brush in 2D Document Visualization. When the brush tool has not been used yet it will show the documents that have not been classified yet (unknown classification). Each item in the list shows the document title, as well as a magnifier icon that will activate the Document Detail for the document, which will be displayed in panel (D). Also, three icons let the user to classify the paper (as relevant, non-relevant or unknown). The documents are sorted according to their similarity to the relevance model of the evidence matrix, a concept we explain in the next section Algorithms.
(D) Document Detail. For a document selected in the Selected Documents List (C) panel, this area shows its meta-data (title, abstract, type, publication year and authors) and the classification algorithm prediction regarding its relevance. Its goal is to offer the user the option to review the documents in the same way they usually do with the current interface. The abstract can be shown in two different ways: without markup or marking the relevant and non-relevant document keywords. In the second case the words are highlighted changing the background color with the same colors of Documents Visualization.
(E) Relevant Documents Summary. This part shows a wordcloud of important words from the current relevant documents. Its main goal is to show a quick summary of the main features (words) within this group. These words can be obtained with two methods: most frequent or based on relevance [32]. Each word is enclosed within a button. The background color represents the relevance of the word for the user: the darker, the more important the word. The user can increase and decrease the relevance of a word to the model by clicking the right and left buttons of the mouse, respectively.
(F) Selected Documents Summary. This view has the same structure as the Relevant Documents Summary but the documents it summarizes are the ones selected with the brush tool from Documents Visualization.
4.2 Interactions
Our interaction design is based on the visual Information-Seeking Mantra: overview first, zoom and filter, then details-on-demand [31].
Overview first. We implement the overview-first functionality with the Documents Visualization (B) where users can see a summary of the documents from the selected evidence matrix in the 2D projection resultant from a dimensionality reduction over the term-document matrix.
Zoom and Filter: selecting documents and words. The brush tool described in the previous section allows users to subset documents from the 2D Documents Visualization, which can be eventually analyzed in detail. When users classify documents from panel (C) (Selected Documents List) and when they increase or decrease the relevance of specific words from panels (E) (Relevant Documents Summary) and (F) (Selected Documents Summary), they update an internal evidence matrix relevance model which allows the system to make predictions over non-classified documents. Moreover, our system subsequently suggest documents to be reviewed by users so they can confirm the classification prediction.
Details on demand. By allowing the users to click in the documents on the panel (F) (Selected Documents List), the systems provides additional details displayed in panel (D) (Document Detail). In this way, it allows the user to justify her decision to classify the document.
4.3 Algorithms
The main aspect of our “human-in-the-loop” algorithmic procedure starts with modelling the evidence matrix as a query, which is updated iteratively when users provide relevance feedback. We call this model the evidence matrix relevance model, and it is based on Rocchio’s relevance feedback algorithm [30]. We choose this model because it allows the use of feature boosting (in our case features=words) and it gives a sense of the current classification through the query.
Relevance feedback in EpistAid. We define a query as a vector of words, the weights calculated with TF-IDF as where is the number of words in the query . In our system the initial query is made from the words in the title and abstract of the Seed SR. Afterwards, we rank the documents in the first version of the evidence matrix based on their cosine similarity with , predicting the top most similar as relevant and the top most dissimilar as non-relevant. We then recommend these documents to the users so they can confirm our predictions. Once the user provides feedback by manually classifying the recommended documents, as well as boosting or decreasing specific words from the EpistAid interface, we update the query iteratively, such that in iteration the query is:
| (1) |
Where is the last computed query, is the set of relevant documents, is the set of non-relevant documents, is the initial query. The parameters , , and have values between and . We use as parameters: , , and based on the values used in [30].
The query represents the centroid of the relevant documents, and by analogy, we can represent iteratively the centroid of the non-relevant documents . Both queries are represented visually as triangles in the 2D Documents Visualization panel of the EpistAid interface, as seen in Figure 4.
Dimensionality Reduction In order to display in two dimensions the term-document matrix if and evidence matrix, we chose 5 different dimensionality reduction algorithms: Principal Components Analysis (PCA), Linear Discriminant Analysis (LDA), Multidimensional Scaling (MDS) [11] and the recent t-distributed Stochastic Neighbor Embedding (t-SNE) [19]. The main idea is to allow the users to visualize the status and evolution of the whole document set of an evidence matrix, as well as filtering based on their visual proximity to the relevant and non-relevant query centroids.
5 Use Case
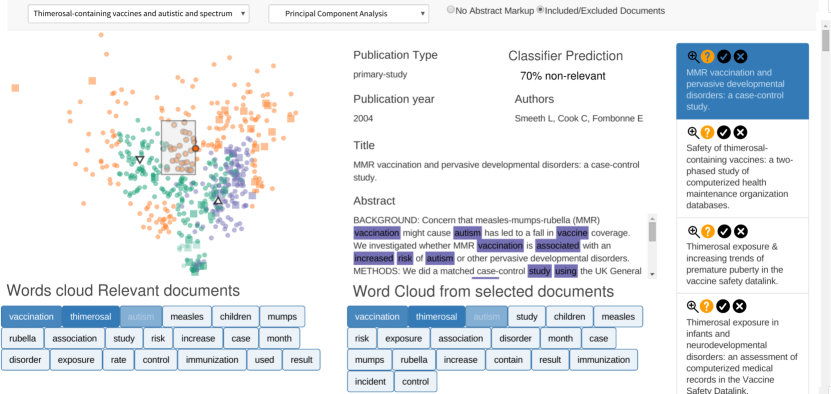
We present a use case of EpisteAid to filter the document set “Thimerosal-containing vaccines and autistic spectrum disorde”. After selecting the document set, the interface will show the documents in a two dimensional projection using PCA. The Selected Documents List will show the all the documents, sorted by their similarity to the query.
We will boost the words ‘children’, ‘vaccination’ and ‘autism’ and classify some papers of the list. These actions will feed the system so that it can predict classes with more information. The user can click the magnifying glass of a document on the Selected Documents List area to see more details about the document. This part will also show the classifier prediction when the user hovers the area. The goal is to give its prediction, only when the user decides to prevent bias in the classification. This process continues until the classification of all the articles is completed.
6 Related Work
Several approaches have been proposed to reduce the workload associated with the task of document filtering for citation screening in EBHC databases. Among them we can find: Active Learning([15],[21], [27], [34], [36], [35]), Automatic Classification ([2], [16], [3], [22]), Document Ranking [7], Relevance Feedback [17], Document Priorization [6] , and Visualization [13], [14]. The problem with the majority of these approaches is that they do not ensure 100% recall needed to reduce the bias of the research. Compared to these works, we provide the first controllable and transparent information filtering system for EBHC, inspired by controllable recommender system interfaces [4],[25].
7 Conclusion
In this paper we have presented EpistAid, a system with an interactive user interface which attempts to reduce the effort needed to curate evidence matrices in Epistemonikos. Our upcoming work is conducting a user study with the interface and techniques described. In addition, we would like to integrate into our framework more recent techniques for relevance feedback, such as the relevance models [18].
8 Acknowledgments
Authors gratefully acknowledge the grant from agency grant#xxx–2015 (intentionally obfuscated to comply with double blind requirement)
References
- [1]
- [2] Tanja Bekhuis and Dina Demner-Fushman. 2012. Screening nonrandomized studies for medical systematic reviews: a comparative study of classifiers. October 55, 3 (2012), 197–207. DOI:http://dx.doi.org/10.1016/j.surg.2006.10.010.Use
- [3] Tanja Bekhuis, Eugene Tseytlin, Kevin J. Mitchell, and Dina Demner-Fushman. 2014. Feature engineering and a proposed decision-support system for systematic reviewers of medical evidence. PLoS ONE 9, 1 (2014), 1–10. DOI:http://dx.doi.org/10.1371/journal.pone.0086277
- [4] Svetlin Bostandjiev, John O’Donovan, and Tobias Höllerer. 2012. TasteWeights: A Visual Interactive Hybrid Recommender System. In Proceedings of the Sixth ACM Conference on Recommender Systems (RecSys ’12). ACM, New York, NY, USA, 35–42. DOI:http://dx.doi.org/10.1145/2365952.2365964
- [5] Michael Bostock, Vadim Ogievetsky, and Jeffrey Heer. 2011. D3 Data-Driven Documents. IEEE Transactions on Visualization and Computer Graphics 17, 12 (Dec. 2011), 2301–2309. DOI:http://dx.doi.org/10.1109/TVCG.2011.185
- [6] Aaron M. Cohen, Kyle Ambert, and Marian McDonagh. 2009. Cross-Topic Learning for Work Prioritization in Systematic Review Creation and Update. Journal of the American Medical Informatics Association 16, 5 (2009), 690–704. DOI:http://dx.doi.org/10.1197/jamia.M3162
- [7] A. M. Cohen, N. R. Smalheiser, M. S. McDonagh, C. Yu, C. E. Adams, J. M. Davis, and P. S. Yu. 2015. Automated confidence ranked classification of randomized controlled trial articles: an aid to evidence-based medicine. Journal of the American Medical Informatics Association 22, 3 (2015), 707–17. DOI:http://dx.doi.org/10.1093/jamia/ocu025
- [8] Thomas H Cormen. 2009. Introduction to algorithms. MIT press.
- [9] Steven P Crain, Ke Zhou, Shuang-Hong Yang, and Hongyuan Zha. 2012. Dimensionality reduction and topic modeling: From latent semantic indexing to latent dirichlet allocation and beyond. In Mining text data. Springer, 129–161.
- [10] Elsevier. 2016. Embase, Biomedical evidence is essential. http://store.elsevier.com/embase
- [11] Daniel Engel, Lars Hüttenberger, and Bernd Hamann. 2012. A survey of dimension reduction methods for high-dimensional data analysis and visualization. In OASIcs-OpenAccess Series in Informatics, Vol. 27. Schloss Dagstuhl-Leibniz-Zentrum fuer Informatik.
- [12] Epistemonikos. 2016. Epistemonikos database methods. http://www.epistemonikos.org/en/about_us/methods
- [13] Katia R. Felizardo, Gabriel F. Andery, Fernando V. Paulovich, Rosane Minghim, and Jose C. Maldonado. 2012. A visual analysis approach to validate the selection review of primary studies in systematic reviews. Information and Software Technology 54, 10 (2012), 1079–1091. DOI:http://dx.doi.org/10.1016/j.infsof.2012.04.003
- [14] Katia Romero Felizardo, Simone R S Souza, and Jos?? Carlos Maldonado. 2013. The use of visual text mining to support the study selection activity in systematic literature reviews: A replication study. In Proceedings - 2013 3rd International Workshop on Replication in Empirical Software Engineering Research, RESER 2013. DOI:http://dx.doi.org/10.1109/RESER.2013.9
- [15] Rosa L Figueroa, Qing Zeng-Treitler, Long H Ngo, Sergey Goryachev, and Eduardo P Wiechmann. 2012. Active learning for clinical text classification: is it better than random sampling? Journal of the American Medical Informatics Association : JAMIA 19, 5 (2012), 809–16. DOI:http://dx.doi.org/10.1136/amiajnl-2011-000648
- [16] J. J. García Adeva, J. M. Pikatza Atxa, M. Ubeda Carrillo, and E. Ansuategi Zengotitabengoa. 2014. Automatic text classification to support systematic reviews in medicine. Expert Systems with Applications 41, 4 PART 1 (2014), 1498–1508. DOI:http://dx.doi.org/10.1016/j.eswa.2013.08.047
- [17] Siddhartha Jonnalagadda and Diana Petitti. 2013. A new iterative method to reduce workload in systematic review process. International journal of computational biology and drug design 6, 1-2 (2013), 5–17. DOI:http://dx.doi.org/10.1504/IJCBDD.2013.052198
- [18] Victor Lavrenko and W Bruce Croft. 2001. Relevance based language models. In Proceedings of the 24th annual international ACM SIGIR conference on Research and development in information retrieval. ACM, 120–127.
- [19] Laurens van der Maaten and Geoffrey Hinton. 2008. Visualizing data using t-SNE. Journal of Machine Learning Research 9, Nov (2008), 2579–2605.
- [20] Christopher D. Manning, Prabhakar Raghavan, and Hinrich Schütze. 2008. Introduction to Information Retrieval. Cambridge University Press, New York, NY, USA.
- [21] Makoto Miwa, James Thomas, Alison O’Mara-Eves, and Sophia Ananiadou. 2014. Reducing systematic review workload through certainty-based screening. Journal of Biomedical Informatics 51 (2014), 242–253. DOI:http://dx.doi.org/10.1016/j.jbi.2014.06.005
- [22] Yuanhan Mo, Georgios Kontonatsios, and Sophia Ananiadou. 2015. Supporting systematic reviews using LDA-based document representations. Systematic Reviews 4, 1 (2015), 172. DOI:http://dx.doi.org/10.1186/s13643-015-0117-0
- [23] University of York NHS. 2016. DARE. http://www.crd.york.ac.uk/CRDWeb/
- [24] Mark Otto and Jacob Thornton. 2016. Bootstrap. http://getbootstrap.com/
- [25] Denis Parra and Peter Brusilovsky. 2015. User-controllable Personalization. Int. J. Hum.-Comput. Stud. 78, C (June 2015), 43–67. DOI:http://dx.doi.org/10.1016/j.ijhcs.2015.01.007
- [26] Gabriel Rada, Daniel Perez, and Daniel Capurro. 2013. Epistemonikos: a free, relational, collaborative, multilingual database of health evidence. Studies in health technology and informatics 192 (2013), 486–490. DOI:http://dx.doi.org/10.3233/978-1-61499-289-9-486
- [27] John Rathbone, Tammy Hoffmann, and Paul Glasziou. 2015. Faster title and abstract screening? Evaluating Abstrackr, a semi-automated online screening program for systematic reviewers. Systematic Reviews 4, 1 (2015). DOI:http://dx.doi.org/10.1186/s13643-015-0067-6
- [28] David L Sackett and William MC Rosenberg. 1995. The need for evidence-based medicine. Journal of the Royal Society of Medicine 88, 11 (1995), 620–624.
- [29] David L Sackett, William MC Rosenberg, JA Muir Gray, R Brian Haynes, and W Scott Richardson. 1996. Evidence based medicine: what it is and what it isn’t. Bmj 312, 7023 (1996), 71–72.
- [30] G. Salton. 1971. The SMART Retrieval System—Experiments in Automatic Document Processing. Prentice-Hall, Inc., Upper Saddle River, NJ, USA.
- [31] B. Shneiderman. 1996. The eyes have it: a task by data type taxonomy for informatio nvisualizations. Proceedings 1996 IEEE Symposium on Visual Languages (1996), 336–343. DOI:http://dx.doi.org/10.1109/VL.1996.545307
- [32] Carson Sievert and Kenneth Shirley. 2014. LDAvis: A method for visualizing and interpreting topics. Proceedings of the Workshop on Interactive Language Learning, Visualization, and Interfaces (2014), 63–70. http://www.aclweb.org/anthology/W/W14/W14-3110
- [33] James Thomas, John McNaught, and Sophia Ananiadou. 2011. Applications of text mining within systematic reviews. Research Synthesis Methods 2, 1 (2011), 1–14. DOI:http://dx.doi.org/10.1002/jrsm.27
- [34] Byron C Wallace, Kevin Small, Carla E Brodley, and Thomas a Trikalinos. 2010. Active Learning for Biomedical Citation Screening. Kdd2010 (2010), 173–181. DOI:http://dx.doi.org/10.1145/1835804.1835829
- [35] BC C Wallace, K Small, CE E Brodley, and TA A Trikalinos. 2011. Who Should Label What? Instance Allocation in Multiple Expert Active Learning. Sdm (2011), 176–187. DOI:http://dx.doi.org/10.1137/1.9781611972818.16
- [36] Byron C Wallace, Thomas a Trikalinos, Joseph Lau, Carla Brodley, and Christopher H Schmid. 2010. Semi-automated screening of biomedical citations for systematic reviews. BMC bioinformatics 11, 55 (2010), 55. DOI:http://dx.doi.org/10.1186/1471-2105-11-55