Fluidization and wall slip of soft-glassy materials by controlled surface roughness
Abstract
The motion of soft-glassy materials (SGM) in a confined geometry is strongly impacted by surface roughness. However, the effect of the spatial distribution of the roughness remains poorly understood from a more quantitative viewpoint. Here we present a comprehensive study of concentrated emulsions flowing in microfluidic channels, one wall of which is patterned with micron-size equally spaced grooves oriented perpendicularly to the flow direction. We show that roughness-induced fluidization can be quantitatively tailored by systematically changing both the width and separation of the grooves. We find that a simple scaling law describes such fluidization as a function of the density of grooves, suggesting common scenarios for droplet trapping and release. Numerical simulations confirm these views and are used to elucidate the relation between fluidization and the rate of plastic rearrangements.
pacs:
47.57.-s, 83.50.-v, 77.84.NhControlling the slip and flow of soft-glassy materials (SGM) at the microscale is crucial for food and pharmaceutical processing, and for micro-manufacturing Kunii and Levenspiel (2013); Meeker et al. (2004); Denkov et al. (2008); Tabilo-Munizaga and
Barbosa-Cánovas (2005). SGM include concentrated emulsions, gels, foams, pastes, and exhibit a complex, non-linear rheology Larson (1999); Coussot (2005); Cantat et al. (2013): they behave like elastic solids unless a stress large enough, known as the yield stress , is applied. Above SGM flow like non-Newtonian liquids. This solid-to-liquid transition and the corresponding flowing properties have been widely studied Mason (1999), but still pose a series of challenging questions, relevant both for applications Angell (1995); Mason et al. (1996); Scheffold et al. (2014) and for a better understanding of the statistical mechanics of SGM Falk and Langer (1998); Varnik et al. (2004, 2003); Pouliquen and Forterre (2009); Bocquet et al. (2009); Sollich and Cates (2012); Jop et al. (2012); Desmond and Weeks (2015); Benzi et al. (2016). Recent studies Goyon et al. (2008, 2010); Seth et al. (2012); Mansard et al. (2013, 2014); Paredes et al. (2015); Katgert et al. (2010); Dollet et al. (2015); Geraud et al. (2013) showed that their flow bahavior is characterized by “non-locality” Goyon et al. (2008, 2010), meaning that the relation between the local stress and the local shear rate cannot be explained with a unique master curve. This non-local behaviour depends on both confinement and surface roughness Goyon et al. (2010); Mansard et al. (2014); Paredes et al. (2015), and it is ascribed to the presence of plastic rearrangements Goyon et al. (2008, 2010), i.e. topological changes in the micro-structural configurations. These take place whenever the material cannot sustain the accumulated stress, then it undergoes an irreversible deformation and releases the excess stress in the form of elastic waves. The range of such perturbation introduces a new length, named “cooperativity length” Goyon et al. (2008), which is typically on the order of a few diameters of micro-structural constituents (i.e. droplets for emulsions Goyon et al. (2008, 2010), bubbles for foams Katgert et al. (2010); Dollet et al. (2015), blobs for gels Geraud et al. (2013), etc).
Although the cooperativity length becomes relevant at the jamming point of SGM Liu and Nagel (1998), it has been sharply argued that is fundamentally different from the characteristic legnth that describes dynamical heterogeneities involved in spontaneous fluctuations Berthier et al. (2005); Brambilla et al. (2010); Ikeda et al. (2012).
Recently, many theoretical studies have been put forward in the recent years to account for these non-local effects Falk and Langer (1998); Pouliquen and Forterre (2009); Bocquet et al. (2009); Sollich and Cates (2012); Benzi et al. (2016). One of them, the kinetic elasto-plastic (KEP) model Bocquet et al. (2009), explores the effects of cooperativity on the fluidity field , i.e. the inverse viscosity for the system. An important result of KEP relates the fluidity field with the rate of plastic rearrangements
| (1) |
The relation between the rate of plastic rearrangements and the flow profiles is highly non-trivial Bouzid et al. (2015), and with the exception of a few studies Mansard et al. (2013); Scagliarini et al. (2016); Dollet et al. (2015), has not been researched in detail.
Experimental studies report that surface roughness can change the material structural properties, trigger and promote rearrangements, and describe this scenario by ad-hoc parameters, e.g. the wall fluidization Goyon et al. (2008, 2010); Paredes et al. (2015). Such wall fluidization was generically found to be larger for rough walls than for smooth walls Goyon et al. (2008, 2010), but only few studies provided quantitative insights into how a systematic change of the roughness affects it. Mansard et al. Mansard et al. (2014) showed that both slippage and wall fluidization depend non-monotonously on the height of the roughness. However, the effect of the roughness geometry on the enhancement of the plastic activity has still to be properly addressed.
In this letter we present a comprehensive experimental and numerical study of concentrated emulsions flowing in microchannels, and provide the first direct evidence that the roughness-induced fluidization follows precise scaling laws in terms of the density of rough elements. Thus, it can be quantitatively controlled and predicted. This is understood in terms of plastic activity: as droplets encounter the rough elements, either by flowing into the gaps or by hitting an obstacle, they suddenly change their local velocity and induce an irreversible rearrangement of their neighbors. The link between fluidization and plastic rearrangements is then directly tested Bouzid et al. (2015).
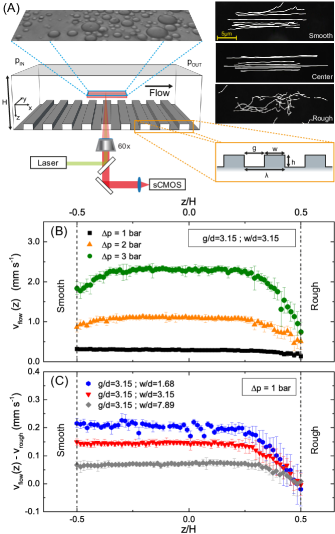
We studied the flow behavior of a concentrated emulsion in a home-made microfluidic device prepared by multilayer photolithography using SU8 photoresist on glass Ferraro et al. (2012); Brigo et al. (2008). The microfluidic channels had a width of 4 mm, height of 220 m and length of 4.5 cm. Controlled roughness was provided by an array of rectangular posts of width , gap and period , extending over the whole width of the channel (see bottom zoom of Fig. 1-A). The posts were orientated perpendicularly to the direction of the flow and had heights of m. Only one face of the channel was patterned (), the other glass was smooth (). In this way it was possible to compare the behavior of the emulsion in proximity of the two different walls. Aqueous solution of polyvinylpyrrolidone was used to make hydrophilic the walls. The concentrated emulsion was prepared of silicone oil (polydimethyl siloxane, ) dispersed in a 50% aqueous glycerine and stabilized by 1 wt% Tetradecyl Trymethyl Ammonium Bromide (TTAB). The concentration of the surfactant was set high enough to prevent coalescence of the droplets, yet low enough to avoid flocculation by depletion Goyon et al. (2008). The emulsion was optically transparent and non-adhesive. The mean diameter of the emulsion was m with a polydispersity index (coefficient of variance) of 0.61, and the volume fraction of the disperse phase was . We measured the (bulk) rheological properties of the emulsion using a rotational rheometer with cone-plate geometry. The flow curve is well described by the Herschel-Bulkley model (see Sec. I of the electronic supplementary information, ESI). Finally, we seeded the continuous phase of the emulsion with a diluted suspension (0.002 wt%) of fluorescent nanoparticles (size of m) to measure the flow profiles using Particle Tracking Velocimetry (PTV) methods Adrian (1991). Tracers were illuminated with a nm laser beam and imaged via an inverted, motorized, microscope equipped with a sCMOS camera (see Sec. I of the ESI). We recorded -stacks of images with steps of droplet diameter . Trajectories crossing the optical field within the depth of focus of the microscope objective were then acquired. The magnitude of the tracers’ velocity at the stack was measured by averaging over hundreds of different tracks, collected by sampling different region of interest (ROIs) throughout the channel. In each flow profile a difference of the wall slip velocities on the rough ( and the smooth ( wall
| (2) |
emerges clearly, being (see Fig. 1-B,C). By increasing the applied pressure drop, the flow profiles partially recover the classical Poiseuille profile, yet they still display a plug region in the center, characteristic of yield stress fluids (low shear regions where ). Additionally, by increasing the pressure drop, the difference of slip velocities
increases (Fig. 1-B).
Figure 1-C shows the flow profiles shifted by for a fixed pressure drop.
By keeping the width of the gap fixed and changing the widths of the post , we observed a systematic evolution in the flow profiles: increasing lead to a smaller fluidization (i.e. velocity gradient) and consequently smaller . We note that the same effect could be observed if was kept fixed and changed, since both for and we must recover a vanishing . From the micro-mechanical point of view, the observed decrease of (in respect to ) can be accounted for the increased number of plastic rearrangements Goyon et al. (2008, 2010): droplets encountering the rough elements (gaps, posts) change their speed and often also their direction causing a scramble with their neighbors, whereas their falter on the smooth wall is rather occasional and almost absent in the plug region (see Fig. 1-A, movies M1 (experiments) and M2 (simulations) of the ESI).
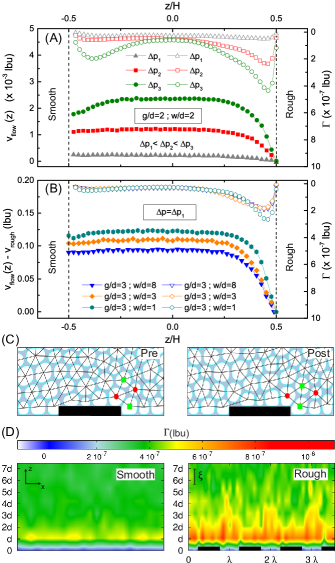
Numerical simulations of a model emulsion based on the lattice Boltzmann methods corroborated this physical picture. The numerical model is in continuity with a number of works by some of the authors Sbragaglia et al. (2012); Dollet et al. (2015); Scagliarini et al. (2016) (see Sec. II of ESI). The simulations allowed to access simultaneously the flow profiles and plastic rearrangements via the analysis of the Delaunay triangulation Delaunay (1934). To this aim we applied a novel procedure to detect rearrangements in geometries with arbitrary complex boundaries Lulli et al. (2016). This made it possible to study the phenomena related to droplets plasticity with unprecedented statistics Dollet et al. (2015); Scagliarini et al. (2016). Shortly, we compared two consecutive configurations by using the corresponding Delaunay triangulations built starting from the centers of mass of the droplets. The triangulation provides the nearest neighbors of each droplet. A topological change takes place every time a link between two droplets disappears, for boundary events, and a new one appears for bulk events (see Fig. 2-C). The observed experimental behaviours illustrated in Fig. 1 were actually well reproduced by our numerical simulations, as reported in Fig. 2-A and Fig. 2-B, where the corresponding rates of plastic rearrangements are also displayed. These figures clearly show that both the asymmetry of the profiles at fixed roughness (Fig. 2-A) and the different fluidization properties at fixed pressure drop (Fig. 2-B) have a direct correspondence to the rate of plastic activity (1), with the latter being more pronounced at high velocity gradient. We also remark Sbragaglia et al. (2012); Scagliarini et al. (2016) that the cooperativity scenario Goyon et al. (2008, 2010) underlies these observations. To highlight this, we performed numerical simulations of a Couette cell at fixed shear stress Scagliarini et al. (2016) (we did not test it experimentally, because there exist specific studies Seth et al. (2012); Paredes et al. (2015)). Indeed, in a Couette cell, we had the possibility to measure directly the effects of cooperativity in the deviations from linearity of the velocity profiles Goyon et al. (2010), as described in Sec. II of the ESI. These simulations reveal that roughness induces a substantial increase of the wall fluidity (see Fig. S2 of the ESI) which decays towards the bulk fluidity according to the theoretical predictions Goyon et al. (2010). The measured value of the cooperativity length was , in agreement with other existing observations Goyon et al. (2008, 2010); Paredes et al. (2015). It is noteworthy to remark that our findings support the idea that the cooperativity length regulates the protrusion into the channel of the plastic activity triggered by the rough wall Goyon et al. (2008, 2010); Paredes et al. (2015), as evident from Fig. 2-D that reports the spatial distribution of plastic rearrangements in the sheared layer close to a smooth and rough walls. For the smooth wall, is relatively small and rather homogeneous along the flow ( direction); this contrasts the case of a rough wall, where is enhanced, with a periodic modulation dictated by the roughness.
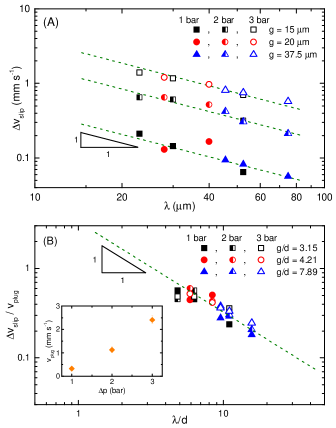
One expects that the slip velocity on the smooth wall is constant for a given pressure drop and independent of the periodicity of the rough wall on the other side of the channel. On the other hand, surface roughness (depending on its structure) strongly affects plastic rearrangements, thus the slip conditions (see Fig. S1 in the ESI). Therefore, to further characterize the effect of roughness periodicity and quantify the roughness-induced fluidization we considered as a function of . Results show clear evidence that, for a fixed pressure drop, scales with the periodicity of the roughness (see Fig. 3-A)
| (3) |
where the prefactor is found to increase with the applied pressure drop. This may be taken into account by further normalizing for a characteristic velocity dependent on the pressure drop. To this aim, we calculated the maximum (plug) velocity by averaging the measured velocities in the 8-10 droplet diameter region in the center of the channels (plug region). Upon rescaling with (see Fig. 3-B), the individual scaling curves nicely collapse into a single master curve (see Fig. 3-B). We note that, since plastic rearrangements and cooperativity effects depend on the volume fraction Goyon et al. (2008, 2010), this effect may be less pronounced at lower concentrations of the emulsion.
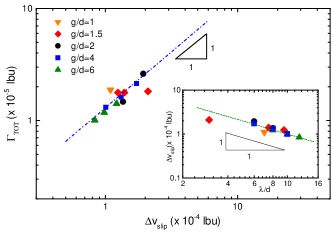
Finally, Fig. 4 shows the relation between the numerical and the rate of plastic rearrangements. Again simulations in a Couette cell for both smooth and rough channels were performed. The imposed (nominal) shear was kept constant by applying a fixed velocity at the wall in , while changing the nature (i.e. smooth or rough) of the wall in (see Sec. II of the ESI). The results of numerical simulations confirm the observed experimental scaling (inset of Fig. 4). More important, we computed the increase of the rate of plastic rearrangements (due to the rough wall) in respect to the case with a smooth wall, , and observed a linear relation between and . This result is highly non trivial Bouzid et al. (2015): it is not only a further confirmation that the roughness-induced fluidization is due to plastic rearrangements, but it also supports one of the key results of KEP Bocquet et al. (2009) which we carefully verified and tested in presence of rough walls with variable widths and gaps.
In summary, we have observed both experimentally and numerically that roughness-induced fluidization, i.e. the enhanced plastic activity induced by rough walls Goyon et al. (2008, 2010), can be tailored upon designing a micro-structured surface to control the motion of SGM in microfluidic channels. This is due to the modulated plastic activity triggered by the roughness, and results in a simple, yet non trivial scaling relation for the fluidization as a function of the roughness periodicity. This scenario is observed for periodicity patterns spanning more than one decade in droplets diameters and for gaps larger than the cooperativity length ().
The research leading to these results has received funding from the European Research Council under the European Community’s Seventh Framework Programme (FP7/2007-2013)/ERC Grant Agreement No. 279004. The authors also thank Giovanni Lucchetta and Julie Goyon for useful advices. PG acknowledges founding by the European Research Council Starting Grant 279647.
References
- Kunii and Levenspiel (2013) D. Kunii and O. Levenspiel, Fluidization engineering (Elsevier, 2013).
- Meeker et al. (2004) S. P. Meeker, R. T. Bonnecaze, and M. Cloitre, Journal of Rheology (1978-present) 48, 1295 (2004).
- Denkov et al. (2008) N. Denkov, S. Tcholakova, K. Golemanov, K. Ananthapadmanabhan, and A. Lips, Physical Review Letters 100, 138301 (2008).
- Tabilo-Munizaga and Barbosa-Cánovas (2005) G. Tabilo-Munizaga and G. V. Barbosa-Cánovas, Journal of Food Engineering 67, 147 (2005).
- Larson (1999) R. G. Larson, The Structure and Rheology of Complex Fluids (Oxford University Press, 1999).
- Coussot (2005) P. Coussot, Rheometry of Pastes, Suspensions, and Granular Materials (Wiley-Interscience, 2005).
- Cantat et al. (2013) I. Cantat, S. Cohen-Addad, F. Elias, F. Graner, R. Hohler, O. Pitois, F. Rouyer, and Saint-Jalmes, Foams: Structure and Dynamic (OUP Oxford, 2013).
- Mason (1999) T. G. Mason, Current Opinion in Colloid & Interface Science 4, 231 (1999).
- Angell (1995) C. A. Angell, Science 267, 1924 (1995).
- Mason et al. (1996) T. Mason, J. Bibette, and D. Weitz, Journal of Colloid and Interface Science 179, 439 (1996).
- Scheffold et al. (2014) F. Scheffold, J. N. Wilking, J. Haberko, F. Cardinaux, and T. G. Mason, Soft matter 10, 5040 (2014).
- Falk and Langer (1998) M. Falk and J. Langer, Physical Review E 57, 7192 (1998).
- Varnik et al. (2004) F. Varnik, L. Bocquet, and J.-L. Barrat, Jour. Chem. Phys. 120, 2788 (2004).
- Varnik et al. (2003) F. Varnik, L. Bocquet, J.-L. Barrat, and L. Berthier, Phys. Rev. Lett. 90, 095702 (2003).
- Pouliquen and Forterre (2009) O. Pouliquen and Y. Forterre, Philosophical Transactions of the Royal Society A: Mathematical, Physical and Engineering Sciences 367, 5091 (2009).
- Bocquet et al. (2009) L. Bocquet, A. Colin, and A. Ajdari, Phys. Rev. Lett. 103, 036001 (2009).
- Sollich and Cates (2012) P. Sollich and M. E. Cates, Phys. Rev. E 85, 031127 (2012).
- Jop et al. (2012) P. Jop, V. Mansard, P. Chaudhuri, L. Bocquet, and A. Colin, Phys. Rev. Lett. 108, 148301 (2012).
- Desmond and Weeks (2015) K. W. Desmond and E. Weeks, Phys. Rev. Lett. 115, 098302 (2015).
- Benzi et al. (2016) R. Benzi, M. Sbragaglia, S. Succi, M. Bernaschi, and F. Toschi, Soft Matter 2, 514 (2016).
- Goyon et al. (2008) J. Goyon, A. Colin, G. Ovarlez, A. Ajdari, and L. Bocquet, Nature 454, 84 (2008).
- Goyon et al. (2010) J. Goyon, A. Colin, G. Ovarlez, A. Ajdari, and L. Bocquet, Soft Matter 6, 2668 (2010).
- Seth et al. (2012) J. Seth, F. Locatelli-Champagne, C. Monti, R. Bonnecaze, and M. Cloitre, Soft Matter 8, 140 (2012).
- Mansard et al. (2013) V. Mansard, A. Colin, P. Chaudhuri, and L. Bocquet, Soft Matter 9, 7489 (2013).
- Mansard et al. (2014) V. Mansard, L. Bocquet, and A. Colin, Soft Matter 10, 6984 (2014).
- Paredes et al. (2015) J. Paredes, N. Shahidzadeh, and D. Bonn, Phys. Rev. E 92, 042313 (2015).
- Katgert et al. (2010) G. Katgert, B. P. Tighe, M. B. Mobius, and M. Van Hecke, Europhys. Lett. 90, 54002 (2010).
- Dollet et al. (2015) B. Dollet, A. Scagliarini, and M. Sbragaglia, Journal of Fluid Mechanics 766, 556 (2015).
- Geraud et al. (2013) B. Geraud, L. Bocquet, and C. Barentin, Eur. Phys. J. E 36, 30 (2013).
- Liu and Nagel (1998) A. J. Liu and S. R. Nagel, Nature 396, 21 (1998).
- Berthier et al. (2005) L. Berthier, G. Biroli, J.-P. Bouchaud, L. Cipelletti, D. El Masri, D. L’Hôte, F. Ladieu, and M. Pierno, Science 310, 1797 (2005).
- Brambilla et al. (2010) G. Brambilla, D. El Masri, M. Pierno, L. Berthier, L. Cipelletti, G. Petekidis, and A. Schofield, Phys. Rev. Lett. 104, 169602 (2010).
- Ikeda et al. (2012) A. Ikeda, L. Berthier, and P. Sollich, Physical Review Letters 109, 018301 (2012).
- Bouzid et al. (2015) M. Bouzid, A. Izzet, M. Trulsson, E. Clement, P. Claudin, and B. Andreotti, Eur. Phys. J. E 38, 125 (2015).
- Scagliarini et al. (2016) A. Scagliarini, M. Lulli, M. Sbragaglia, and M. Bernaschi, Europhys. Lett. 114, 64003 (2016).
- Ferraro et al. (2012) D. Ferraro, C. Semprebon, T. Tóth, E. Locatelli, M. Pierno, G. Mistura, and M. Brinkmann, Langmuir 28, 13919 (2012).
- Brigo et al. (2008) L. Brigo, M. Natali, M. Pierno, F. Mammano, C. Sada, G. Fois, A. Pozzato, S. Dal Zilio, M. Tormen, and G. Mistura, Journal of Physics: Condensed Matter 20, 354016 (2008).
- Adrian (1991) R. J. Adrian, Annual review of fluid mechanics 23, 261 (1991).
- Sbragaglia et al. (2012) M. Sbragaglia, R. Benzi, M. Bernaschi, and S. Succi, Soft Matter 8, 10773 (2012).
- Delaunay (1934) B. Delaunay, Bulletin de l’Academie des Sciences de l’URSS,Classe des sciences mathematiques et naturelles 6, 443 (1934).
- Lulli et al. (2016) M. Lulli, M. Bernaschi, and M. Sbragaglia, arxiv.org/abs/1607.00908 (2016).