Lattice QCD results on cumulant ratios at freeze-out
Abstract
Ratios of cumulants of net proton-number fluctuations measured by the STAR Collaboration show strong deviations from a skellam distribution, which should describe thermal properties of cumulant ratios, if proton-number fluctuations are generated in equilibrium and a hadron resonance gas (HRG) model would provide a suitable description of thermodynamics at the freeze-out temperature. We present some results on order cumulants entering the calculation of the QCD equation of state at non-zero values of the baryon chemical potential () and discuss limitations on the applicability of HRG thermodynamics deduced from a comparison between QCD and HRG model calculations of cumulants of conserved charge fluctuations. We show that basic features of the -dependence of skewness and kurtosis ratios of net proton-number fluctuations measured by the STAR Collaboration resemble those expected from a QCD calculation of the corresponding net baryon-number cumulant ratios.
1 Introduction
A major goal in current experimental and theoretical studies of the thermodynamics of strong interaction matter is the exploration of its phase diagram. The hope is to find evidence for the existence of a second order phase transition point – the chiral critical point (CCP) – located at some value of the chemical potential, [1]. This would be the starting point for a line of first order phase transitions at larger values of the baryon chemical potential .
At RHIC a dedicated research program – the beam energy scan (BES) – has been established that seeks evidence for the existence and location of the CCP. By varying the beam energy properties of matter in a regime of temperatures () up to about three times the transition temperature, MeV [2, 3], and baryon chemical potential up to can be probed. It is generally expected that conserved charge fluctuations, which are generated close to, or at the freeze-out temperature, , can provide insight into the existence and location of the CCP. An important prerequisite for such studies, however, is to understand the thermodynamics of hot and dense matter in the crossover region and, in particular, close to freeze-out in QCD.
In the following we will point out the importance of characterizing this regime in terms of QCD rather than hadron resonance gas (HRG) model calculations, which are quite successful in approximating QCD thermodynamics at sufficiently low temperatures, but definitely fail to capture important aspects of QCD thermodynamics visible in conserved charge fluctuations at temperatures MeV.
2 Energy density in the crossover region
At small values of the QCD transition is not a true phase transition but a smooth transition from the low- hadronic to the high- partonic regime. This crossover transition does not happen at a well defined temperature. However, it can be characterized by pseudo-critical temperatures, i.e. temperatures that reflect characteristic features of e.g. fluctuation observables, which are guaranteed to converge to the true critical temperature in the chiral limit. One such observable is the chiral susceptibility, , the derivative of the chiral condensate with respect to quark mass. The location of the maximum of defines a pseudo-critical temperature. This has been obtained in lattice QCD calculations, MeV [3].
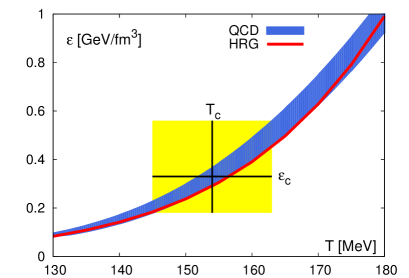
In Fig. 1 (left) we show results for the energy density () obtained from lattice QCD calculations with physical strange and light quark masses [6]. The temperature range covered by current uncertainties in corresponds to GeV/fm3. Unfortunately, this energy density range is still quite large. In fact, it covers practically all energy scales of interest. While the central value corresponds to the close packing limit of nucleons with a radius fm, the lower limit is close to the energy density of nuclear matter ( GeV/fm3) and the upper limit is larger than the energy density inside a nucleon ( GeV/fm3).
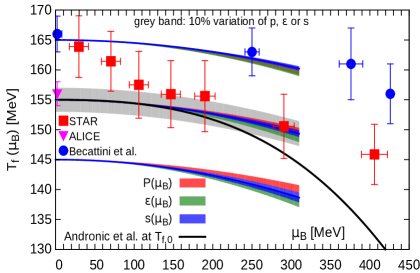
Using the Taylor expansion of the QCD equation of state one can follow lines of constant physics in the - plane. In Fig. 1 (right) we show lines of constant pressure (), energy density () and entropy density () obtained in order . Corrections to this are small for . The three sets of curves, characterizing the current uncertainty band on , correspond to , and GeV/fm3. Given the current uncertainties on it is not too surprising that all results on freeze-out parameters obtained from the analysis of particle yields at the LHC [8] and RHIC [7] and even the rather large hadronization temperatures extracted in Ref. [9] allow to state that ”hadronization and freeze-out of hadrons occur close to, or in the QCD crossover region” (see Fig. 1 (right)) even though the temperatures in question are quite different, e.g. ranging from 155 MeV to 165 MeV at . They refer to environments, in which hadronization and freeze-out may take place, that are quite different, e.g. the energy and entropy density may differ by a factor 2. Lattice QCD calculations provide a wealth of other observables, e.g. higher order cumulants of conserved charge fluctuations, that are sensitive to the changes in physical properties of hot and dense matter that occur in this temperature interval. Understanding these changes also is of importance for our understanding of freeze-out conditions determined with the BES at RHIC as well as at the LHC.
3 Cumulants of conserved charge fluctuations
At the energy density calculated in QCD as well as HRG models shown in Fig. 1 (left) varies smoothly as function of temperature when traversing the crossover region. Even quantitatively the latter is in quite good agreement with QCD calculations, although it has been pointed out that the QCD energy density is systematically larger, which may be taken as evidence for additional hadronic degrees of freedom contributing to bulk thermodynamics close to [4, 5]. Nonetheless, HRG model calculations seem to describe bulk thermodynamics quite well even at temperatures as large as MeV. In fact, the situation is similar even for the specific heat [6]. Does this mean that the strongly interacting medium can be described in terms of hadronic degrees of freedom in the entire crossover region and even above?
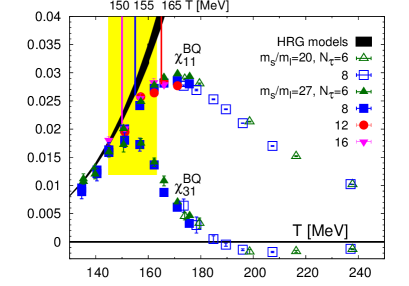
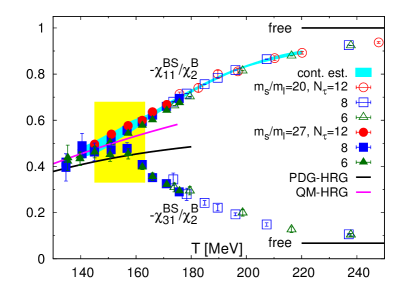
Conserved charge fluctuations and correlations between them provide plenty of evidence that thermodynamics described in terms of hadronic degrees of freedom breaks down close to . In particular, higher order cumulants are quite different from conventional HRG model calculations. We show in Fig. 2 two examples of this. The left hand figure shows second and fourth order cumulants of net baryon-number and net electric charge fluctuations,
| (1) |
with and . In the infinite temperature, ideal quark gas limit the net electric charge of 3-flavor QCD vanishes. Thus and will both approach zero while these correlations will keep increasing exponentially in HRG model calculations with point-like, non interacting hadrons.
At low temperature all hadronic degrees of freedom will either carry baryon number or . HRG model calculations thus give . It is obvious from Fig. 2 (left) that this relation no longer holds for MeV. Also starts deviating from HRG model calculations at MeV. A similar pattern is found for second and fourth order cumulants of net baryon-number and net strangeness correlations shown in Fig. 2 (right). Various other combinations of and order cumulants have been constructed that make it apparent that HRG models with point-like non-interacting hadrons are not suitable for describing QCD thermodynamics at temperatures [11]. In fact, this also has been verified for net baryon-number and net charm correlations [12] which strongly suggests that also the thermodynamics of open charm baryons cannot be described by HRG models above .
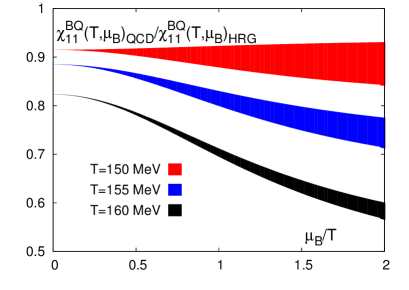
A consequence of the early deviation of order cumulants from corresponding HRG calculations also is that differences between QCD and HRG calculations increase with increasing value of the chemical potential and will show up already in order cumulants. This is shown in Fig. 3 (left) for the correlation between net baryon-number and net electric charge evaluated up to ,
| (2) |
Obviously QCD and HRG calculations differ significantly at already for MeV.
4 Taylor expansions for skewness and kurtosis ratios
In HRG models with point-like non-interacting hadrons the distribution of net baryon number fluctuations is given by a skellam distribution. This leads to quite simple properties of higher order cumulants. In particular, the skewness ratio and the kurtosis ratio should both be equal to unity at all values of . However, as discussed in the previous section this cannot be expected to hold in QCD at temperatures above where cumulants start to deviate significantly from HRG model calculations. The distribution of net baryon number fluctuations thus is e.g. not a simple skellam distribution. QCD calculations of the skewness and kurtosis ratios yield
| (3) | |||||
| (4) |
with and denoting the leading order expansion coefficients of and in terms of that result from imposing the strangeness neutrality constraint and a fixed electric charge to baryon number ratio, . Results for the leading order expansion coefficients, defined in Eqs. 3 and 4, are shown in Fig. 3 (right). While at MeV the kurtosis ratio at is still close to unity, , it strongly deviates from unity for MeV, giving . In view of these differences it also is not obvious that the skewness and kurtosis ratios will still coincide in a QCD calculation. However, as can be seen from Eqs. 3 and 4 at the leading order results will always be identical, if , irrespective of the size of deviation from the skellam limit. For non-zero and the skewness and kurtosis ratios will differ. Nonetheless, as can be seen from the insertion in Fig. 3 (right) this difference is small for all temperatures of interest. QCD thus predicts that the skewness and kurtosis ratios will approach each other in the limit . This, however, changes for .
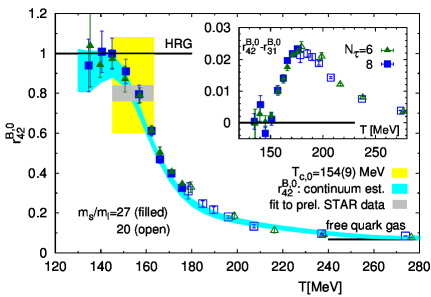
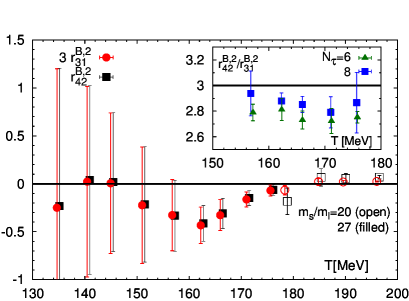
At next-to-leading order (NLO) the expansion coefficients and need to be calculated. This is computationally difficult, because order cumulants need to be evaluated. Current results for and are shown in Fig. 4 (left). Although errors are still large, it is apparent that these expansion coefficients are negative for and that is about three times larger than . This has been reported by us earlier [13]. It thus is expected that the skewness and kurtosis ratios, which are almost identical at , will start to differ for . As the expansion coefficients are negative, will drop faster than .

An additional subtlety in the analysis of the -dependence of the skewness and kurtosis ratios is that these need to be evaluated at a (freeze-out) temperature that changes with . This requires an additional Taylor expansion of the ratios introduced in Eqs. 3 and 4. Assuming that freeze-out happens along a line of constant physics described either by constant pressure, energy density or entropy density, i.e. the lines shown in Fig. 1, these contributions can be evaluated using the Taylor expansion of the pressure [16], changing to . It turns out that the additional contributions increase the ratio somewhat as shown in Fig. 4 (right).
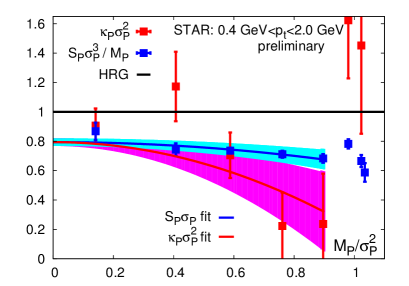
5 The STAR data on net proton-number skewness and kurtosis ratios
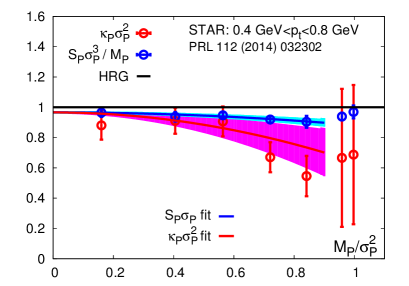
The STAR collaboration has measured the skewness ratio and kurtosis ratio of net proton-number fluctuations [14, 15]. Obviously these cumulant ratios cannot directly be compared to QCD results on net baryon-number fluctuations. Already the strong sensitivity on the transverse momentum range used in the analysis, which is clearly visible in the data published so far by the STAR Collaboration (Fig. 5 (left) and (right), respectively), emphasizes that there is need for better understanding of various effects that enter the experimental analysis of higher order cumulants. Nonetheless, it is striking that the published as well as the new preliminary data on skewness and kurtosis ratios resemble all the features we expect to show up in equilibrium thermodynamics of QCD. The ratios (i) are smaller than unity, (ii) they seem to coincide in the limit , (iii) they have a negative slope with increasing and (iv) the kurtosis ratio drops faster than the skewness ratio. In fact, a combined quadratic fit to these ratios, performed for all data obtained at beam energies GeV/fm3 and imposing the constraint , yields for the ratio of slope parameters , which is in good agreement with the NLO QCD result shown in Fig. 4 (left). These fits are shown in Fig. 5.
This work has been partially supported through the U.S. Department of Energy under Contract No. DE-SC0012704 and within the framework of the Beam Energy Scan Theory (BEST) Topical Collaboration, and the German Bundesministerium für Bildung und Forschung (BMBF) under grant no. 05P15PBCAA.
References
References
- [1] H. T. Ding, F. Karsch and S. Mukherjee, Int. J. Mod. Phys. E 24, 1530007 (2015) [arXiv:1504.05274 [hep-lat]].
- [2] Y. Aoki et al., JHEP 0906, 088 (2009) [arXiv:0903.4155 [hep-lat]].
- [3] A. Bazavov et al., Phys. Rev. D 85, 054503 (2012) [arXiv:1111.1710 [hep-lat]].
- [4] A. Majumder and B. Muller, Phys. Rev. Lett. 105, 252002 (2010) [arXiv:1008.1747 [hep-ph]].
- [5] A. Bazavov et al., Phys. Rev. Lett. 113, 072001 (2014) [arXiv:1404.6511 [hep-lat]].
- [6] A. Bazavov et al. [HotQCD Collaboration], Phys. Rev. D 90, 094503 (2014) [arXiv:1407.6387 [hep-lat]].
- [7] S. Das [STAR Collaboration], EPJ Web Conf. 90, 08007 (2015) [arXiv:1412.0499 [nucl-ex]].
- [8] M. Floris, Nucl. Phys. A 931, 103 (2014) [arXiv:1408.6403 [nucl-ex]].
- [9] F. Becattini, J. Steinheimer, R. Stock and M. Bleicher, arXiv:1605.09694 [nucl-th].
-
[10]
A. Andronic, P. Braun-Munzinger and J. Stachel,
Phys. Lett. B 673, 142 (2009)
Erratum: [Phys. Lett. B 678, 516 (2009)] [arXiv:0812.1186 [nucl-th]]. - [11] A. Bazavov et al., Phys. Rev. Lett. 111, 082301 (2013) [arXiv:1304.7220 [hep-lat]].
- [12] A. Bazavov et al., Phys. Lett. B 737, 210 (2014) [arXiv:1404.4043 [hep-lat]].
- [13] F. Karsch et al., arXiv:1512.06987 [hep-lat].
- [14] M. M. Aggarwal et al. [STAR Collaboration], Phys. Rev. Lett. 105, 022302 (2010).
- [15] X. Luo [STAR Collaboration], PoS CPOD 2014, 019 (2015) [arXiv:1503.02558 [nucl-ex]].
- [16] Bielefeld-BNL-CCNU Collaboration, in preparation.