Vortex reconnections and rebounds in trapped atomic Bose–Einstein condensates
Abstract
Reconnections and interactions of filamentary coherent structures play a fundamental role in the dynamics of fluids, redistributing energy and helicity among the length scales and inducing fine-scale turbulent mixing. Unlike ordinary fluids, where vorticity is a continuous field, in quantum fluids vorticity is concentrated into discrete (quantized) vortex lines turning vortex reconnections into isolated events, making it conceptually easier to study. Here we report experimental and numerical observations of three-dimensional quantum vortex interactions in a cigar-shaped atomic Bose–Einstein Condensate. In addition to standard reconnections, already numerically and experimentally observed in homogeneous systems away from boundaries, we show that double reconnections, rebounds and ejections can also occur as a consequence of the non-homogeneous, confined nature of the system.
I Introduction
The interaction and reconnection of filaments are key aspects in the description of the dynamics of fluids Kida and Takaoka (1994); Barenghi et al. (2001); Schwarz (1988), plasmas Priest and Forbes (2007); Che et al. (2011); Cirtain et al. (2013), nematic liquid crystals Chuang et al. (1991), macromolecules Sumners (1995) (including DNA Vazques and Sumners (2004)) and optical beams Dennis et al. (2010); Berry and Dennis (2012). In quantum fluids, vortices are topological defects of the system’s order parameter, around which the circulation of the velocity field is quantized Onsager (1949); Feynman (1955); Vinen (1961); Donnelly (1991). Their discrete filamentary nature makes quantum fluids an ideal setting for the study of vortex interactions and reconnections. In particular, reconnections trigger a turbulent energy cascade Barenghi et al. (2014) in which vortex lines self-organize in bundles Baggaley et al. (2012) creating the same Kolmogorov distribution of kinetic energy over the length scales, signature of a cascade mechanism which is observed in ordinary turbulence Nore et al. (1997); Maurer and Tabeling (1998); Skrbek and Sreenivasan (2012); Barenghi et al. (2014). Cascade processes are central in turbulent motions. A related cascade of wave-like excitations was in fact recently observed in the momentum distribution Navon et al. (2016), with an exponent consistent with predictions of wave-turbulence theory Zakharov et al. (2012). Reconnection events also impact on the evolution of the flow’s topology Kleckner et al. (2016), redistributing helicity among length scales Clark di Leoni et al. (2016); Scheeler et al. (2014). Finally, in the low-temperature limit, reconnections are the ultimate process of dissipation of superfluid kinetic energy since they trigger a Kelvin wave cascade Kozik and Svistunov (2004, 2005) that turns incompressible kinetic energy into acoustic modes Leadbeater et al. (2001), hence heating. Previous experimental Bewley et al. (2008); Fonda et al. (2014), theoretical Nazarenko and West (2003) and numerical Koplik and Levine (1993); de Waele and Aarts (1994); Tebbs et al. (2011); Zuccher et al. (2012); Kerr (2011); Villois et al. (2016a); Rorai et al. (2016) studies of reconnections have been performed in homogeneous systems away from boundaries.
Here we focus on elongated Bose–Einstein condensates (BECs) of ultracold atoms confined by magnetic harmonic potentials, ideal systems which allow for different regimes of three-dimensional (3D) vortex-vortex interactions in the close presence of boundaries. Anisotropic boundaries induce vortical filaments to preferentially align along the shortest direction, minimising energy. In flat, cylindrically symmetric, disk-shaped condensates, vortices are the shortest when aligned along the axis of symmetry, moving along two-dimensional trajectories clockwise or anti-clockwise, depending on their sign Anderson et al. (2000); Weiler et al. (2008); Freilich et al. (2010); Neely et al. (2010); Torres et al. (2011); Navarro et al. (2013). Instead, vortices in cylindrically symmetric, cigar-shaped condensates are the shortest when they lie on radial planes. Moreover, the boundaries affect the structure of the vortical flow Brand and Reinhardt (2002); Komineas and Papanicolaou (2003); Donadello et al. (2014); Tylutki et al. (2015) in such a way that two vortices only interact when their minimum distance is within a range of the order of the transverse size of the condensate.
In the present work, an innovative imaging technique, exploiting self-interference effects of outcoupled atoms, is introduced in order to extract both the position and orientation of 3D vortex lines from a temporal sequence of absorption images. We then combine experiments and numerical Gross-Pitaevskii (GP) simulations to study the interaction between two vortex lines approaching at various relative speeds and angles. Our experiments and simulations show that the interaction between vortex lines in a finite system is rather different from the one in infinite uniform superfluids. Boundary-induced effects, such as rebounds, double reconnections, and ejections, are here discussed in details. These types of processes may play an important role in the dynamics of trapped condensates in multi-vortex and turbulent-like configurations, and, on a wider perspective, they can represent novel keys for better understanding the behavior of superfluids near boundaries.
II Experiment
II.1 Preparation of BECs with vortices
Experimentally, we confine sodium atoms in an elongated cigar-shaped harmonic magnetic trap
with axial and radial frequencies Hz and Hz,
respectively. By means of a radio-frequency forced evaporation the cold atomic sample undergoes
the BEC transition and, in the end, condensates containing about atoms
and a negligible thermal fraction ( nK, nK) are obtained. Thanks to the
Kibble–Zurek mechanism Kibble (1976); Zurek (1996) the temperature quench through the BEC transition Weiler et al. (2008); Freilich et al. (2010); Lamporesi et al. (2013); Donadello et al. (2016) produces different phase domains in the order parameter
of the system that quickly evolve into topological defects. In our geometry, these defects are vortex lines mainly
oriented in the transverse direction, as those predicted in Brand and Reinhardt (2002); Komineas and Papanicolaou (2003) and characterized in
Donadello et al. (2014). Similar vortices can be obtained as decay products of phase imprinted dark solitons in
a BEC Becker et al. (2013) or a Fermi superfluid gas Ku et al. (2014, 2016). Here we use a cooling rate of K/s
in order to produce, on average, two vortices in each condensate at the time when the observation starts,
about ms after the phase transition.
Such vortices move in the non-rotating condensate and can be directly imaged in
real-time Freilich et al. (2010); Ramanathan et al. (2012); Serafini et al. (2015).
In comparison, individual vortex visualisation in superfluid helium is more intrusive,
requiring tracer particles whose diameter is about times larger than the
vortex core Bewley et al. (2006).
II.2 Sample extraction and real-time imaging
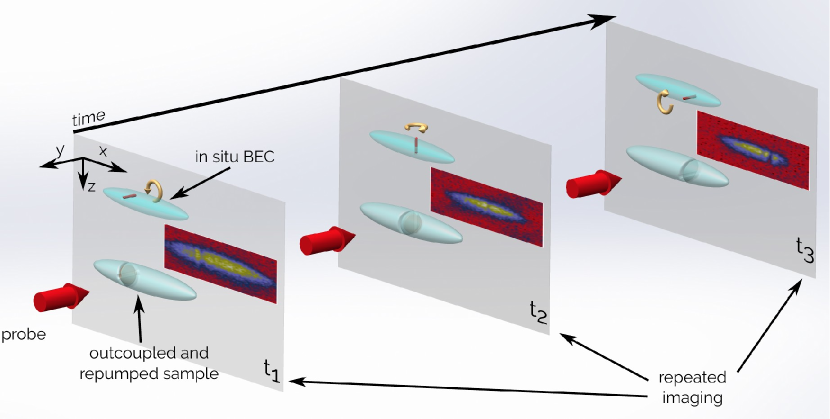
A new imaging method allows us to follow the vortex dynamics in real-time, as sketched in Fig. 1. Similar to Freilich et al. (2010); Ramanathan et al. (2012), a small sample of the atomic system ( atoms) is repeatedly extracted from the BEC every 12 ms (up to 75 times). The outcoupled atoms freely expand and fall under the effect of gravity. Each partial extraction is implemented by coupling the trapped state to the non-magnetic one with a radio frequency (rf) field. The energy difference between the two states is spatially dependent because of the inhomogeneity of the trapping potential (see Appendix A).
The novelty of our technique is represented by the fact that the rf field is frequency-swept linearly in time in order to match the resonant condition at different positions throughout the BEC, from top to bottom. An important point to note is that the phase of the released atoms evolves more slowly because they do not feel the trapping potential. As a consequence, the wave function of the outcoupled atoms experiences constructive or destructive self-interference effects, depending on the phase difference accumulated between the early-released (upper) and late-released (lower) atoms, and how this relates to the in situ phase on different sides of the vortex core. We use the GP equation to simulate the radio frequency extraction in order to determine how a vortex with given position and orientation in the trapped BEC manifests itself in the observed density distribution of the outcoupled atoms after expansion (see Appendix C).
A microwave field remains on to transfer the extracted atoms from to , which is detectable with the probe light. The resonant condition for the transfer is matched at m below the trapped BEC, far enough to leave it unaffected. We probe the extracted atoms via standard absorption imaging after ms of total time of flight at m below the trap center. Such a time of flight is enough for vortices to become visible with our imaging resolution.
II.3 Data analysis
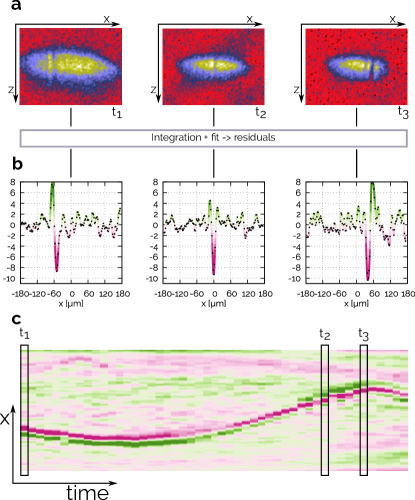
Each absorption image (Fig. 2a) is integrated radially along the axis and the axial profile is obtained. By fitting the latter, we calculate the density residuals (see Fig. 2b). This procedure is performed on each extraction and then the full temporal sequence is reconstructed in order to follow the vortex trajectories in the trapped condensate, as in Fig. 2c.
Thanks to the above mentioned self-interference effect, if a vortex is present, the density residuals show a strong local deviation from the unperturbed distribution, as in Fig. 2b, and the fit allows us to extract information on the vortex axial position, as well as on its orientation in the radial plane at any given time (see Appendix C for details).
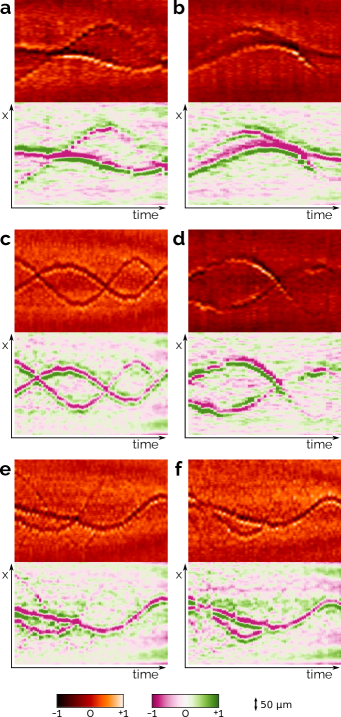
Figure 3 shows examples of the temporal evolution of the density-residual profiles in BECs containing two vortices. Two different color palettes are used in order to extract different pieces of information. The red palette best highlights the trajectory contrast. One can track the vortex axial location in time and hence determine the orbit amplitude and the axial velocity. Notice that in some cases, very faint trajectories (corresponding to vortices close to the BEC surface) can also be seen. It is also possible to understand how the vortex line is oriented in the radial plane and how it rotates about the long axis of the condensate. The diverging pink-green palette helps to visualize the shape of the density modulation from which one can better track the vortex orientation in time. From numerical simulations we infer that, at least when the orbiting parameter is not too large, the vorticity points along if the interference pattern is green-pink along (see row (b) in Fig. 2); its anti-vortex configuration, oriented toward , corresponds to a pink-green pattern; the symmetric pattern green-pink-green is obtained when the vortex is aligned perpendicularly to the imaging direction, a vortex oriented along providing the same density residual as one oriented along .
III Numerical simulations
In order to gain closer insight into vortex interactions, we perform numerical simulations by using the Gross–Pitaevskii equation Pitaevskii and Stringari (2016); Dalfovo et al. (1999) for a BEC at . Temperature effects are expected to be small. In a previous work Serafini et al. (2015), we have already observed that the dynamics of single vortices is very weakly affected by thermal excitations. This is expected to be true also for vortex-vortex interaction processes occurring in the central region of our BEC, where the thermal density is negligible. There is also evidence that thermal excitations do not affect the rapid motion of vortex lines during the reconnections Allen et al. (2014).
We track the vortices by employing an algorithm based on the pseudo-vorticity vector, achieving sub-grid resolution (see Appendix B). Since the experimental BECs are too large for our computational resources, we simulate smaller BECs ( atoms); this implies a reduction of the ratio by a factor of three, where is the healing length and is the transverse Thomas–Fermi radius. However, such a difference does not affect the qualitative comparison between experiment and simulations.
If we imprint a single straight vortex line off-center on a radial plane, we find that it orbits around the center of the condensate Anderson et al. (2000); Freilich et al. (2010) along an elliptical orbit which is orthogonal to the vortex line itself. The orbit, which is a trajectory of constant energy Svidzinsky and Fetter (2000) and an isoline of the trapping potential, is uniquely determined by the orbit parameter , where and correspond to the radial and axial semi-axes of the ellipse, while is the axial Thomas–Fermi radius. The orbital period is maximum when the vortex moves on a very small orbit () and corresponds to Serafini et al. (2015), while it decreases with increasing Svidzinsky and Fetter (2000); Lundh and Ao (2000); Sheehy and Radzihovsky (2004); Fetter (2009).
If instead we imprint two transverse vortices in a given BEC, we find that the evolution can be divided into two stages. In the first stage, when the axial separation of the vortices is larger than , the vortices move almost independently; in the second stage, when the axial separation becomes smaller than , we observe a significant interaction which seems to be determined mainly by the relative orientation and velocity when they start interacting.
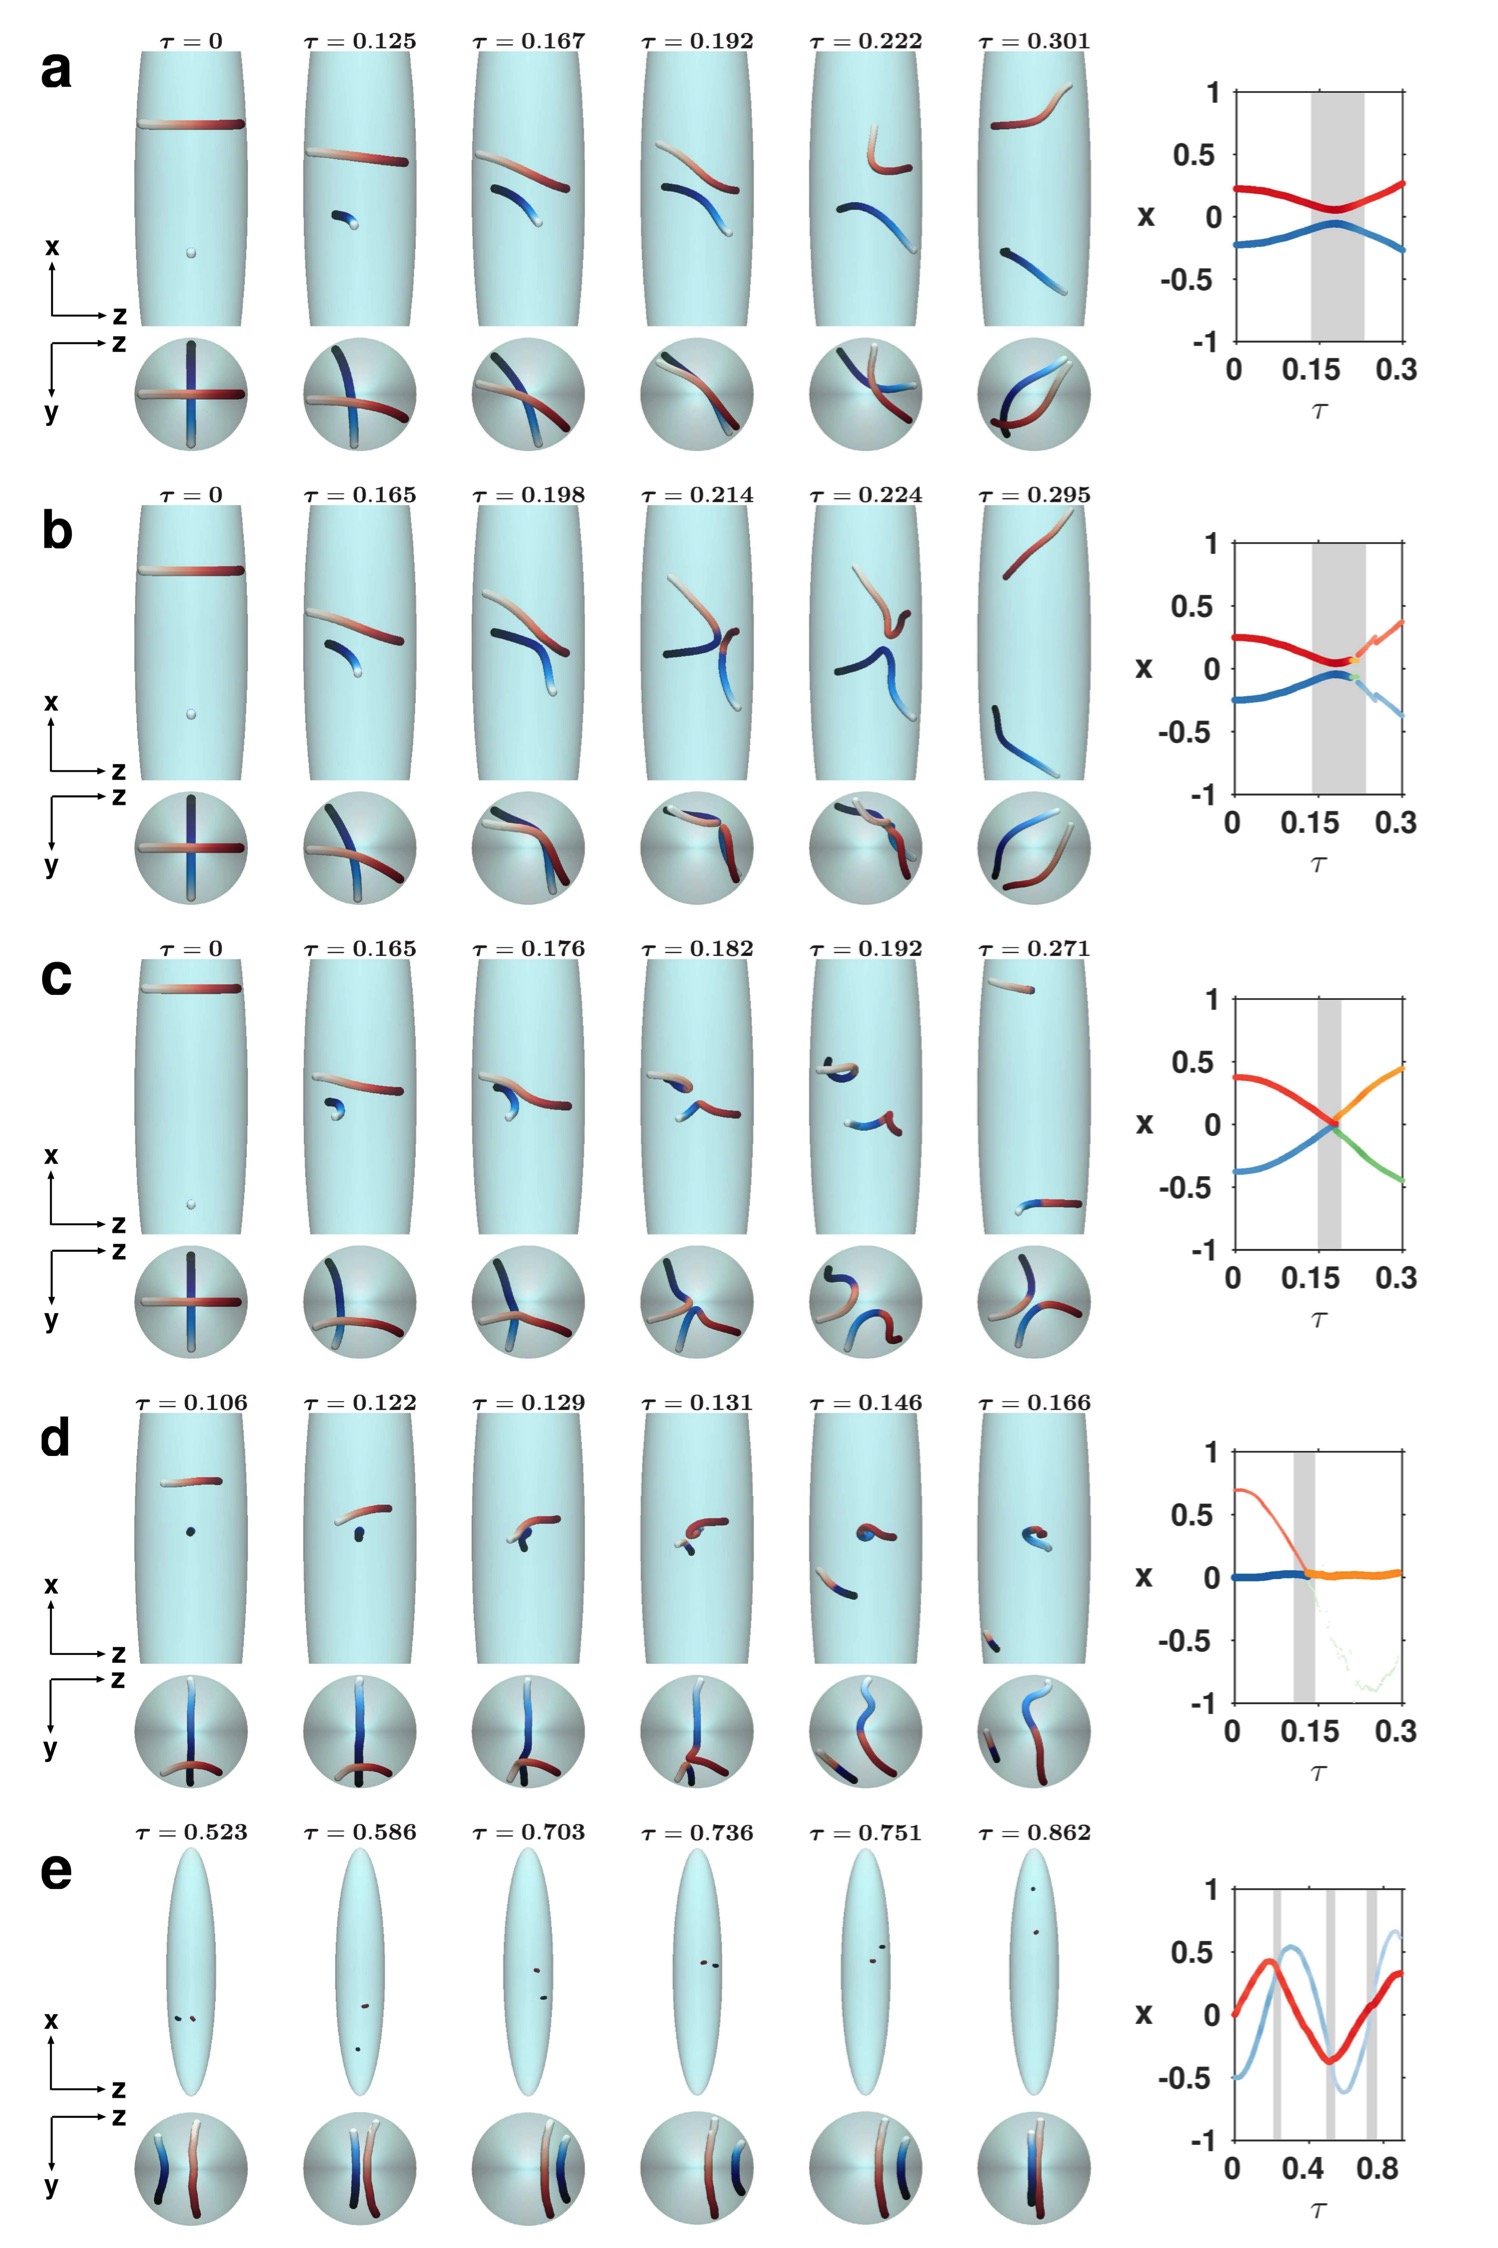
We first perform simulations in which two orthogonal vortices are initially imprinted in radial planes at opposite axial positions , see Figs. 4a-c (orthogonality is chosen because of its maximal dissimilarity with respect to flat 2D systems). Different values are chosen, corresponding to different orbit parameters and hence to different impact velocities. The early stage can be described as the combination of two single-vortex motions on mutually perpendicular elliptical orbits.
In fact, in an elongated condensate, the superfluid flow of each vortex becomes negligible at distances of the order of from the line, as can be verified by solving the stationary GP equation. This means that when two vortices are at distances larger than , they behave as non-interacting objects, as indeed observed in time-dependent GP simulations. This is crucial in order to interpret and classify the vortex-vortex interaction as a collision with well-defined initial and final velocities and orientations. In a different 3D geometry, it would be very difficult to define and control a global “relative velocity and orientation” of a vortex line. If a non-rotating condensate is confined in a spherical potential, or is uniform, for instance, the distance between two vortices and their relative velocity and orientation could be defined only locally: vortices do not possess a preferred orientation, they can be easily bent, and each piece of vortex is affected by a long-range interaction with all other vortices in the condensate. Our geometry instead naturally provides well-defined collision events, such as reconnecting or bouncing lines, occurring in a narrow interaction region.
Only when the minimum distance between the vortices becomes of the order of , the vortices start rotating in the radial plane, attempting to arrange themselves in the preferred (energy-conserving) anti-parallel configuration, as shown in Figs. 4a-c. The axial motion of the vortices towards each other, driven by the inhomogeneous density, is faster if the vortices are close to the condensate’s boundary Svidzinsky and Fetter (2000); Sheehy and Radzihovsky (2004); Fetter (2009). The anti-parallel configuration which the vortices attempt to achieve induces them to drift radially towards the radial center of the condensate. This drift is similar to the well-known self-induced motion of a pair of straight anti-parallel vortex lines Neely et al. (2010); Torres et al. (2011); Middelkamp et al. (2011) in a homogeneous condensate. The balance between the radial and axial motions which we have described determines the features of the second stage of the interaction.
Briefly, if the axial collision velocity is sufficiently high (i.e., if the vortex lines start interacting in a region sufficiently close to the boundary Svidzinsky and Fetter (2000); Sheehy and Radzihovsky (2004); Fetter (2009)) the two vortices tend to reconnect before reaching the center of the condensate, as in Fig. 4c.
Vice versa, if the interaction begins in a region sufficiently close to the -axis, the radial motion of the vortex lines is fast enough (with respect to the axial motion) to get past the radial center of the condensate where they move axially away from each other due to the reversed velocity field induced by the inhomogeneous density: a rebound takes place, as in Fig. 4a.
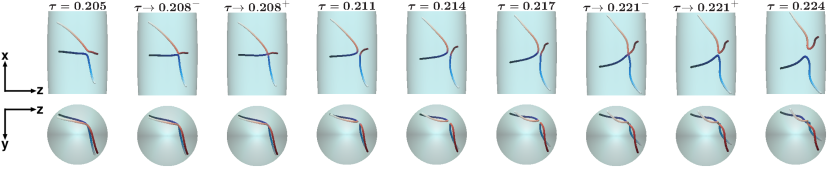
An intermediate regime occurs if, while drifting radially away from the boundary of the condensate towards the center, the minimum distance between the vortices in the central region of the condensate is sufficiently small: in this case a double reconnection Berry and Dennis (2012) occurs. This happens for instance in the sequence in Fig. 4b, where the two vortex lines touch at a point and exchange their tails both at and , expressed in units of the precession period (see Fig. 7 in Appendix B for a more detailed illustration of the double reconnection dynamics).
In addition to the simulations with chemical potential , we have also performed simulations with . The corresponding dynamics are very similar and the sole discriminant parameter between the distinct vortex interaction regimes is indeed the orbit parameter . The critical value switching from rebound to double reconnection dynamics is for and for , supporting our argument that the value of does not change the essence of the physics.
IV Interpretation of the results
IV.1 Rebounds
The simulations in Fig. 4a show that rebound events are characterized by non intersecting vortex trajectories, as we observe experimentally in a subset of images, e.g. in Fig. 3a,b. For example, Fig. 4a can be related to Fig. 3b, where the orientations extracted from the residuals start from an orthogonal configuration before partially overlapping (however the trajectories do not intersect) and then emerge later showing an anti-parallel configuration. A simpler, non-rotational, bounce is the one in Fig. 3a, where vortices are already anti-parallel before interacting. Both of the observed rebounds are characterized by an increased visibility when vortices are very close to each other. This is because the residuals are generated by subtracting the unperturbed density distributions and vortices become more visible where their cores lie within a region of higher density. The observed increase of vortex visibility in rebound events is thus consistent with the radial drift of the vortices towards the -axis seen in numerical simulations.
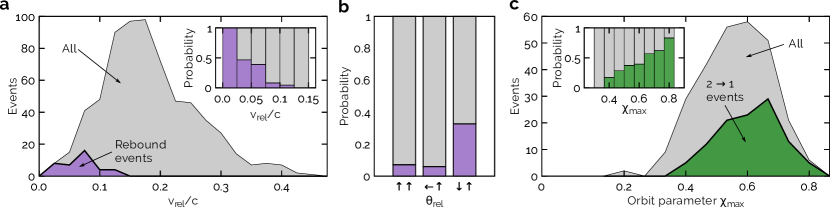
By studying the dynamics of hundreds of different experimental realisations, we make a statistical analysis which reinforces our interpretation. Figure 5a shows the distribution of events as a function of the relative axial velocity of two approaching vortices. It is evident that those events, that are identified as rebounds (with approaching, but not touching, trajectories), preferentially happen when the relative velocity is small. As anticipated, the relative angle in the radial plane matters when discerning rebound events from reconnections. Fig. 5b shows the rebound probability as a function of the vortex relative angle just before their approach. In order to classify the events in the three bins of Fig. 5b, we use the relation between the shape of the residuals and the orientation of the vortex as extracted from numerical simulations (see Fig. 8 in Appendix C) to post-select all collisions for which we can safely estimate the relative angle to be approximately , , and degrees, within an uncertainty of the order of degrees. Then, in each group we count the fraction of rebounds. The results confirm that rebounds are most likely to occur between anti-aligned vortices, consistent with the simulations.
IV.2 Orbiting dynamics
Two parallel vortices can orbit around the center of the BEC in the same direction with distinct orbit parameters , only weakly interacting when they are at the closest distance. When imaged from a radial direction, the two vortices appear to cross periodically; in reality, they pass by each other without visible changes of the residual pattern, with, at most, only slight modifications of orbits and visibility. An example of such orbiting dynamics can be observed in the experimental image Fig. 3c, and a similar case in the numerical simulations is shown in Fig. 4e.
IV.3 Reconnections
If the initial orientations of the vortices are not parallel and the axial collision dynamics is sufficiently fast, single reconnection processes are favored. As simulations show (Fig. 4c,d), these reconnection processes generate cusps which, as they relax, form Kelvin waves Kivotides et al. (2001), i.e. helical perturbations of the cores, as for instance the ones visible at in Fig. 4c. The excitation of Kelvin waves via vortex reconnections was observed in superfluid Helium Fonda et al. (2014) and similar effects have also been found in numerical simulations of Fermi superfluids Wlazłowski et al. (2015)). In our experiment, such a perturbation of the vortex lines in a reconnection event implies a sudden change of both the orbit and the residual pattern, along with a significant change of visibility of one or both vortices, as illustrated in Fig. 3d,e. The nonlinear interaction among Kelvin waves might lead to Kelvin wave cascades Kozik and Svistunov (2004, 2005). However, in the confined geometry of our elongated BEC, the role of Kelvin waves is expected to be reduced compared to a uniform superfluid, due to finite (transverse) size effects. This is consistent with the fact that, if we release the whole condensate from the trap in order to observe the vortex lines by taking absorption images in the axial direction, as done in Donadello et al. (2014); Serafini et al. (2015), we typically observe almost rectilinear vortices with only smooth bends (mostly induced by boundary conditions for off-centered vortices), even in the presence of two or more vortices in the condensate.
IV.4 Ejections
When a vortex orbits the outer part of the condensate (large ) a fast interaction with another vortex (either via a reconnection or a close orbiting interaction) can cause the expulsion of either vortex towards the surface of the BEC, where the density is too low for observation (the other vortex remaining inside). Examples of such ejection processes are shown in Fig. 3e,f (reconnection-induced and orbiting-induced, respectively). The numerical counterpart of Fig. 3e is illustrated in Fig. 4d (in order to emphasize this vortex-visibility effect in the numerical simulations, the thickness and the color of the lines in the plots reported in the right column of Fig. 4 are modulated by the Thomas–Fermi density at which the corresponding vortex core resides, see Appendix B). A statistical analysis of experimental data is given in Fig. 5c: excluding cases where rebounds occur, we count all events of vortex-vortex interaction as a function of the largest orbit parameter of the vortex pair . Then, among them, we show in green those in which the visibility of one of the two vortex lines is lost in the interaction. The relative distribution in the inset clearly supports the idea that ejections occur at large , i.e., near the boundary of the condensate, in agreement with the result of the numerical simulations. These ejection processes might play a key role in the early post-quench dynamics of the BEC, when most of the vorticity produced by the Kibble–Zurek mechanism is progressively lost at the boundaries, eventually leaving only a few vortex lines in the final BEC I-Kang Liu et al. (2017). It is also worth noticing that a similar dynamics was previously discussed in Ref. Becker et al. (2013). In that case, pairs of dark solitons are created by an optical phase imprinting technique and their subsequent dynamics is observed. GP simulations show that solitons first decay into vortex rings and then into pairs of solitonic vortices which, in the experimental conditions, are still detected as dark soliton stripes. Hence a collision between two soliton stripes is actually a collision between two pairs of vortices. Such collisions can be inelastic and can also lead to “sling shot” events where one of the solitonic vortices is ejected from the condensate. Due to the different mechanism for the creation of vortices, the configurations discussed in Ref. Becker et al. (2013) involve typically more than two vortices in each collision, and thus the dynamics is more complex than in our case, though qualitatively consistent.
V Conclusions
In conclusion, we have developed an innovative experimental technique which, combined with numerical simulations, is capable of determining the real-time position and 3D orientation of vortex lines in an elongated BEC. This combined technique allows us to investigate vortex dynamics in a 3D quantum system with unprecedented resolution: novel types of vortex interaction regimes are unambiguously identified beyond standard reconnections already observed in superfluid helium Bewley et al. (2008). While in uniform, unbounded and non-rotating superfluids reconnections of vortex lines moving towards each other are unavoidable, and their effects have been extensively investigated Koplik and Levine (1993); Nazarenko and West (2003); de Waele and Aarts (1994); Tebbs et al. (2011); Zuccher et al. (2012); Kerr (2011); Villois et al. (2016a); Rorai et al. (2016), here we show that in a confined and inhomogeneous superfluid, depending on the relative velocity and orientation, two vortex lines can also rebound, perform double reconnections, maintain their orbits with negligible interaction and undergo ejections. These processes should play even more important roles when the BEC contains more than two vortices, for example in the case of turbulence Tsatsos et al. (2016).
Acknowledgments
We acknowledge useful discussions with Fabrizio Larcher, Nick Proukakis, George Stagg and Marek Tylutki.
L.G.’s work is supported by Fonds National de la Recherche, Luxembourg, Grant n.7745104
and by the Italian National
Group of Mathematical Physics (GNFM-INdAM).
C.F.B. acknowledges grant EPSRC EP/I019413/1.
T.B. and F.D. acknowledge the EU QUIC project for financial support.
The work was financially supported also by Provincia Autonoma di Trento.
S.S. and L.G. equally contributed to the work.
Appendix A: Experimental procedure for real-time imaging
Atoms are trapped in a harmonic magnetic trap. The presence of gravity adds a linear potential that shifts the total potential minimum, , 30 m below the magnetic field minimum. This makes the BEC lie in a region of inhomogeneous magnetic field, mainly varying in the vertical direction . Figure 6 illustrates how the different hyperfine energy levels vary in space because of the second order Zeeman effect.
The rf field couples the trapped state (green) with the non-magnetic state (red). The resonant frequency is scanned linearly in time from above the BEC to below, at 10 kHz/ms. The position m corresponds to the lowest boundary of the condensate.
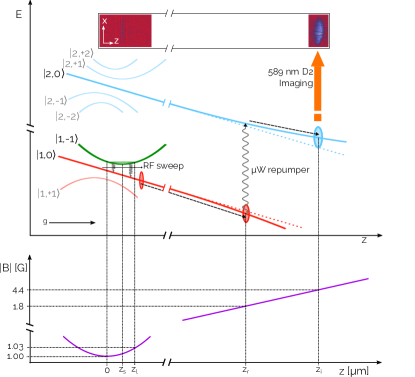
The rf sweep extracts each time a very small fraction of atoms, and the extraction process is then iterated many times in order to extract the vortex dynamics in real-time. The extracted atoms expand and fall freely under the effect of gravity. A microwave field is continuously kept on to couple and at the position m, far enough from the trapped BEC. In this way the extracted falling atoms are transferred to as soon as they cross such a surface and become detectable with the D2 probe light, as sketched in Fig. 6. We probe the extracted atoms via standard absorption imaging after ms of total time of flight at m from the trap center. An example of experimental image is shown in the inset on the top: only a weak diffraction pattern is visible in the trap region, while the outcoupled atoms become visible through absorption imaging below the repumper surface for , when the sample is promoted to the bright state (cyan).
Experimental images are digitally filtered through a FFT analysis to remove fringes due to the optics elements along the imaging path. The two-dimensional optical density matrix of the sample is integrated along the vertical radial axis obtaining a one-dimensional axial profile. Such a profile is then fitted with a fourth-order polynomial and residuals are calculated. This procedure is performed on each extraction and then the full temporal sequence is reconstructed in order to follow the vortex trajectories in the trapped condensate. Each sequence is plotted using both a sequential and a diverging color map, to highlight respectively the trajectory of vortices and the pattern in the residuals resulting from the self-interference of outcoupled atoms. The axial position of the vortex gives us direct information on the amplitude of the orbit, and hence the orbit parameter , as well as on the vortex velocity.
Appendix B: Numerical simulations of in-trap dynamics
Real-time dynamical simulations of a harmonically trapped BEC at are performed by solving the mean-field Gross–Pitaevskii (GP) equation
for the complex macroscopic wave function of the condensate . Here is the radial coordinate, and is the ratio of the axial to radial trapping frequencies. The mean-field coupling constant is , where is the -wave scattering length and is the radial harmonic oscillator length. In the simulations reported in Fig. 4 we use and , which corresponds to , where is the chemical potential and is the healing length. With respect to the experimental set up, in the numerical simulations is twice as large and the chemical potential is approximately three times smaller. This choice is dictated by the computational resources available, but the key characteristics of the vortex dynamics remain unchanged.
We start the simulation with a Thomas–Fermi parabolic profile for the condensate density . In order to calculate the vortex-free ground state, we evolve the GP equation in imaginary time until the relative decrease of energy between two consecutive time-steps is smaller than the threshold . Once this ground state is reached, we numerically imprint the two vortices.
For the numerical simulations illustrated in Fig. 4a-c, the vortices are initially imprinted in an orthogonal configuration, intersecting the -axis at the points and , the first vortex being oriented in the positive direction, the second vortex in the negative direction. The corresponding values of the orbit parameter are , , , for simulations reported in Fig. 4a,b,c respectively. In the simulation illustrated in Fig. 4d, vortices are also initially orthogonal, but the lower vortex is imprinted in the center of the BEC and oriented in the positive direction. The orbit parameter of the off-centered vortex is 0.7. Concerning the last simulation, Fig. 4e, both vortices are oriented in the positive direction with .
Vortex imprinting is accomplished by imposing a Padé density profile Berloff (2004) and a phase winding around the vortex axis. We then let the system evolve in imaginary time towards the lowest energy state employing the previously described energy convergence criterion. Once , we start the evolution of the GPE in real time.
Our numerical code employs second-order accurate finite difference schemes to discretize spatial derivatives; the integration in time is performed via a 4-th order Runge–Kutta method. The grid-spacings are homogeneous in the three Cartesian directions () and the time step is . The number of grid-points in the , and direction are {}={800,224,224}, leading to a computational box , where these values are expressed in units of .
Vortex tracking is achieved via an algorithm based on the pseudo-vorticity unit vector
which is tangent to the vortex line along its length Rorai et al. (2016); Villois et al. (2016b). To identify the first (starting) point along the axis of each vortex, we use criteria based simultaneously on circulation and density, and then adopt a steepest descent algorithm to achieve sub-grid resolution. Successive points on vortex lines are determined with separation distance .
In the plots reported in the right column of Fig. 4, the initial line colors refer to the colors
of the vortices illustrated in the snapshots (red/blue) until a reconnection event occurs.
After the latter, the colors employed switch to orange/green and again to red/blue
if a second reconnection takes place.
The transparency of the lines and the intensity of the colors employed in the plots
aim to reproduce the expected experimental vortex visibility. To achieve this aim we proceed
as follows. Since the experimental visibility is obtained by subtracting the background (vortex-free)
density profile from the optical integrated densities, the vortex visibility
increases for increasing atom number depletion arising from the presence of the vortex itself.
As a consequence, both width and color of the lines plotted in the right column of Fig. 4
are weighted by the value of the Thomas-Fermi density evaluated at the centre of vorticity
of the corresponding vortex,
in order to account, at least qualitatively, for the actual visibility of the vortex in the residual.
Finally, in order to illustrate in more detail the double reconnection dynamics, in Fig. 7 we report radial and axial snapshots of vortex configurations for the double reconnection event already described in Fig. 4b, but employing a finer temporal resolution. The exchange of vortex strands and the formation of cusps is clearly visible at the reconnection instants and . After the second reconnection evidence for the formation of Kelvin waves can be observed (at ).
Appendix C: Numerical simulations of expansion
For the purpose of inferring in situ vortex information from the post-expansion residual densities, we explicitly simulate the outcoupling and expansion dynamically using the GP equation. The outcoupled atoms expand as they fall under gravity relative to the trapped condensate. While the outcoupled atoms may be fairly dilute, they still experience significant interactions with the dense trapped portion, for several ms, until gravity finally separates the components. The corresponding scattering length between outcoupled and trapped atoms is the same as that between trapped atoms, and takes the value 54.54(20), where is the Bohr radius. Interactions between outcoupled atoms, while less important, are also included and for these the scattering length is 52.66(40) Knoop et al. (2011).
The partial extraction is performed as a linear-in-energy sweep such that upper atoms are outcoupled before lower atoms. The phase of the trapped component is allowed to evolve during the sweep, which occurs over a few ms, but the in-trap vortex dynamics is much slower and we treat this as fixed. The trapped component’s phase, owing to a larger potential energy, evolves more rapidly during the sweep than it does for the released atoms. Consequently, if we consider the example of a horizontal vortex ( i.e. oriented in the direction), by the time the lower atoms are released they have accumulated a greater phase change than the upper ones, which were released earlier, such that these layers interfere constructively on one side of the core and destructively on the other, depending on the sense of the in situ phase circulation. Furthermore, the combined effects of gravity and the intercomponent interactions mean that the speed of the sweep is important. We choose a sweep speed, both experimentally and theoretically, which rapidly compresses the outcoupled cloud in the vertical direction, thus maximizing interference effects. This enhances the -direction asymmetry of the residual, allowing us to determine the orientation and, for horizontal alignment, the sign of the vortex. When extracting vortex information and quantifying this asymmetry we fit the function
| (1) |
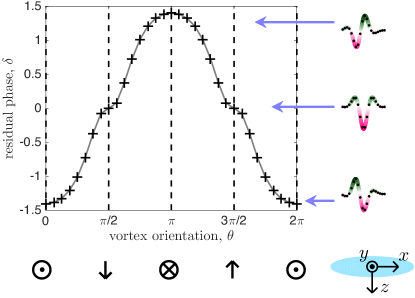
to the 1D residual, where and are fitting parameters. Here, represents the axial position of the vortex while is related to the orientation of the vortex line in the radial plane.
To ensure numerical convergence of the residual to 1% when performing a ms expansion we begin with a grid that initially represents the in situ density, {,,} = {51,16,14} and {} = {300,180,120}, and after several interpolations, end with a much-enlarged grid, {,,} = {75,70,60} and {} = {180,180,600}.
The relation is numerically calculated for a straight solitonic vortex and the results are displayed in Fig. 8. Importantly, the fitting function gives a negative value of for a horizontal vortex aligned in the direction (), whereas the sign of flips for a horizontal vortex of the opposite sense, i.e. . For vertically oriented vortices () one finds , and we reiterate here that since every corresponds to two angles this method cannot, for example, determine the sense of a vertical vortex. We note further that the relationship given by Fig. 8 is expected to be modified for vortices with large orbit parameters.
References
- Kida and Takaoka (1994) Shigeo Kida and M Takaoka, “Vortex reconnection,” Annual Review of Fluid Mechanics 26, 169–177 (1994).
- Barenghi et al. (2001) C. F. Barenghi, R. J. Donnelly, and W. F. Vinen, Quantized vortex dynamics and superfluid turbulence (Springer Science & Business Media, 2001).
- Schwarz (1988) K. W. Schwarz, “Three-dimensional vortex dynamics in superfluid : Homogeneous superfluid turbulence,” Phys. Rev. B 38, 2398–2417 (1988).
- Priest and Forbes (2007) E. Priest and T. Forbes, Magnetic Reconnection: MHD Theory and Applications (Cambridge University Press, 2007).
- Che et al. (2011) H Che, J. F. Drake, and M Swisdak, “A current filamentation mechanism for breaking magnetic field lines during reconnection,” Nature 474, 184–187 (2011).
- Cirtain et al. (2013) Jonathan W Cirtain, L Golub, A. R. Winebarger, B De Pontieu, K Kobayashi, R. L. Moore, Robert William Walsh, K. E. Korreck, M Weber, P McCauley, et al., “Energy release in the solar corona from spatially resolved magnetic braids,” Nature 493, 501–503 (2013).
- Chuang et al. (1991) Isaac Chuang, Ruth Durrer, Neil Turok, and Bernard Yurke, “Cosmology in the laboratory: Defect dynamics in liquid crystals,” Science 251, 1336–1342 (1991).
- Sumners (1995) D.W. Sumners, “Lifting the curtain:using topology to probe the hidden action of enzymes,” Notice AMS 42, 528 (1995).
- Vazques and Sumners (2004) M Vazques and D.W. Sumners, “Tangles analysis of gin recombination,” Math. Proc. Cam. Phil. Soc. 136, 565 (2004).
- Dennis et al. (2010) MR Dennis, RP King, B Jack, K O’Holleran, and MJ Padgett, “Isolated optical vortex knots,” Nat Phys 6, 118 (2010).
- Berry and Dennis (2012) M V Berry and M R Dennis, “Reconnections of wave vortex lines,” Eur. J. Phys. 33, 723 (2012).
- Onsager (1949) L. Onsager, “Statistical hydrodynamics,” Nuovo Cim. 6, 279 (1949).
- Feynman (1955) R. P. Feynman, in Progress in Low Temperature Physics, Vol. 1, edited by C. J. Gorter (Elsevier, 1955) p. 17.
- Vinen (1961) W. F. Vinen, “The detection of single quanta of circulation in liquid helium II,” in Proc. R. Soc. London, Ser. A, Vol. 260 (The Royal Society, 1961) pp. 218–236.
- Donnelly (1991) Russell J. Donnelly, Quantized Vortices in Helium II (Cambridge University Press, 1991) p. 346.
- Barenghi et al. (2014) C. F. Barenghi, V. L’vov, and P. E. Roche, “Experimental, numerical and analytical velocity spectra in turbulent quantum fluid,” Proc. Natl. Acad. Sci. U.S.A. 111, 4683–4690 (2014).
- Baggaley et al. (2012) A. W. Baggaley, J. Laurie, and C. F. Barenghi, “Vortex-density fluctuations, energy spectra, and vortical regions in superfluid turbulence,” Phys. Rev. Lett. 109, 205304 (2012).
- Nore et al. (1997) C. Nore, M. Abid, and M. E. Brachet, “Kolmogorov turbulence in low-temperature superflows,” Phys. Rev. Lett. 78, 3896–3899 (1997).
- Maurer and Tabeling (1998) J. Maurer and P Tabeling, “Local investigation of superfluid turbulence,” Europhys. Lett. 43, 29 (1998).
- Skrbek and Sreenivasan (2012) L. Skrbek and K. R. Sreenivasan, “Developed quantum turbulence and its decay,” Phys. Fluids 24, 011301 (2012).
- Navon et al. (2016) N. Navon, A. L. Gaunt, R. P. Smith, and Z. Hadzibabic, “Emergence of a turbulent cascade in a quantum gas,” Nature 539, 72–75 (2016).
- Zakharov et al. (2012) Vladimir E Zakharov, Victor S L’vov, and Gregory Falkovich, Kolmogorov spectra of turbulence I: Wave turbulence (Springer Science & Business Media, 2012).
- Kleckner et al. (2016) D. Kleckner, L. H. Kauffman, and W. T. M. Irvine, “How superfluid vortex knots untie,” Nat. Phys. 12, 650–655 (2016).
- Clark di Leoni et al. (2016) P. Clark di Leoni, P. D. Mininni, and M. E. Brachet, “Helicity, topology, and kelvin waves in reconnecting quantum knots,” Phys. Rev. A 94, 043605 (2016).
- Scheeler et al. (2014) M. W. Scheeler, D. Kleckner, D. Proment, G. L. Kindlmann, and W. T. M. Irvine, “Helicity conservation by flow across scales in reconnecting vortex links and knots,” Proc. Natl. Acad. Sci. U.S.A. 111, 15350 (2014).
- Kozik and Svistunov (2004) Evgeny Kozik and Boris Svistunov, “Kelvin-wave cascade and decay of superfluid turbulence,” Phys. Rev. Lett. 92, 035301 (2004).
- Kozik and Svistunov (2005) Evgeny Kozik and Boris Svistunov, “Scale-separation scheme for simulating superfluid turbulence: Kelvin-wave cascade,” Phys. Rev. Lett. 94, 025301 (2005).
- Leadbeater et al. (2001) M. Leadbeater, T. Winiecki, D. C. Samuels, C. F. Barenghi, and C. S. Adams, “Sound emission due to superfluid vortex reconnections,” Phys. Rev. Lett. 86, 1410 (2001).
- Bewley et al. (2008) G. P. Bewley, M. S. Paoletti, K. R. Sreenivasan, and D. P. Lathrop, “Characterization of reconnecting vortices in superfluid helium,” Proc. Natl. Acad. Sci. U.S.A. 105, 13707 (2008).
- Fonda et al. (2014) Enrico Fonda, David P. Meichle, Nicholas T. Ouellette, Sahand Hormoz, and Daniel P. Lathrop, “Direct observation of Kelvin waves excited by quantized vortex reconnection,” Proc. Nat. Acad. Sci. 111, 4707–4710 (2014).
- Nazarenko and West (2003) S. Nazarenko and R. West, “Analytic solution for nonlinear Schrödinger vortex reconnection,” J. Low Temp. Phys. 132, 1 (2003).
- Koplik and Levine (1993) Joel Koplik and Herbert Levine, “Vortex reconnection in superfluid helium,” Phys. Rev. Lett. 71, 1375–1378 (1993).
- de Waele and Aarts (1994) A. T. A. M. de Waele and R. G. K. M. Aarts, “Route to vortex reconnection,” Phys. Rev. Lett. 72, 482–485 (1994).
- Tebbs et al. (2011) Richard Tebbs, Anthony J Youd, and Carlo F Barenghi, “The approach to vortex reconnection,” J. Low Temp. Phys. 162, 314–321 (2011).
- Zuccher et al. (2012) S. Zuccher, M. Caliari, A. W. Baggaley, and C. F. Barenghi, “Quantum vortex reconnections,” Phys. of Fluids 24, 125108 (2012).
- Kerr (2011) Robert M Kerr, “Vortex stretching as a mechanism for quantum kinetic energy decay,” Phys. Rev. Lett. 106, 224501 (2011).
- Villois et al. (2016a) A Villois, G Krstulovic, and D Proment, “(non)-universality of vortex reconnections in superfluids,” arXiv , 1612.00386 (2016a).
- Rorai et al. (2016) Cecilia Rorai, Jack Skipper, Robert M Kerr, and Katepalli R Sreenivasan, “Approach and separation of quantum vortices with balanced cores,” J. Fluid. Mech 808, 641 (2016).
- Anderson et al. (2000) B. P. Anderson, P. C. Haljan, C. E. Wieman, and E. A. Cornell, “Vortex precession in Bose-Einstein condensates: Observations with filled and empty cores,” Phys. Rev. Lett. 85, 2857–2860 (2000).
- Weiler et al. (2008) C. N. Weiler, T. W. Neely, D. R. Scherer, A. S. Bradley, M. J. Davis, and B. P. Anderson, “Spontaneous vortices in the formation of Bose-Einstein condensates,” Nature 455, 948–952 (2008).
- Freilich et al. (2010) D. V. Freilich, D. M. Bianchi, A. M. Kaufman, T. K. Langin, and D. S. Hall, “Real-time dynamics of single vortex lines and vortex dipoles in a Bose-Einstein condensate,” Science 329, 1182 (2010).
- Neely et al. (2010) T. W. Neely, E. C. Samson, A. S. Bradley, M. J. Davis, and B. P. Anderson, “Observation of vortex dipoles in an oblate Bose-Einstein condensate,” Phys. Rev. Lett. 104, 160401 (2010).
- Torres et al. (2011) P.J. Torres, P.G. Kevrekidis, D.J. Frantzeskakis, R. Carretero-González, P. Schmelcher, and D.S. Hall, “Dynamics of vortex dipoles in confined Bose-Einstein condensates,” Physics Letters A 375, 3044 – 3050 (2011).
- Navarro et al. (2013) R. Navarro, R. Carretero-González, P. J. Torres, P. G. Kevrekidis, D. J. Frantzeskakis, M. W. Ray, E. Altuntaş, and D. S. Hall, “Dynamics of a few corotating vortices in Bose-Einstein condensates,” Phys. Rev. Lett. 110, 225301 (2013).
- Brand and Reinhardt (2002) Joachim Brand and William P. Reinhardt, “Solitonic vortices and the fundamental modes of the snake instability: possibility of observation in the gaseous Bose-Einstein condensate,” Phys. Rev. A 65, 043612 (2002).
- Komineas and Papanicolaou (2003) S. Komineas and N. Papanicolaou, “Solitons, solitonic vortices, and vortex rings in a confined Bose-Einstein condensate,” Phys. Rev. A 68, 043617 (2003).
- Donadello et al. (2014) Simone Donadello, Simone Serafini, Marek Tylutki, Lev P. Pitaevskii, Franco Dalfovo, Giacomo Lamporesi, and Gabriele Ferrari, “Observation of solitonic vortices in Bose-Einstein condensates,” Phys. Rev. Lett. 113, 065302 (2014).
- Tylutki et al. (2015) M. Tylutki, S. Donadello, S. Serafini, L. P. Pitaevskii, F. Dalfovo, G. Lamporesi, and G. Ferrari, “Solitonic vortices in Bose-Einstein condensates,” Eur. Phys. J. Special Topics 224, 577–583 (2015).
- Kibble (1976) T W B Kibble, “Topology of cosmic domains and strings,” J. Phys. A 9, 1387 (1976).
- Zurek (1996) W. H. Zurek, “Cosmological experiments in condensed matter systems,” Physics Reports 276, 177 – 221 (1996).
- Lamporesi et al. (2013) Giacomo Lamporesi, Simone Donadello, Simone Serafini, Franco Dalfovo, and Gabriele Ferrari, “Spontaneous creation of Kibble-Zurek solitons in a Bose-Einstein condensate,” Nat. Phys. 9, 656–660 (2013).
- Donadello et al. (2016) S. Donadello, S. Serafini, T. Bienaimé, F. Dalfovo, G. Lamporesi, and G. Ferrari, “Creation and counting of defects in a temperature-quenched Bose-Einstein condensate,” Phys. Rev. A 94, 023628 (2016).
- Becker et al. (2013) C Becker, K Sengstock, P Schmelcher, P G Kevrekidis, and R Carretero-González, “Inelastic collisions of solitary waves in anisotropic Bose-Einstein condensates: sling-shot events and expanding collision bubbles,” New J. Phys. 15, 113028 (2013).
- Ku et al. (2014) Mark J. H. Ku, Wenjie Ji, Biswaroop Mukherjee, Elmer Guardado-Sanchez, Lawrence W. Cheuk, Tarik Yefsah, and Martin W. Zwierlein, “Motion of a solitonic vortex in the BEC-BCS crossover,” Phys. Rev. Lett. 113, 065301 (2014).
- Ku et al. (2016) Mark J. H. Ku, Biswaroop Mukherjee, Tarik Yefsah, and Martin W. Zwierlein, “Cascade of solitonic excitations in a superfluid Fermi gas: From planar solitons to vortex rings and lines,” Phys. Rev. Lett. 116, 045304 (2016).
- Ramanathan et al. (2012) Anand Ramanathan, Sérgio R. Muniz, Kevin C. Wright, Russell P. Anderson, William D. Phillips, Kristian Helmerson, and Gretchen K. Campbell, “Partial-transfer absorption imaging: A versatile technique for optimal imaging of ultracold gases,” Rev. Sci. Instrum. 83, 083119 (2012).
- Serafini et al. (2015) Simone Serafini, Matteo Barbiero, Michele Debortoli, Simone Donadello, Fabrizio Larcher, Franco Dalfovo, Giacomo Lamporesi, and Gabriele Ferrari, “Dynamics and interaction of vortex lines in an elongated Bose-Einstein condensate,” Phys. Rev. Lett. 115, 170402 (2015).
- Bewley et al. (2006) G. P. Bewley, D. P. Lathrop, and K. R. Sreenivasan, “Visualization of quantized vortices,” Nature 441, 588 (2006).
- Pitaevskii and Stringari (2016) L. Pitaevskii and S. Stringari, Bose-Einstein Condensation and Superfluidity (Oxford University Press, 2016).
- Dalfovo et al. (1999) Franco Dalfovo, Stefano Giorgini, Lev P. Pitaevskii, and Sandro Stringari, “Theory of Bose-Einstein condensation in trapped gases,” Rev. Mod. Phys. 71, 463–512 (1999).
- Allen et al. (2014) A.J. Allen, S. Zuccher, M. Caliari, N. P. Proukakis, N. G. Parker, and C. F. Barenghi, “Vortex reconnections in atomic condensates at finite temperature,” Phys. Rev. A 90, 013601 (2014).
- Svidzinsky and Fetter (2000) A. A. Svidzinsky and A. L. Fetter, “Stability of a vortex in a trapped Bose-Einstein condensate,” Phys. Rev. Lett. 84, 5919 (2000).
- Lundh and Ao (2000) E. Lundh and P. Ao, “Hydrodynamic approach to vortex lifetimes in trapped Bose condensates,” Phys. Rev. A 61, 063612 (2000).
- Sheehy and Radzihovsky (2004) D. E. Sheehy and L. Radzihovsky, “Vortices in spatially inhomogeneous superfluids,” Phys. Rev. A 70, 063620 (2004).
- Fetter (2009) A. L. Fetter, “Rotating trapped Bose-Einstein condensates,” Rev. Mod. Phys. 81, 647 (2009).
- Middelkamp et al. (2011) S Middelkamp, P.J. Torres, P. G. Kevrekidis, D. J. Frantzeskakis, R. Carretero-González, P. Schmelcher, D. V. Freilich, and D. S. Hall, “Guiding-center dynamics of vortex dipoles in Bose-Einstein condensates,” Phys. Rev. A 84, 011605(R) (2011).
- Kivotides et al. (2001) D. Kivotides, J. C. Vassilicos, D. C. Samuels, and Barenghi C. F., “Kelvin waves cascade in superfluid turbulence,” Phys. Rev. Lett. 86, 3080 (2001).
- Wlazłowski et al. (2015) Gabriel Wlazłowski, Aurel Bulgac, Michael McNeil Forbes, and Kenneth J. Roche, “Life cycle of superfluid vortices and quantum turbulence in the unitary fermi gas,” Phys. Rev. A 91, 031602 (2015).
- I-Kang Liu et al. (2017) I-Kang Liu et al. , (2017), in preparation.
- Tsatsos et al. (2016) M. C. Tsatsos, P. E. S. Tavares, A. Cidrim, A. R. Fritsch, M. A. Caracanhas, F. E. A. dos Santos, C. F. Barenghi, and V. S. Bagnato, “Quantum turbulence in trapped atomic Bose-Einstein condensates,” Physics Reports 622, 1–52 (2016).
- Berloff (2004) Natalia G Berloff, “Padé approximations of solitary wave solutions of the Gross–Pitaevskii equation,” J. Phys. A: Math. Gen. 37, 1617 (2004).
- Villois et al. (2016b) Alberto Villois, Giorgio Krstulovic, Davide Proment, and Hayder Salman, “A vortex filament tracking method for the Gross–Pitaevskii model of a superfluid,” J. Phys. A: Math. Theor. 49, 415502 (2016b).
- Knoop et al. (2011) S. Knoop, T. Schuster, R. Scelle, A. Trautmann, J. Appmeier, M. K. Oberthaler, E. Tiesinga, and E. Tiemann, “Feshbach spectroscopy and analysis of the interaction potentials of ultracold sodium,” Phys. Rev. A 83, 042704 (2011).