The flow and evolution of ice-sucrose crystal mushes
Abstract
We study the rheology of suspensions of ice crystals at moderate to high volume fractions in a sucrose solution in which they are partially soluble; a model system for a wide class of crystal mushes or slurries. Under step changes in shear rate, the viscosity changes to a new ‘relaxed’ value over several minutes, in a manner well fitted by a single exponential. The behavior of the relaxed viscosity is power-law shear thinning with shear rate, with an exponent of , so that shear stress falls with increasing shear rate. On longer timescales, the crystals ripen (leading to a falling viscosity) so that the mean radius increases with time to the power . We speculate that this unusually small exponent is due to the interaction of classical ripening dynamics with abrasion or breakup under flow. We compare the rheological behavior to mechanistic models based on flow-induced aggregation and breakup of crystal clusters, finding that the exponents can be predicted from liquid phase sintering and breakup by brittle fracture.
pacs:
91.60.Ba, 47.55.Kf, 83.10.GrI Introduction
The flow of crystal suspensions in which the crystals are soluble in the liquid phase (termed hereafter ‘mushes’) is important in both nature and engineering. Examples from earth and planetary sciences involving this class of material include magmatic emplacement, lava flows Shaw ; Caricci ; Vona , the formation of sea ice Smedsrud and cryogenic eruptions Lopes ; Zhong ; Ceres . In an artificial setting they can occur in frozen foods Clark ; Stokes , slurry-ice refrigerant systems fridge , metal casting casting1 ; casting2 , slurry explosives explosives , solution mining mining and evaporative mineral and sugar refinement.
Mushes consist of a suspension of hard, partially soluble crystals in a carrier liquid (which we term the ‘serum phase’); the latter being usually Newtonian in rheology. However, additional complexity arises because the crystals have attractive or adhesive interactions resulting from van der Waals forces Hamaker ; but more characteristically from their tendency to undergo liquid phase sintering into clusters when they touch German . The importance of such attractive interactions will depend on the size and solubility of the crystals and the diffusivity of molecules in the serum, so one can anticipate a spectrum of behaviors from approximately hard particle suspension rheology to cases where sintering dominates.
As well as aggregation and sintering, soluble crystals will undergo ripening Ostwald ; LS ; W , driven by the minimization of interfacial energy as the larger crystals grow at the expense of the smaller. The mean crystal size will therefore gradually increase throughout any experiment.
These phenomena lead to complex rheological properties: mushes are typically shear thinning at low solids volume fraction , and can develop a yield stress and exhibit pseudo-plastic behavior Stokes ; Zhong ; Kargel . The time-dependent nature of cluster formation and of sintering can also lead to strong history-dependence in the rheology. For example, if left unsheared, a mush will often solidify Stokes and in general one would expect it to display thixotropic behavior thix under changes in shear rate Zhong .
The flow of a suspension of hard particles with no interactions other than hydrodynamics was first studied by Einstein Einstein , who showed that spheres at a volume fraction enhance the viscosity by a factor , where is a pure number, termed the ‘intrinsic viscosity’ or Einstein coefficient. For spheres this is 2.5, but is larger for other shapes Jeffery . At higher volume fractions (particularly above ) the viscosity increases more strongly than the Einstein result Kruif and will in general diverge at a maximum volume fraction , which may be related to random close- Bernal or loose- Song packing, or result from a dynamic process of dilatancy RMP or jamming FBM . For the volume fractions of interest in this paper, a widely used approximation for the suspension viscosity in terms of the continuous phase viscosity is from Krieger and Dougherty KD :
| (1) |
where for subspherical particles of roughly equal size, one would use and . Lower values of might be due to frictional interactions leading to divergence at loose packing or lower packing density due to significant departure from sphericity Delaney ; Delaney2 . Higher values may arise from polydispersity FarrGroot ; FarrVisc .
When attractive forces between particles are present, shear thinning and other non-Newtonian behavior can result. For very dilute suspensions, aggregation leads to fractal flocs DLA ; DLARLA , which can ultimately percolate to form a gel. Before gelation, such suspensions are weakly shear thinning; while after, the gels are viscoelastic solids Buscall with properties that scale with . At higher volume fractions (the subject of this paper), there is no universal theory of attractive particle rheology and flow properties depend on the details of the interparticle interactions. Strongly cohesive suspensions can display steep shear thinning and non-monotonic flow curves Buscall1 ; Buscall2 .
When making rheological measurements on such systems, pseudo-plasticity introduces problems in simple geometries. Using a parallel plate or Couette flow cell will lead to flow instabilities such as shear banding Schall , while capillary rheometers may be subject to plug flow Barnes . These phenomena leave the majority of the volume undeformed, so one is only probing the flow in thin layers of the fluid. Moreover, with a history-dependent mush, the unsheared regions are likely to solidify, exacerbating the problem. In this paper, we therefore use a more complex geometry to ensure bulk deformation of the material. This consists of a cylindrical vessel with a rotating impeller for which we measure both the rotation rate and the applied torque .
A second problem arises from the particle size of the suspension: for reliable measurements, the flow geometry should ensure that the gaps through which the suspension is forced to flow are large compared to a crystal (or cluster), so that most of the viscous dissipation occurs in the bulk of the fluid rather than in locally jammed regions in confined spaces Wyart . This, together with the size of the crystals and the values of the interesting shear rates, mean that we are not able to guarantee that the Reynolds number of the flow is small.
All these considerations mean that calibration of the rheological apparatus is non-trivial, and for our case will rely on some specific assumptions about the rheology, which we are then able to test post-hoc.
II Outline and key assumptions
Throughout this paper, we suppose that under constant root-mean-square shear rate , the viscosity has a power law dependence on this shear rate and the mean crystal radius , with a volume fraction dependent pre-factor:
| (2) |
Here, and are exponents which we obtain in section V.4. We hypothesize that this behavior arises from crystal clusters dynamically formed and broken up in the flow. At high shear rates, we anticipate that the clusters will be broken down, and there will be a crossover to Newtonian behavior with the Krieger-Dougherty value for the viscosity.
We also suppose that crystal ripening will occur and lead to a power-law dependence of crystal radius on time , and potentially also on root-mean-square shear rate (again with a volume fraction dependent prefactor):
| (3) |
where and are exponents we find in section V.3.
Together, Eqs. (2) and (3) imply that the observed viscosity in experiments at constant volume fraction , as a function of time and constant shear rate will have the following form:
| (4) |
These exponent combinations are determined in sections V.1 and V.3. The value for can be obtained more easily from experiments where the shear rate is suddenly changed (see section V.2).
The viscometer employed was first calibrated over a range of Reynolds numbers, using Newtonian fluids and hard sphere suspensions of known viscosity, similar to the crystal mushes we are ultimately interested in. The calibration (section IV) allows one to deduce viscosity from and (and thus power dissipation), and also to attribute to the flow root-mean-square values of shear rate and shear stress .
In general, this calibration, performed for Newtonian fluids, cannot be used for non-Newtonian fluids. This is because the material, being subject to different shear rates at different locations, will also have a spatially-dependent viscosity. The resulting flow pattern will not correspond to any of the velocity fields covered by the Newtonian calibration.
There is however a class of non-trivial rheologies to which the calibration does apply: suppose that following a sudden change in shear rate, the viscosity is initially unchanged, but then relaxes thixotropically towards a new viscosity corresponding to the new shear rate. If this relaxation happens on a timescale that is long compared to a rotation time of the viscometer, then the viscosity will remain spatially uniform even as it changes slowly with time, and the Newtonian calibration can be used to deduce the viscosity even as it relaxes to the new steady-state value.
The hallmark of this behavior is that if the rotation rate is changed suddenly, the torque will change discontinuously, but the calculated viscosity should be essentially continuous (although its first derivative with time may be discontinuous). Furthermore, only a relatively small fraction of the ultimate change in viscosity should occur on a timescale of a single rotation of the impeller. As we see in section V.2, this is indeed observed for the crystal mushes studied here.
Microstructurally, we interpret this rheological behavior in the following way: if the dissipated power in the flow is coming primarily from the deformation of the Newtonian serum, then high values of crystal mush viscosity arise from the presence of crystal clusters Caricci , which are built up and break down dynamically in the flow. A sudden change in shear rate does not immediately affect the cluster statistics, so only acts through a proportional change in the local flow rates in the serum phase, and hence an ‘instantaneously Newtonian’ behavior of the suspension. Only over the course of several inverse shear rates does the aggregation/breakup dynamics converge to a new distribution of cluster sizes and shapes (and thus a new ‘relaxed viscosity’). Although both aggregation and breakup are likely to occur more quickly at higher shear rates, it is to be expected that breakup will increase more quickly than aggregation, so that cluster size and hence viscosity will fall with increasing shear rate. The relaxed viscosity will therefore be shear thinning; a conclusion borne out by our results in sections V.1 and V.2.
A further complication is that even at constant rotation rate, the viscosity falls gradually over time, which we interpret to be due to the slow growth by ripening of the crystals. Data on ripening is obtained by optical microscopy on samples taken from the suspension, and presented in section V.3.
Finally, in section VI, we make simple theoretical predictions for the relaxed viscosity as a function of crystal size and suspension shear rate, based on theories of adhesive contact or sintering and fracture of crystal contacts, together with aggregation and breakup dynamics. To do this, we argue that at relatively high volume fractions, and in the regime where viscosity is dominated by clustering, the root mean square shear stress in the suspension is
| (5) |
where is the force required to break an adhesive contact between two crystals, and the dimensionless prefactor depends only weakly on volume fraction.
This allows us to predict values for and in terms of theories for adhesion, liquid phase sintering and fracture, and compare these to the experimentally measured values. The comparison of theory to experiment is shown in Fig. 16, and we find good agreement with a simple liquid phase sintering model, and also the evaporation-condensation theory of Kingery and Berg Kingery .
III Materials and methods
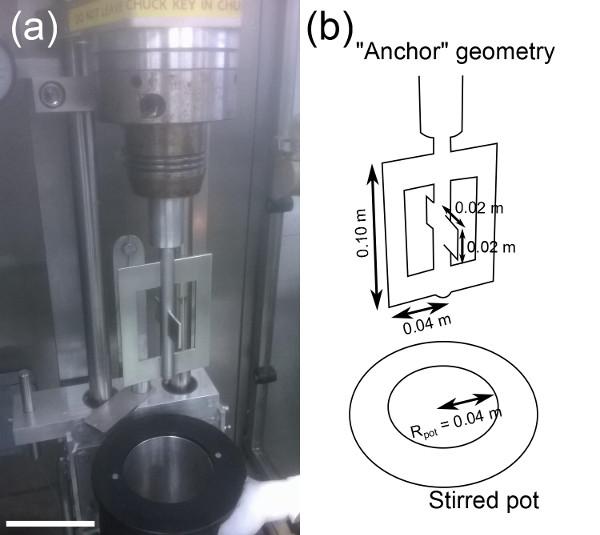
The rheological apparatus used was a custom-made viscometer, developed by the engineering workshop at Unilever Research Colworth, and referred to hereafter as a ‘stirred pot’ (Fig. 1). It consists of a jacketed cylindrical vessel of inner radius m and depth m, maintained at a set temperature of C by pumping propylene glycol solution through the jacket and a circulating, refrigerating Haake F8/C35 water bath. The impeller is an anchor geometry (see Fig. 1), which rotates at a chosen angular frequency , while torque is recorded. We chose rotation rates in the range 200 to 400 rpm ( 20.9 to 41.9 rad s-1). In experiments with no change in rotation rate, data is collected every 300 s over a run of several hours. In runs where we impose a step change in rotation rate, data was collected every 2 s, to observe the transients arising from this change.
All experiments on ice-sucrose mushes were conducted at fixed temperature C C, so the ice volume fraction is determined by the sucrose concentration only, and the unfrozen serum phase has a fixed composition and therefore viscosity at this temperature. The sucrose concentrations used are shown in table 1, including a sucrose solution for which no crystals formed, hence for which , which is precisely the composition of the serum phase in the ice-containing samples at this temperature. This zero-ice formulation, being Newtonian, was used for one of the calibration experiments. Sucrose solutions were prepared by adding boiled water to granulated sucrose, then cooling overnight to C before pouring into the stirred pot, which had been previously cooled to C.
The remaining calibration experiments were conducted at a range of different , and used 90% and 99.5% glycerol (1260 kg m-3, from Sigma-Aldrich); either alone, or as the serum phase in a suspension of silica spheres of m (with a range of 50-150 m) and density 1800 kg m-3 (see Fig. 2; also from Sigma-Aldrich). These suspensions are predicted to be Newtonian and behave according to the Krieger-Dougherty relation, Eq. (1). The viscosities of the glycerol without silica spheres, and the sucrose solution without ice, were measured using an Anton Paar MCR501 rheometer.
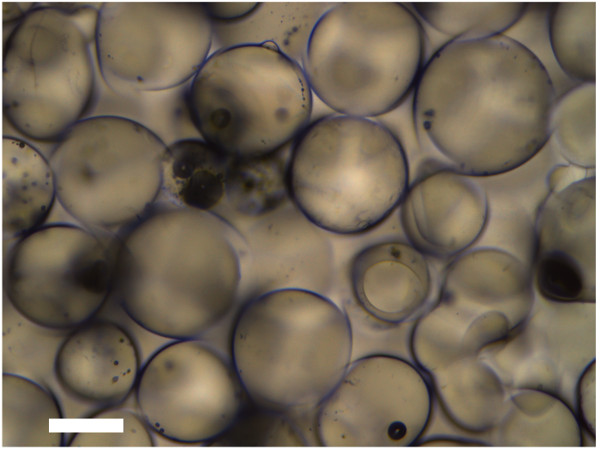
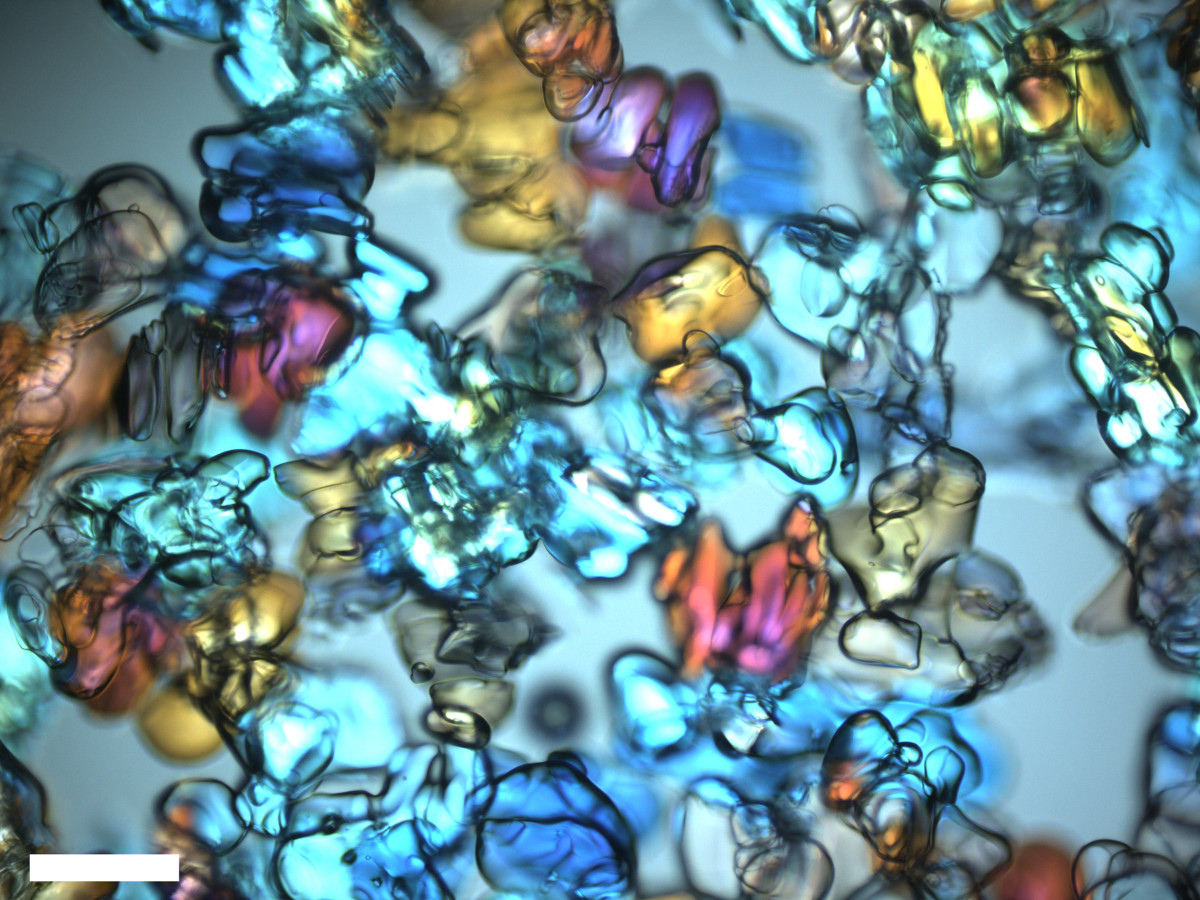
In experiments where samples were extracted for image analysis, the stirrer was briefly stopped ( min), and a small portion of the sample was removed and the temperature checked. The torque was not affected by the stoppages, and returned to its previous value after being switched back on. The images were produced using a Leica DMLM microscope and Leica DFC490 camera, and the slides kept cool using a Linkam cold stage with the temperature regulated at C using a Landa RMB waterbath. The crystals were then analyzed using ImageJ software to get values of crystal radius and aspect ratio.
| Sucrose (wt.%) | Water (wt.%) | (ice) at -10∘C |
|---|---|---|
IV Calibration
The aim of our calibration is to be able to deduce viscosity from torque and rotation rate . In order to do this we have performed a series of calibration experiments using Newtonian suspensions where viscosity is known, is set and is measured. This allows us to come up with an equation to predict suspension viscosity from the measured parameters of the system.
First, we define a Reynolds number for our system as:
| (6) |
where is the suspension density.
We cannot assume the experiments are performed at low , with a laminar flow, so the measurement equipment must be calibrated for a range of Reynolds numbers. The key assumption, when we later use this calibration to determine mush viscosity, is that this viscosity is spatially uniform in the stirred pot, even if the material is thixotropic and (on longer timescales) shear thinning. The experimental justification for this assumption is provided in section V.2.
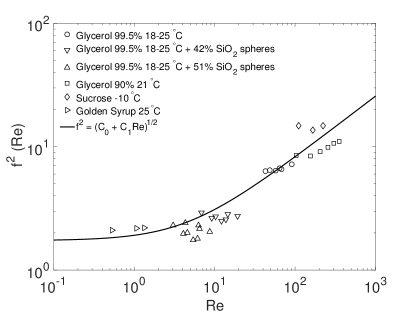
The stirred pot was calibrated using 99.5% glycerol at different temperatures, either alone, or as the liquid phase in a suspension of 100m radii silica spheres at +18∘C, +20∘C and +25∘C (see Fig. 2) and 90% glycerol at +21∘C with no spheres. A second calibration set was performed using 55% sucrose solution in water (with no silica spheres) at C; a temperature and sucrose concentration where no ice is present (these systems are all Newtonian, or predicted to be so from Krieger-Dougherty). A third calibration set was performed using Lyle’s Golden Syrup at +C, this set was performed to observe the limiting behaviour at low . The viscosities of the glycerol and sucrose solutions were measured, while viscosities of the silica sphere suspensions were deduced from these values and the Krieger-Dougherty relation for spheres, Eq. (1), using and maximum packing fraction . The viscosity of golden syrup is 45 Pa s at +25∘C Beckett .
The glycerol and silica sphere suspensions were placed in the stirred pot, and the torque and temperature recorded as a function of time at different angular velocities . The silica sphere suspension volume fractions used were 0, 0.42 and 0.51. For each run, measurements were taken over a time of 30 mins, and were seen to be steady during that time.
The purpose of the calibration is to allow us to deduce the viscosity of a fluid in the stirred pot from the torque and rotation rate. Consider therefore the time-average power dissipated by viscous flow in the stirred pot. Let denote an average over both space (within the pot) and time (over a few rotations), while is the local, instantaneous shear rate in the suspension. Then we note
| (7) |
where the volume occupied by the suspension is
| (8) |
and we have defined . We have also used the assumption that the viscosity is uniform and constant (over a few rotation times at least), to bring outside the spatio-temporal average.
For small (creeping flow) we would expect . However, for larger , there may be a more complicated dependence. In general we take
| (10) |
so that Eqs. (6) and (10) allow us to plot as a function of for the calibration experiments, as shown in Fig. 3.
At low , must tend to a constant, while at higher , we find (approximately). We therefore fit to the following form:
| (11) |
Plotting up the data in Fig. 3, we find that a good fit can be obtained with and . Rearranging and solving the quadratic equation allows us to deduce a (spatially uniform) viscosity for the later experiments from known and measured quantities of and :
| (12) |
where is a non-dimensional quantity given as
| (13) |
We will also want to calculate values for , which from Eq. (7) can be obtained from
| (14) |
Last, we define a root-mean-square stress
| (15) |
V Results for crystal mushes
V.1 Viscosity under constant rotation rate
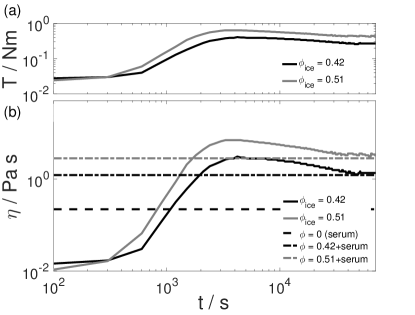
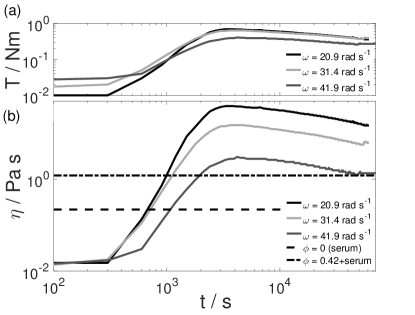
Figures 4(a) and 4(b) show two typical profiles of torque and viscosity [deduced from Eq. (12)] as a function of time for rad s-1 and and .
In Fig. 4(a) the measured torque starts low, as the stirred pot contains only a sucrose solution at +5∘C, and no ice. The increase in torque (and viscosity) up to 5000 s represents both the cooling of the solution and the build-up of ice volume fraction. After this, both the temperature and ice content have reached steady-state values, and it is the rheology from this time onwards that is the subject of the present paper.
Figure 4(b) shows the calculated for ice mushes with and , as well as the viscosity of the sucrose solution serum phase at this temperature () and the predicted value of the viscosity of a Krieger-Dougherty suspension in the same serum phase at volume fractions and . In all cases, the mush viscosity is higher than the Krieger-Dougherty predictions for hard, non-attractive spheres.
The gradual decline of both torque and hence viscosity over the remainder of the experiment is due to the increase of crystal size through ripening. The decline of viscosity with time follows an approximate power law, while there is strong decrease of viscosity with increasing rotation rate , shown in Fig. 5. Between runs at different ice volume fractions we see an increase in viscosity with increasing , however all runs reach peak (and hence ) at the same . This is expected to be a result of clusters aggregating more efficiently under low shear conditions (due to the reduced force to break them up), and the increasingly tortuous routes the serum must flow around the clusters. Shear thinning behavior is seen at higher as higher shear rates disrupt clusters, limiting the degree of aggregation that is possible and hence why high runs show viscosities closer to the Krieger-Dougherty prediction.
From these results, we observe that for the entirety of our run (post-crystallization peak) the viscosity is substantially larger than the Krieger-Dougherty result of non-interacting spheres (dash-dot lines on Figs. 4 and 5). The viscosities decline with a power-law, suggesting that the suspension viscosity may eventually drop to that of the Krieger-Dougherty value and level off. With decreasing the time this levelling off takes is increased.
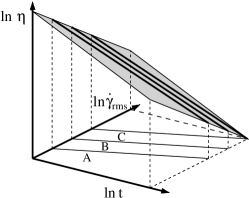
Ultimately, we are interested in the exponents and in Eq. (2). However, in a given experiment at constant rotation rate, both and are changing (the latter because the viscosity changes as the crystals grow in size). We therefore use Eq. (4) to obtain the combinations of exponents and . Because both and are changing, we need to perform a multivariate linear regression on runs at several different rotation rates to obtain the requisite combinations of exponents. The linear regression is shown schematically in Fig. 6, and the results are shown in table 2.
Since in these experiments, when conducted at different shear rates, the samples have undergone differing histories, we do not obtain a simple measurement of the shear thinning exponent alone. This can be seen in Eq. (4), where it is only the combination of exponents that is accessible. To remedy this, we look in the next subsection at experiments where a sample is sheared at a constant initial rate , and then at a consistent time in the experiment, the shear rate is stepped to a new value .
| (ice) | values of / rad s-1 | ||||
|---|---|---|---|---|---|
| 20.9, 31.4, 41.9 | . | ||||
| 20.9, 31.4, 41.9 | n.m. | n.m. | . | ||
| 20.9, 31.4 | n.m. | n.m. | . |
V.2 Viscosity after a step change in rotation rate
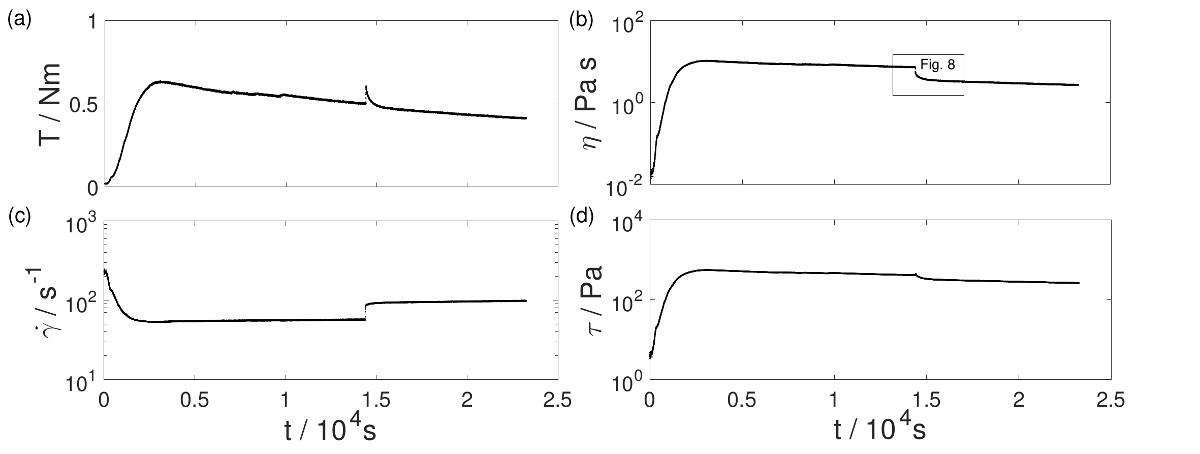
In section IV, for our calibration to be correct, our mushes are expected to see an instantaneously Newtonian response of the suspension to changes in shear rate. This is followed by a thixotropic relaxation period as the clusters re-organize and adapt to their new shear environment. A series of experiments have been run to observe this behavior. Samples are prepared in the same way as for the continuous experiments, and placed in the stirred pot, set at rad s-1 and C. Then, at 14400 s is rapidly raised or lowered to a new rotation rate . The suspension is then allowed to relax with no further changes in . The impeller takes around 10 s to get up to the correct speed when the set-point is changed and, as Fig. 8 shows, the relaxation timescale is considerably greater than 10 s.
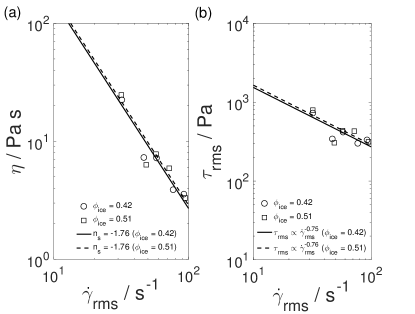
The results of the experiments show that although changes discontinuously, changes continuously (albeit inertia of the experimental apparatus is a potentially confounding effect). The viscosity displays a shear-thinning and thixotropic response [see Figs. 7(a)-(d) and 8 for an increase in ], with a relaxation timescale s much greater than the time for a single rotation of the impeller. From analyzing the instantaneous , and at s, and extrapolating to that time for the relaxed response, we can calculate , and at the step-point for both values of . Plotting these data points in Figs. 9(a) and 9(b) we evaluate from Eq. (2) at 14400 s. Since is constant, can be disregarded in this calculation and we find an average value of .
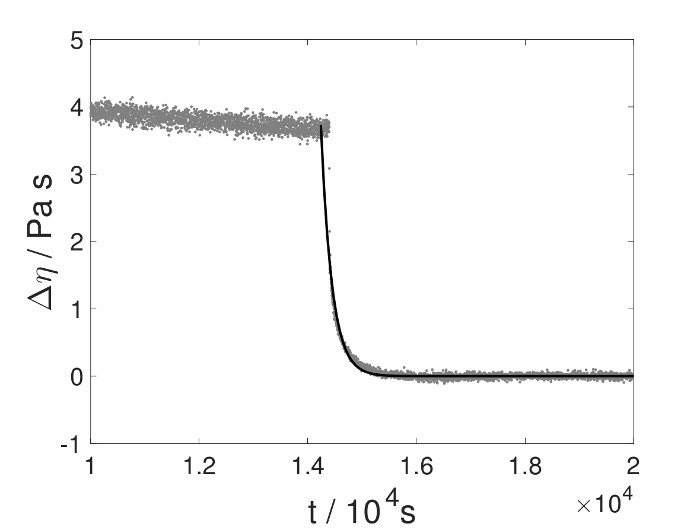
We can calculate the timescale of thixotropic relaxation by fitting an exponential curve to the relaxation period where the long-term trend has been removed. This is shown in Fig. 8 and average values of 370 s for both values of are found in table 3.
| / rad s-1 | / rad s-1 | /s | |
|---|---|---|---|
V.3 Crystal radius and shape
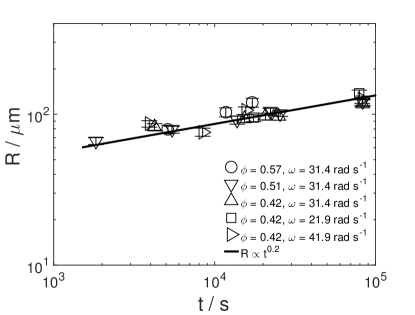
The size and shape of the ice crystals produced were measured at various times during each run. The average radius of the ice crystals increases with time , as seen in Fig 10(a) and 10(b).
At a fixed , one might expect to increase as a power of time , and also to depend on ice volume fraction and perhaps shear rate, as shown in Eq. (3). We believe that the secular increase in crystal size throughout an experiment at constant accounts for the slow decline in torque and (calculated) viscosity.
At zero shear rate, if crystals grow by Ostwald ripening Ostwald , driven by the Laplace pressure of the ice/liquid interfacial energy and limited by the interdiffusivity of solute and solvent through the liquid, then one would expect the ripening exponent . This scaling has been observed not only in the dilute limit where Lifshitz-Slyozov-Wagner (LSW LS ; W ) theory applies, but also in more concentrated systems Bremer . One would expect shear to accelerate the ripening by introducing mixing in addition to diffusion, but the only mechanism which would lead to a change of exponent , is that if interfacial attachment kinetics can limit ripening, rather than diffusion, then a value of would result W . Mixing from shear might push a system into this regime from the diffusion-limited case.
However, from imaging the crystals in the mushes studied here, we observe for a range of conditions (see fig. 11) that at fixed , and depends only weakly on rotation rate. In order to obtain the exponents and in Eq. (3), we again note that at constant , the shear rate will vary with time, so we need to perform bivariate regression analysis, using a range of steady values of , and fitting to a linear combination of and .
The results, shown in table 2, are that is small (indeed consistent with being zero); while takes the unexpectedly low value . (Figure 11 shows a best-fit line with exponent for all crystal sizes; but this includes some data that was excluded from the bivariate regression analysis since we only have different experiments for ). A low value for the exponent (relative to theories of ripening) has also been seen previously in cryogenic ripening under shear Pronk , where ice has been observed crystallizing within a NaCl solution at different temperatures and shear rates. However, to our knowledge, no theory has predicted this exponent for ripening crystal systems.
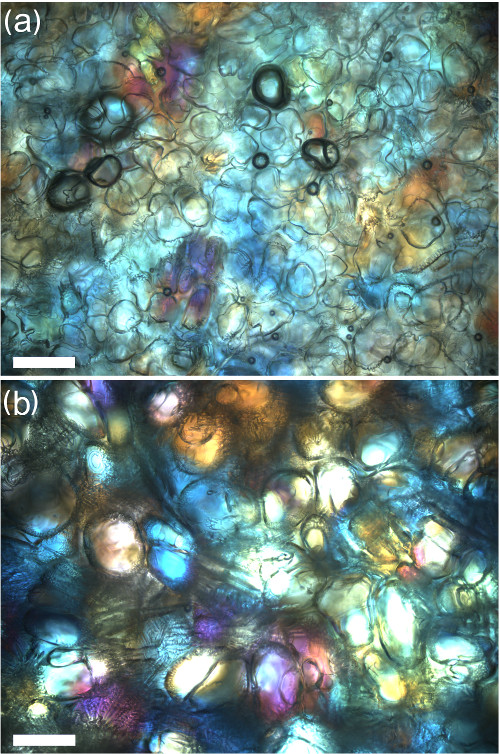
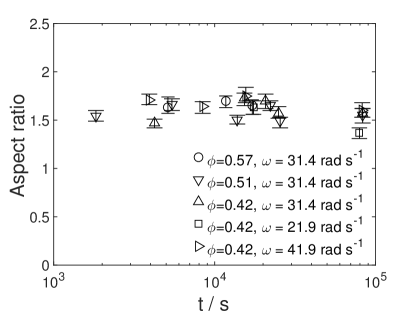
As well as size, we measured the aspect ratios of crystals sampled from the stirred pot. The shape of the crystals does not change significantly with time, with the aspect ratio remaining around 1.6, as shown in Fig. 12 (the same result as observed by Ref. Pronk ).
In some images of ice however, the crystals appeared to be abraded and had rough surfaces and were often misshapen (this can be seen in Fig. 13). Abrasion and breaking of partially sintered grains might be expected to occur under a high shear rate, so these processes are a possible cause for the unexpectedly small growth exponent we observed.
V.4 Values and consistency of the exponents
From the results in tables 2 and Fig. 9(a) we deduce the four exponents, that are predicted in Eqs. (2)–(4) using the step change experiments for and the constant experiments for , and to obtain:
| (16) | |||||
| (17) | |||||
| (18) | |||||
| (19) |
We also have an independent test of these exponents because we measure , but we have not used this in deriving Eqs. (16)–(19). We find, from these equations, . This is consistent with the measured value in table 2 of .
VI Theoretical models
VI.1 Stress arising from dynamic clusters
In this section, we relate our observed rheology to the microstructural physics of the mushes.
At moderate to high volume fraction, the presence of even simple hard particles substantially increases the viscosity of a suspension over that of the serum. For our systems, the introduction of adhesive forces leads to a further large increase in viscosity, as seen in Fig. 5. There are two complementary ways to view this: through power dissipation and through force networks.
In the view based on power dissipation, for hard particles, this power is generated exclusively in the solvent. This remains essentially true if there are adhesive contacts, as long as they are brittle, so they break at very small strains. The increased viscosity arises from the tortuous paths and higher local shear rates imposed upon the serum as it flows around the particles. Even in the absence of adhesive forces, the flow must generate some correlations in particle position Marrucci , otherwise a simple self-consistent picture of particle pairs passing one another would predict a logarithmic divergence of viscosity with , in contrast to the much stronger divergence predicted in Eq. (1). The high viscosities associated with adhesive forces must arise, in this picture, from the formation of extended structures (clusters) of crystals in the flow, which force even larger local strain rates on the serum phase.
The second picture is based on force networks. At high volume fractions, hydrodynamic forces become more localized between neighboring particles, so to a good approximation one can ignore the serum replacing it with pairwise lubrication forces between the crystals.
The key assumption we make in this section is that the clusters formed in the flow are transient and in a quasi-steady state (ignoring the slow ripening dynamics). That is to say they form and break up over a timescale of order an inverse shear rate. More specifically, we suppose that any bond which forms between a pair of crystals survives only for a time before being ruptured. This means that if there are clusters present, a typical tensional force between crystal pairs, in the extensional direction of the flow, is of order the rupture force of the adhesive bond that is present. We assume that this sets the scale for all interparticle forces (extensional or compressive) in the flow.
Let the ’th component of the pair force between particles and be , where the ’th component of the vector joining their centers is , and let the representative volume of the suspension under consideration be . The mean stress tensor in the suspension, with components will be given by Allen
| (20) |
Since contact forces are only possible between near neighbors, the number of pairs of particles per unit volume between which a non-zero force obtains will scale as (with a prefactor that depends slightly on volume fraction near ). For moderate-to-high volume fractions, the length of each vector will be close to , and by assumption the forces are of typical magnitude , the rupture force of an adhesive bond. So from Eq. (20), we arrive at an estimate for the root-mean-square shear stress in the system:
| (21) |
where the constant of proportionality is dimensionless, of order unity, and depends only weakly on volume fraction near .
We expect Eq. (21) to hold while there is a substantial amount of (transient) adhesive clusters in the flow. At high enough shear rates, it is possible that breakup is so effective that all adhesive bonds are broken in a time much less than , so there are effectively no clusters. As this state is approached, there will be a crossover to the hard particle (Krieger-Dougherty) viscosity.
The problem now reduces to finding the maximum force required to separate two crystals after they are brought into contact. We expect this to depend in a power-law manner on the crystal radius and the contact time . Substituting such a power law behavior into Eq. (21), and comparing to Eq. (2) allows us to relate the exponents (which will be predicted by the various theories that follow) to and :
| (22) |
In the following subsection, we present some theories from the literature for the bond strength in terms of and .
VI.2 Theory for adhesive spheres
Johnson-Kendall-Roberts (JKR) theory JKR describes the contact mechanics between two elastic spheres of radius when there is a reversible, adhesive interfacial energy per unit area between them if they touch. The resulting expression for the maximum force to separate them is
| (23) |
From Eq. (22), this leads to predicted exponents .
Direct measurements of adhesive force have been performed on micro-manipulated ice particles in air and sucrose solution Fan . These results are broadly consistent with JKR theory, but display a time dependence not present in the theory.

VI.3 Theory for sintering then brittle fracture
Suppose two crystals have sintered together to form a neck of radius with no elastic stresses present [Fig. 14(a)]. Eventually, this neck will break by brittle fracture (mode I loading Zehnder ) when a tensional force is applied.
Consider the situation when a smaller force is applied, under which the neck may open up an annular crack so that the new radius of the contact disc is [see Fig. 14(b)]. The energy per unit area of the new surface created is , which for a brittle fracture will be similar to the ice/water or ice/vacuum surface energy, but for ductile fracture will be larger, due to plastic deformation near the crack tip.
If we consider the scaling behavior, neglecting numerical factors of order unity, then the energy of the new surface created is
| (24) |
Under the action of the force, the center-to-center distance increases by . The elastic deformation of the spheres is localized to a roughly isotropic region of radius around the center of symmetry of the pair Hertz . Thus the deformed volume is of order and the strain of order . The elastic energy stored is then
| (25) |
where is the elastic modulus of the crystals.
The total energy of the system (surface, elastic, and the work done by the applied force) is thus
| (26) |
For an imposed force the system will choose and to minimize , under the constraint that cannot exceed (and by definition ).
Let us define some non-dimensional parameters of the system:
| (27) |
| (28) |
so that from Eq. (26) the non-dimensionalized total energy is
| (29) |
Consider the behavior of the system when the force is imposed. The starting condition is and . The system will then follow a path downhill in in the space of . This means [see Fig. 15] that provided the separatrix of Eq. (29), which is the contour passing through the saddle point, lies to the left of the starting point, the minimum is achieved when is positive and . However, when increases to the point that the separatrix passes the initial condition [Fig. 15(d)], the system fails catastrophically and and , so the neck breaks and the crystals separate to an arbitrarily large distance.
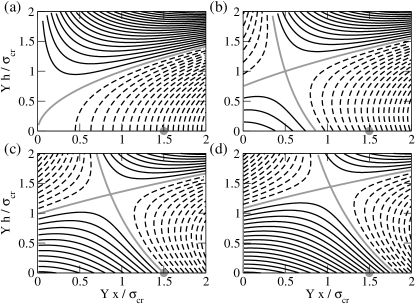
The critical force for this to occur is , which can be found as follows: Treating Eq. (29) as quantitative, the value of at the saddle point, where is . The equation for the separatrix is therefore
| (30) |
and this curve intersects the -axis at . The critical force occurs when this intersection coincides with the initial condition , so restoring dimensions using Eq. (27) we find (up to an unknown numerical prefactor) that
| (31) |
In order to complete this model, we need to know how the radius of the sintered junction between two crystals grows with contact time. Although various mechanisms of sintering are possible German ; Kingery , including plastic flow, van der Waals attraction and vacancy diffusion in the crystal, it is likely that bulk-diffusion-limited liquid-phase sintering is the dominant process for a pair of molecularly rough Burton crystals brought into contact when immersed in a solution of their melt. Even for this process, various theories have been put forward in the literature to describe the growth of the neck radius with contact time (where, to reiterate, in the flow, we will choose ).
For liquid phase sintering, consider the surface mean curvature near the neck region of the pair of sintering crystals. Assuming a crystal has a roughly isotropic surface energy , and a latent heat of fusion per unit volume, the Gibbs-Thomson effect Meissner states that if a flat crystal surface has an (absolute) melting temperature , the melting point of a curved crystal surface will be changed by an amount
| (32) |
For our systems, the crystals are not in contact with their pure melt, but with a solution of sucrose, so that at some temperature , there will be a mass fraction of solute that is in equilibrium with a flat crystal surface. This dissolution curve must be found empirically. Assuming Eq. (32) applies to the dissolution curve when there is solute present, a simple graphical construction shows that at constant temperature, curvature induces a change in the equilibrium solute mass fraction in contact with ice Teardrop :
| (33) |
For water/sucrose systems, thermal diffusion is much faster than mass diffusion CRC , so the system remains isothermal. Surface curvature induces changes in water concentration in the serum phase, and neck growth is driven by mass diffusion down the resulting concentration gradients.
A naïve theory of sintering by dissolution and precipitation posits, on geometrical grounds, that
| (34) |
and furthermore that the concentration difference of Eq. (33) operates over a length scale of order . Therefore the prediction would be that , where is the interdiffusivity of solute and solvent in the unfrozen serum phase. This can be rearranged to give
| (35) |
where . Substituting Eq. (35) into Eq. (31) and then Eq. (22) leads to the predicted exponents
| (36) | |||||
| (37) |
For , this leads to predictions of and .
In contrast, Courtney Courtney argued that diffusion in the narrowing (wedge-shaped) gap between the two spheres is likely to be significantly hindered by the geometry, so that by considering diffusive trajectories and the mass of material that gets added to the neck, it is possible to conclude that the form of Eq. (35) is correct, but with or (depending on detailed assumptions of the timescales involved). Another recent theory from Farr & Izzard Teardrop points out that Eq. (34) is unlikely to be correct, as the narrowest region of the neck may become significantly blunted. By considering a teardrop-shaped solitary wave solution for the sintering of two parallel sheets, the authors ultimately arrive at a prediction again of the form of Eq. (35), but with .
Kingery & Berg Kingery provide scalings for for several different sintering processes. For evaporation-condensation they find
| (38) |
while for diffusion in the crystal
| (39) |
The predicted exponents for all of these mechanisms are shown in table 4 and are compared to the exponents collected from the experimental analysis (section V.4) in Fig. 16. We see that there is good agreement between the experimental dataset collected here, and the exponents found from the naïve liquid phase sintering theory and the evaporation-condensation model of Kingery & Berg Kingery .
| Theoretical model | ||
|---|---|---|
| J.K.R. adhesive spheres JKR | ||
| Naïve theory of fracture & liquid phase sintering | ||
| Fracture & liquid phase sintering by diffusion, short times (Courtney Courtney ) | ||
| Fracture & liquid phase sintering by diffusion, long times (Courtney Courtney ) | ||
| Fracture & liquid phase sintering (Farr & Izzard Teardrop ) | ||
| Fracture & sintering by evaporation-condensation (Kingery & Berg Kingery ) | ||
| Fracture & sintering by vacancy diffusion (Kingery & Berg Kingery ) | ||
| Experimental results |
VII Conclusions and Implications
We have found that the viscosity of ice-sucrose mushes has a power-law dependence on shear rate and crystal size. These powers can be explained due to the formation of clusters of crystals by liquid phase sintering and break-up of these clusters by brittle fracture under flow. We have observed under long timescales the crystals ripen under shear, with a power of time that is smaller than any published theory. We interpret this as possibly due to abrasion or effects of cluster break-up on the crystals.
We believe that the present work, on a model system with sub-spherical, sintering crystals, represents a step towards understanding the rheology of a much broader class of materials which are of great technological and social importance. This class of material includes volcanic and cryogenic lavas, frazil ice, frozen foods and salt slurries.
The phenomenology of ice-sucrose systems should be directly relevant to the behavior of cryogenic lavas, which have been discovered widely throughout the moons and minor planets beyond Mars; for example Ceres Ceres , Ganymede Ganymede , Titan, Enceladus Zhong , Triton Triton and Pluto Pluto . These lavas have various ices present as crystal phases, therefore one would expect liquid phase sintering as suggested here will be relevant to the features produced by such flows Lopes . These results will be of more limited importance to the study of terrestrial lavas, as in general the rheology of such flows can be described by a modified Krieger-Dougherty relationship Vona .
For large bodies of magma which contain reservoirs of crystal mush, the situation is different. Liquid phase sintering has been predicted to occur in granitic mushes with a high degree of partial melt and confirmed through dihedral angles between quartz-feldspar and quartz-quartz grain junctions Jurewicz . There is also extensive evidence of solution-precipitation sintering dynamics in olivine-basalt aggregates CooperKohlstedt1 ; CooperKohlstedt2 .
Knowing viscosity is of crucial importance in understanding the behavior of magmatic hazards. Crystal-rich ignimbrites (from highly voluminous, explosive eruptions) are observed in the rock record Huber , with the crystals expected to come from a long-lived stored mush reservoir Cooper which has been triggered due to a change in the thermal state of the reservoir Huber . Although the Krieger-Dougherty relationship is often used in the literature to describe eruptible magmas with Huber , the yield stress behavior just noted and the shear-rate and time dependence that we have uncovered in the present work suggest that eruptibility of these magmas is being overstated (and the viscosity vastly underestimated) by the Krieger-Dougherty relation.
Moving beyond subspherical crystals, frazil ice forms due to turbulent mixing of supercooled salt water, often in polynyas near ice shelves Martin . The ice crystals formed are needle shaped, and often stick together in clots. We believe the rheology of mushes of high aspect ratio crystals is both of critical importance (since it applies to many magmatic systems as well as frazil ice) but has received little study in the literature. Such systems bring added complexity and experimental challenges from the possibility for flow induced alignment.
Acknowledgements.
The authors gratefully acknowledge William Frith, Jerome Neufeld and Marian Holness for many useful discussions. AJG acknowledges a NERC CASE studentship award [grant number D07591442: MA-2013-00657].References
- (1) H.R. Shaw, J. Petrol. 10(3), p510 (1969).
- (2) L. Caricci, et al., Earth Planet. Sci. Lett. 264(3-4), p402 (2007).
- (3) A. Vona et al., Geochim. Cosmochim. Ac. 75(11), p3214 (2011).
- (4) L.H. Smedsrud and A. Jenkins, J. Geophys. Res. Oceans 109(3) C03025 (2004).
- (5) R.M.C. Lopes, et al., Icarus 186, p395 (2007).
- (6) F. Zhong, et al., Icarus 202, p607 (2009).
- (7) O. Ruesch, et al., Science 353(6303), aaf4286 (2016).
- (8) C. Clark, The science of ice cream, RSC Publishing (2004).
- (9) J.R. Stokes, J.H. Telford and A-M. Williamson, J. Rheol. 49(1), p139 (2005).
- (10) I. Dinçer and M. Kanoǵlu, Refrigeration Systems and Applications, Wiley (2010)
- (11) A.K. Dahle and D.H. StJohn, Acta Mater. 47(1), 31 (1998).
- (12) J.T. Black and R.A. Kohser, DeGarmo’s Materials and Processes in Manufacturing John Wiley and Sons (2011).
- (13) W.B. Sudweeks, Ind. Eng. Chem. Prod. Res. Dev. 24, p432 (1985).
- (14) C. A. Baar, Applied Salt-Rock Mechanics 1: The in-situ behavior of salt rocks, Elsevier (2013).
- (15) H.C. Hamaker, Physica 4(10), p1058 (1937).
- (16) R.M. German, P. Suri and S.J. Park, J. Mater. Sci. 44, p1 (2009).
- (17) W. Ostwald, Z. Phys. Chem. 37, p385 (1901).
- (18) I.M. Lifshitz and V.V. Sloyozov, J. Phys. Chem. Solids 19, p35 (1961).
- (19) C. Wagner, Z. Elektrochem 65, p581 (1961).
- (20) J.S. Kargel, et al., Icarus 89, p93 (1991).
- (21) J. Mewis and N.J. Wagner, Adv. in Coll. Int. Sci. 147-148, 214 (2009).
- (22) A. Einstein Annalen der Physik 19, p289 (1906).
- (23) G.B. Jeffery, Proc. Roy. Soc. A102, p161 (1922).
- (24) C.G. de Kruif, et al., J. Chem. Phys. 83(9), p4717 (1985).
- (25) J. Bernal and J. Mason, Nature 188, p910 (1960).
- (26) C. Song, P. Wang and H.A. Makse, Nature 453, p629 (2008).
- (27) H.M. Jaeger, S.R. Nagel and R.P Behringer, Rev. Mod. Phys. 68(4), p1259 (1996).
- (28) R.S. Farr, J.R. Melrose and R.C. Ball, Phys. Rev. E, 55(6), p7203 (1997).
- (29) I.M. Krieger and T.J. Dougherty, Trans. Soc. Rheol. 3, p137 (1959).
- (30) G.W. Delaney and P.W. Cleary, EPL 89(3), 34002 (2010).
- (31) G.M. Delaney, J.E. Hilton and P.W. Cleary, Phys. Rev. E 83, 051305 (2011).
- (32) R.S. Farr and R.D. Groot, J. Chem. Phys. 131(24), 244104 (2009).
- (33) R.S. Farr, J. Chem. Phys. 141(21), 214503 (2014).
- (34) T.A. Witten and L.M. Sander, Phys. Rev. Lett. 47(19), p1400 (1981).
- (35) M.Y. Lin, et al., Nature 339(6223), p360 (1989).
- (36) R. Buscall, et al., J. Chem. Soc., Farad. Trans. 1. 84(12), p4249 (1988).
- (37) R. Buscall, P.J. Scales, A.D. Stickland, H-E. Teo and D.R. Lester, J. Non-Newtonian Fluid Mech. 221, 40 (2015).
- (38) R. Buscall et al., J. Non-Newtonian Fluid Mech. 222, 112 (2015).
- (39) P. Schall and M. van Hecke, Ann. Rev. Fluid Mech. 42, p67 (2010).
- (40) H.A. Barnes, An introduction to rheology, Elsevier (1989).
- (41) M. Wyart and M.E. Cates, Phys. Rev. Lett. 112, 098302 (2014).
- (42) W.D. Kingery and M. Berg, J. Appl. Phys. 26, p1205 (1955).
- (43) F.M. Beckett, H.M. Mader, J.C. Phillips, A.C. Rust and F. Witham, J. Fluid Mech. 662, p652 (2011).
- (44) L. Bremer, et al., Part. Part. Syst. Charact. 13, p350 (1996).
- (45) P. Pronk, et al., Int. J. Refrigeration 28, p27 (2005).
- (46) G. Marrucci and M.M. Denn, Rheologica Acta 24(3), p317 (1985).
- (47) M.P. Allen and D.J. Tildesley, Computer simulation of liquids, (Clarendon Press, Oxford, 1987).
- (48) K.L. Johnson, K. Kendall and A.D. Roberts, Proc. R. Soc. London A 324, p301 (1971).
- (49) X. Fan, et al., Powder Technol. 131, p105 (2003).
- (50) A.T. Zehnder, Fracture mechanics (Springer, 2012).
- (51) H. Hertz, Journal für die reine und angewandte Mathematik, 92, p156 (1882).
- (52) W.K. Burton, N. Cabrera and F.C. Frank, Philos. Trans. R. Soc. London A 243, 299 (1951).
- (53) F. Meissner, Zeitschrift für anorganische und allgemeine Chemie 110(1), 169 (1920).
- (54) W.M. Haynes, CRC Handbook of Chemistry and Physics (CRC Press, 2016).
- (55) R.S. Farr and M.J. Izzard, Phys. Rev. E 77, 041608 (2008).
- (56) T.H. Courtney, Metall. Trans. A 8A, p671 (1977).
- (57) A.P. Showman, I. Mosqueira and J.W. Head III, Icarus, 172, p625 (2004).
- (58) A.D. Fortes et al., Icarus, 188, p139 (2007).
- (59) J.M. Moore et al., Science, 351(6279), p1284 (2016).
- (60) S.R. Jurewicz and E.B. Watson, Geochim. Cosmochim. Ac. 49, p1109 (1985).
- (61) R.F. Cooper and D.L. Kohlstedt, Phys. Chem. Minerals 11, p5 (1984).
- (62) R.F. Cooper and D.L. Kohlstedt, J. Geophys. Res. 91, p9315 (1986)
- (63) C. Huber, O. Bachmann and J. Dufek, Geology 40, p115 (2012).
- (64) K.M. Cooper and J.R. Kent, Nature 506, p840 (2014).
- (65) S. Martin, Ann. Rev. Fluid. Mech. 13, p379 (1981).