Precise measurement of the cross section at center-of-mass energies from 3.77 to 4.60 GeV
Abstract
The cross section for the process is measured precisely at center-of-mass energies from 3.77 to 4.60 GeV using 9 fb-1 of data collected with the BESIII detector operating at the BEPCII storage ring. Two resonant structures are observed in a fit to the cross section. The first resonance has a mass of MeV/ and a width of MeV, while the second one has a mass of MeV/ and a width of MeV, where the first errors are statistical and second ones are systematic. The first resonance agrees with the resonance reported by previous experiments. The precision of its resonant parameters is improved significantly. The second resonance is observed in for the first time. The statistical significance of this resonance is estimated to be larger than . The mass and width of the second resonance agree with the resonance reported by the and Belle experiments within errors. Finally, the resonance previously observed by the Belle experiment is not confirmed in the description of the BESIII data.
pacs:
14.40.Rt, 13.25.Gv, 14.40.Pq, 13.66.BcThe process at center-of-mass (c.m.) energies between 3.8 and 5.0 GeV was first studied by the BABAR experiment using an initial-state-radiation (ISR) technique babary , and a new structure, the , was reported with a mass around 4.26 GeV/. This observation was immediately confirmed by the CLEO cleoy and Belle experiments belley in the same process. In addition, the Belle experiment reported an accumulation of events at around 4 GeV, which was called later. Although the state is still controversial — a new measurement by the BABAR experiment does not confirm it babarnew , while an updated measurement by the Belle experiment still supports its existence bellenew — the observation of the -states has stimulated substantial theoretical discussions on their nature epjc-review ; zhusl_review .
Being produced in annihilation, the -states have quantum numbers . However, unlike the known charmonium states in the same mass range, such as , and pdg , which decay predominantly into open charm final states [], the states show strong coupling to hidden-charm final states hidden . Furthermore, the observation of the states and in y4360 , together with the newly observed resonant structures in omega-cc0 and pphc , overpopulate the vector charmonium spectrum predicted by potential models potential . All of this indicates that the states may not be conventional charmonium states, and they are good candidates for new types of exotic particles, such as hybrids, tetraquarks, or meson molecules epjc-review ; zhusl_review .
The state was once considered a good hybrid candidate hybrid since its mass is close to the value predicted by the flux tube model for the lightest hybrid charmonium flux-tube . Recent lattice calculations also show a hybrid charmonium could have a mass of MeV/ hybrid-lattice or 4.33(2) GeV/ hybrid-y4360 . Meanwhile, the diquark-antidiquark tetraquark model predicts a wide spectrum of states which can also accommodate the tetraquark . Moreover, the mass of is near the mass threshold of , , and , and was supposed to be a meson molecule candidate of these meson pairs molecule ; molecule-more . A recent observation of a charged charmoniumlike state by BESIII zc3900 , Belle bellenew and with CLEO data zc-cleo seems favor the meson pair option molecule . Another possible interpretation describes the as a heavy charmonium () being bound inside light hadronic matter — hadro-charmonium hadro-charmonium . To better identify the nature of the states and distinguish various models, more precise experimental measurements, including the production cross section, the mass and width of the states, are essential.
In this Letter, we report a precise measurement of the cross section at c.m. energies from 3.77 to 4.60 GeV, using a data sample with an integrated luminosity of fb-1 lum collected with the BESIII detector operating at the BEPCII storage ring bes3-detector . The candidate is reconstructed with its leptonic decay modes ( and ). The data sample used in this measurement includes two independent data sets. A high luminosity data set (dubbed “XYZ data”) contains more than 40 pb-1 at each c.m. energy with a total integrated luminosity of 8.2 fb-1, which dominates the precision of this measurement; and a low luminosity data set (dubbed “Scan data”) contains about 7–9 pb-1 at each c.m. energy with a total integrated luminosity of 0.8 fb-1. The integrated luminosities are measured with Bhabha events with an uncertainty of lum . The c.m. energy of each data set is measured using dimuon events, with an uncertainty of MeV ecm .
The BESIII detector is described in detail elsewhere bes3-detector . The geant4-based geant4 Monte Carlo (MC) simulation software package boost boost , which includes the geometric description of the BESIII detector and the detector response, is used to optimize event selection criteria, determine the detection efficiency, and estimate the backgrounds. For the signal process, we generate 60,000 events at each c.m. energy of the “XYZ data”, and an extrapolation is performed to the “Scan data” with nearby c.m. energies. At c.m. energies between 4.189 and 4.358 GeV, the signal events are generated according to the Dalitz plot distributions obtained from the data set at corresponding c.m. energy, since there is significant production bellenew ; zc3900 ; zc-cleo . At other c.m. energies, signal events are generated using an evtgen evtgen phase space model. The decays into and with same branching fractions pdg . The ISR is simulated with kkmc kkmc , and the maximum ISR photon energy is set to correspond to a GeV/ production threshold of the system. Final-state-radiation (FSR) is simulated with photos photos . Possible background contributions are estimated with kkmc-generated inclusive MC samples [ and with ] with comparable integrated luminosities to the “XYZ data”.
Events with four charged tracks with zero net charge are selected. For each charged track, the polar angle in the drift chamber must satisfy , and the point of closest approach to the interaction point must be within cm in the beam direction and within cm in the plane perpendicular to the beam direction. Taking advantage of the fact that pions and leptons are kinematically well separated in the signal decay, charged tracks with momenta larger than 1.06 GeV/ in the laboratory frame are assumed to be leptons, and the others are assumed to be pions. We use the energy deposited in the electromagnetic calorimeter (EMC) to separate electrons from muons. For both muon candidates, the deposited energy in the EMC is required to be less than 0.35 GeV, while for both electrons, it is required to be larger than 1.1 GeV. To avoid systematic errors due to unstable operation, the muon system is not used here. Each event is required to have one ( or ) combination.
To improve the momentum and energy resolution and to reduce the background, a four-constraint (4C) kinematic fit is applied to the event with the hypothesis , which constrains the total four-momentum of the final state particles to that of the initial colliding beams. The of the kinematic fit is required to be less than .
To suppress radiative Bhabha and radiative dimuon () backgrounds associated with photon conversion to an pair which subsequently is misidentified as a pair, the cosine of the opening angle of the pion-pair () candidates is required to be less than 0.98 both for and events. For events, since there are more abundant photon sources from radiative Bhabha events, we further require the cosine of the opening angles of both pion-electron pairs () to be less than 0.98. These requirements remove almost all of the Bhabha and dimuon background events, with an efficiency loss of less than 1% for signal events.
After imposing the above selection criteria, a clear signal is observed in the invariant mass distribution of the lepton pairs []. The mass resolution of the distribution is estimated to be MeV/ for , and MeV/ for in data for the range of c.m. energies investigated in this study. The mass window is defined as GeV/. In order to estimate the non- backgrounds contribution, we also define the mass sideband as GeV/ and GeV/, which is three times as wide as the signal region. The dominant background comes from () processes, such as . Since events form a smooth distribution in the signal region, their contribution is estimated by the mass sideband. Contributions from backgrounds related with charm quark production, such as etaJpsi , and other open-charm mesons, are estimated to be negligible according to MC simulation studies.
In order to determine the signal yields, we make use of both fitting and counting methods on the distribution. In the “XYZ data”, each data set contains many signal events, and an unbinned maximum likelihood fit to the distribution is performed. We use a MC simulated signal shape convolved with a Gaussian function (with standard deviation MeV, which represents the resolution difference between the data and the MC simulation) as the signal probability density function (PDF), and a linear term for the background. For the “Scan data”, due to the low statistics, we directly count the number of events in the signal region and that of the normalized background events in the mass sideband, and take the difference as the signal yields.
The cross section of at a certain c.m. energy is calculated using
| (1) |
where is the number of signal events, is the integrated luminosity of data, is the ISR correction factor, is the detection efficiency, and is the branching fraction of pdg . The ISR correction factor is calculated using the kkmc kkmc program. To get the correct ISR photon energy distribution, we use the dependent cross section line shape of the process, i.e. to replace the default one of kkmc. Since is what we measure in this study, the ISR correction procedure needs to be iterated, and the final results are obtained when the iteration converges. Figure 1 shows the measured cross section from both the “XYZ data” and “Scan data” (Numerical results are listed in the supplemental material supplement ).
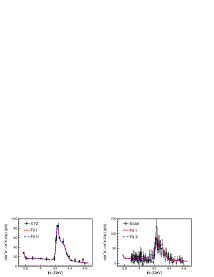
To study the possible resonant structures in the process, a binned maximum likelihood fit is performed simultaneously to the measured cross section of the “XYZ data” with Gaussian uncertainties and the “Scan data” with Poisson uncertainties. The PDF is parameterized as the coherent sum of three Breit-Wigner (BW) functions, together with an incoherent component which accounts for the decay of , with mass and width fixed to PDG pdg values. Due to the lack of data near the resonance, it is impossible to determine the relative phase between the amplitude and the other amplitudes. The amplitude to describe a resonance is written as
| (2) |
where , and are the mass, full width and electronic width of the resonance , respectively; is the branching fraction of the decay ; is the phase space factor of the three-body decay pdg , and is the phase of the amplitude. The fit has four solutions with equally good fit quality multi-solution and identical masses and widths of the resonances (listed in Table 1), while the phases and the product of the electronic widths with the branching fractions are different (listed in Table 2). Figure 1 shows the fit results. The resonance has a mass and width consistent with that of observed by Belle bellenew within and , respectively. The resonance has a mass MeV/, which agrees with the average mass, MeV/ pdg , of the peak babary ; cleoy ; belley ; babarnew ; bellenew within . However, its measured width is much narrower than the average width, MeV pdg , of the . We also observe a new resonance . The statistical significance of is estimated to be (including systematic uncertainties) by comparing the change of with and without the amplitude in the fit, and taking the change of number of degree of freedom into account. The fit quality is estimated using a -test method, with . Fit models taken from previous experiments babary ; cleoy ; belley ; babarnew ; bellenew are also investigated and are ruled out with a confidence level equivalent to more than .
| Parameters | Fit result |
|---|---|
| () | |
| () | |
| () | |
| () | |
| () | |
| () |
| Parameters | Solution I | Solution II | Solution III | Solution IV |
|---|---|---|---|---|
| () | ||||
| () | () | () | () | |
| () | () | () | () | |
| () | () | () | () | |
| () | () | () | () | |
| () | () | () | () | |
As an alternative description of the data, we use an exponential exp to model the cross section near 4 GeV as in Ref. babarnew , instead of the resonance . The fit results are shown as dashed lines in Fig. 1. This model also describes data very well. A -test to the fit quality gives . Thus, the existence of a resonance near 4 GeV, such as the resonance or the resonance belley , is not necessary to explain the data. The fit has four solutions with equally good fit quality multi-solution and identical masses and widths of the resonances (listed in Table 1), while the phases and the product of the electronic widths with the branching fractions are different (listed in Table 2). We observe the resonance and the resonance again. The statistical significance of resonance in this model is estimated to be (including systematic uncertainties) [, ] using the same method as above.
The systematic uncertainty for the cross section measurement mainly comes from uncertainties in the luminosity, efficiencies, radiative correction, background shape and branching fraction of . The integrated luminosities of all the data sets are measured using large angle Bhabha scattering events, with an uncertainty of 1% lum . The uncertainty in the tracking efficiency for high momentum leptons is 1% per track. Pions have momenta that range from 0.1 to 1.06 GeV/, and their momentum weighted tracking efficiency uncertainty is also 1% per track. For the kinematic fit, we use a similar method as in Ref. kinematic-fit to improve the agreement of the distribution between data and MC simulation, and the systematic uncertainty for the kinematic fit is estimated to be 0.6% (1.1%) for () events. For the MC simulation of signal events, we use both the model bellenew ; zc3900 ; zc-cleo and the phase space model to describe the process. The efficiency difference between these two models is 3.1%, which is taken as systematic uncertainty due to the decay model.
The efficiency for the other selection criteria, the trigger simulation, the event start time determination and the FSR simulation are quite high (), and their systematic errors are estimated to be less than 1%. In the ISR correction procedure, we iterate the cross section measurement until converges. The convergence criterion is taken as the systematic uncertainty due to the ISR correction, which is 1%. We obtain the number of signal events by either fitting or counting events in the distribution. The background shape is described by a linear distribution. Varying the background shape from a linear shape to a second-order polynomial causes a 1.6% (2.1%) difference for the signal yield for the () mode, which is taken as the systematic uncertainty for background shape. The branching fraction of is taken from PDG pdg , the errors are 0.6% for both decay modes. Assuming all the sources of systematic uncertainty to be independent, the total systematic uncertainties are obtained by adding them in quadrature, resulting in 5.7% for the mode, and 5.9% for the mode.
In both fit scenarios to the cross section, we observe the resonance and . Since we can not distinguish the two scenarios from data, we take the difference in mass and width as the systematic uncertainties, i.e. 1.1 (6.8) MeV/ for the mass and 0.0 (3.2) MeV for the width of . The absolute c.m. energy of all the data sets were measured with dimuon events, with an uncertainty of MeV. Such kind of common uncertainty will propagate only to the masses of the resonances with the same amount, i.e. MeV/. In both fits, the amplitude was added incoherently. The possible interference effect of component was investigated by adding it coherently in the fit with various phase. The largest deviation of the resonant parameters between the fits with and without interference for the amplitude are taken as systematic error, which is 0.3 (1.3) MeV/ for the mass, and 2.0 (9.7) MeV for the width of the resonance. Assuming all the systematic uncertainties are independent, we get the total systematic uncertainties by adding them in quadrature, which is 1.4 (7.0) MeV/ for the mass, and 2.0 (10.2) MeV for the width of , respectively.
In summary, we perform a precise cross section measurement of for c.m. energies from to 4.60 GeV. Two resonant structures are observed, one with a mass of MeV/ and a width of MeV, and the other with a mass of MeV/ and a width of MeV, where the first errors are statistical and the second ones are systematic. The first resonance agrees with the resonance reported by BABAR, CLEO and Belle babary ; cleoy ; belley ; babarnew ; bellenew . However, our measured width is much narrower than the average width pdg reported by previous experiments. This is thanks to the much more precise data from BESIII, which results in the observation of the second resonance. The second resonance is observed for the first time in the process . Its statistical significance is estimated to be larger than . The second resonance has a mass and width comparable to the resonance reported by Belle and BABAR in y4360 . If we assume it is the same resonance as the , we observe a new decay channel of for the first time. Finally, we can not confirm the existence of the resonance belley ; bellenew from our data, since a continuum term also describes the cross section near 4 GeV equally well.
The BESIII collaboration thanks the staff of BEPCII and the IHEP computing center for their strong support. This work is supported in part by National Key Basic Research Program of China under Contract No. 2015CB856700; National Natural Science Foundation of China (NSFC) under Contracts Nos. 11235011, 11322544, 11335008, 11425524; the Chinese Academy of Sciences (CAS) Large-Scale Scientific Facility Program; the CAS Center for Excellence in Particle Physics (CCEPP); the Collaborative Innovation Center for Particles and Interactions (CICPI); Joint Large-Scale Scientific Facility Funds of the NSFC and CAS under Contracts Nos. U1232201, U1332201; CAS under Contracts Nos. KJCX2-YW-N29, KJCX2-YW-N45; 100 Talents Program of CAS; National 1000 Talents Program of China; INPAC and Shanghai Key Laboratory for Particle Physics and Cosmology; German Research Foundation DFG under Contracts Nos. Collaborative Research Center CRC 1044, FOR 2359; Istituto Nazionale di Fisica Nucleare, Italy; Joint Large-Scale Scientific Facility Funds of the NSFC and CAS under Contract No. U1532257; Joint Large-Scale Scientific Facility Funds of the NSFC and CAS under Contract No. U1532258; Koninklijke Nederlandse Akademie van Wetenschappen (KNAW) under Contract No. 530-4CDP03; Ministry of Development of Turkey under Contract No. DPT2006K-120470; NSFC under Contract No. 11275266; The Swedish Resarch Council; U. S. Department of Energy under Contracts Nos. DE-FG02-05ER41374, DE-SC-0010504, DE-SC0012069, DESC0010118; U.S. National Science Foundation; University of Groningen (RuG) and the Helmholtzzentrum fuer Schwerionenforschung GmbH (GSI), Darmstadt; WCU Program of National Research Foundation of Korea under Contract No. R32-2008-000-10155-0.
References
- (1) B. Aubert et al. (BABAR Collaboration), Phys. Rev. Lett. 95, 142001 (2005).
- (2) Q. He et al. (CLEO Collaboration), Phys. Rev. D 74, 091104(R) (2006).
- (3) C. Z. Yuan et al. (Belle Collaboration), Phys. Rev. Lett. 99, 182004 (2007).
- (4) J. P. Lees et al. (BABAR Collaboration), Phys. Rev. D 86, 051102(R) (2012).
- (5) Z. Q. Liu et al. (Belle Collaboration), Phys. Rev. Lett. 110, 252002 (2013).
- (6) N. Brambilla et al., Eur. Phys. J. C 71, 1534 (2011).
- (7) H. X. Chen, W. Chen, X. Liu and S. L. Zhu, Phys. Rep. 639, 1 (2016).
- (8) K. A. Olive et al. (Particle Data Group), Chin. Phys. C 38, 090001 (2014).
- (9) X. H. Mo et al., Phys. Lett. B 640, 182 (2006).
- (10) B. Aubert et al. (BABAR Collaboration), Phys. Rev. Lett. 98, 212001 (2007); X. L. Wang et al. (Belle Collaboration), Phys. Rev. Lett. 99, 142002 (2007); B. Aubert et al. (BABAR Collaboration), Phys. Rev. D 89, 111103 (2014); X. L. Wang et al. (Belle Collaboration), Phys. Rev. D 91, 112007 (2015).
- (11) M. Ablikim et al. (BESIII Collaboration), Phys. Rev. Lett. 114, 092003 (2015); Phys. Rev. D 93, 011102(R) (2016).
- (12) Chang-Zheng Yuan, Chin. Phys. C 38 (2014) 043001; M. Ablikim et al. (BESIII Collaboration), arXiv:1610.07044.
- (13) E. Eichten et al., Phys. Rev. D 17, 3090 (1978); 21, 203 (1980); S. Godfrey and N. Isgur, Phys. Rev. D 32, 189 (1985).
- (14) F. E. Close, P. R. Page, Phys. Lett. B 628, 215 (2005); S. L. Zhu, Phys. Lett. B 625, 212 (2005).
- (15) T. Barnes, F. E. Close, E. S. Swanson, Phys. Rev. D 52, 9 (1995).
- (16) L. Liu et al. (Hadron Spectrum Collaboration), J. High Energy Phys. 07, 126 (2012).
- (17) Ying Chen et al., Chin. Phys. C 40, 081002 (2016).
- (18) L. Maiani et al., Phys. Rev. D 72, 031502 (2005); D. Ebert, R. N. Faustov, V. O. Galkin, Eur. Phys. J. C 58, 399 (2008).
- (19) Q. Wang, C. Hanhart and Q. Zhao, Phys. Rev. Lett. 111, 132003 (2013); M. Cleven et al., Phys. Rev. D 90, 074039 (2014).
- (20) A. M. Torres et al., Phys. Rev. D 80, 094012 (2009); R. M. Albuquerque, M. Nielsen, Nucl. Phys. A 815, 53 (2009).
- (21) M. Ablikim et al. (BESIII Collaboration), Phys. Rev. Lett. 110, 252001 (2013).
- (22) T. Xiao et al., Phys. Lett. B 727, 366 (2013).
- (23) S. Dubynskiy, M. B. Voloshin, Phys Lett. B 666, 344 (2008); Xin Li and M. B. Voloshin, Mod. Phys. Lett. A 29, 1450060 (2014).
- (24) M. Ablikim et al. (BESIII Collaboration), Chin. Phys. C 39, 093001 (2015); Chin. Phys. C 37, 123001 (2013).
- (25) M. Ablikim et al. (BESIII Collaboration), Nucl. Instrum. Methods Phys. Res., Sect. A 614, 345 (2010).
- (26) M. Ablikim et al. (BESIII Collaboration), Chin. Phys. C 40, 063001 (2016).
- (27) S. Agostinelli et al. (GEANT4 Collaboration), Nucl. Instrum. Methods A 506, 250 (2003).
- (28) Z. Y. Deng et al., Chin. Phys. C 30, 371 (2006).
- (29) D. J. Lange, Nucl. Instrum. Methods Phys. Res., Sect. A 462, 152 (2001).
- (30) S. Jadach, B. F. L. Ward, and Z. Was, Comput. Phys. Commun. 130, 260 (2000); Phys. Rev. D 63, 113009 (2001).
- (31) P. Golonka, and Z. Was, Eur. Phys. J. C 45, 97 (2006).
- (32) M. Ablikim et al. (BESIII Collaboration), Phys. Rev. D 86, 071101(R) (2012); X. L. Wang et al. (Belle Collaboration), Phys. Rev. D 87, 051101(R) (2013); M. Ablikim et al. (BESIII Collaboration), Phys. Rev. D 91, 112005 (2015).
- (33) See supplemental material at [URL will be inserted by publisher] for a summary of number of signal events, luminosity, and cross section at each energy.
- (34) K. Zhu et al. Int. J. Mod. Phys. A 26 (2011) 4511-4520; A. D. Bukin, arXiv:0710.5627.
- (35) , where and are free parameters, is the mass threshold of the system, and the phase space factor.
- (36) M. Ablikim et al. (BESIII Collaboration), Phys. Rev. D 87, 012002 (2013).
Appendix
| (GeV) | (pb-1) | ||||
|---|---|---|---|---|---|
| 3.7730 | 2931.8 | 0.423 | 0.732 | ||
| 3.8077 | 50.5 | 0.396 | 0.871 | ||
| 3.8962 | 52.6 | 0.393 | 0.856 | ||
| 4.0076 | 482.0 | 0.392 | 0.901 | ||
| 4.0855 | 52.6 | 0.374 | 0.961 | ||
| 4.1886 | 43.1 | 0.394 | 0.858 | ||
| 4.2077 | 54.6 | 0.446 | 0.740 | ||
| 4.2171 | 54.1 | 0.458 | 0.731 | ||
| 4.2263 | 1091.7 | 0.465 | 0.748 | ||
| 4.2417 | 55.6 | 0.453 | 0.802 | ||
| 4.2580 | 825.7 | 0.444 | 0.853 | ||
| 4.3079 | 44.9 | 0.398 | 0.917 | ||
| 4.3583 | 539.8 | 0.372 | 1.022 | ||
| 4.3874 | 55.2 | 0.331 | 1.155 | ||
| 4.4156 | 1073.6 | 0.302 | 1.227 | ||
| 4.4671 | 109.9 | 0.293 | 1.240 | ||
| 4.5271 | 110.0 | 0.293 | 1.223 | ||
| 4.5745 | 47.7 | 0.281 | 1.213 | ||
| 4.5995 | 566.9 | 0.274 | 1.205 |
| (GeV) | (pb) | (GeV) | (pb) | (GeV) | (pb) | (GeV) | (pb) |
|---|---|---|---|---|---|---|---|