Atomistic mechanisms governing structural stability change of zinc antimony thermoelectrics
Abstract
The structural stability of thermoelectric materials is a subject of growing importance for their energy harvesting applications. Here we study the microscopic mechanisms governing the structural stability change of zinc antimony at its working temperature, using molecular dynamics combined with experimental measurements of the electrical and thermal conductivity. Our results show that the temperature-dependence of the thermal and electrical transport coefficients is strongly correlated with a structural transition. This is found to be associated with a relaxation process, in which a group of Zn atoms migrated between interstitial sites. This atom migration gradually leads to a stabilizing structural transition of the crystal framework, then results in a more stable crystal structure of \ceZn4Sb3 at high temperature.
Thermoelectric materials converting heat into electric power and vice versa, are of widespread interest for applications in energy harvesting and interconnection technologies.Bell (2008) For decades most of previous studies in this field have been focusing on the strategies to improve the thermoelectric energy conversion efficiency gauged by a dimensionless figure of merit ZT.Vineis et al. (2010) Pei et al. (2012) Zebarjadi et al. (2012) Besides the ZT, the thermal stability is also a key requirement for applications of thermoelectric materials,Li et al. (2010) Snyder and Toberer (2008) since their performance strongly depends on the material microstructure.Pei et al. (2012) Biswas et al. (2012) Singh (2010) Despite its importance, only have a few attempts been made to address the thermal stability issue of thermoelectrics at their elevated working temperature.Snyder et al. (2004) Wang et al. (2013) Xu et al. (2010) Yin et al. (2011)
Zinc antimony is a typical ’phonon glass, electron crystal’, one of the best thermoelectrics at moderate temperature.Caillat et al. (1997) Nylen et al. (2004) Toberer et al. (2010)In our previous experiments, it was found that \ceZn4Sb3 samples become metastable around 425 K, but above 565K it recovers its stability.Lin et al. (2014) Our previous simulation results showed that the diffusion of Zn atoms above 425K brings remarkable anharmonicity to the system vibration, and therefore is responsible for the low thermal conductivity of \ceZn4Sb3 in the order of those found in amorphous solids.Li et al. (2013) However, the physical reasons behind the structural stability change remained as a open question, despite this is another key to its excellent thermoelectric performance at moderate temperature.
Thus in the present work, we try to look into this issue from an atomistic point of view using molecular dynamics (MD) simulations combining with experimental measurements on the electrical and thermal conductivities of \ceZn4Sb3. We started by building a complex hexagonal structure that corresponds to the conventional pristine structure of -\ceZn4Sb3 with a concentration of Zn equal to at. However, this structure has been found to be thermally unstable in experiments.Izard et al. (2002) In order to obtain more realistic structure of the sample,Toberer et al. (2010) Nylen et al. (2004) Toberer et al. (2007) three Zn atoms were randomly inserted into interstitial positions at each unit cell. This yields a Zn concentration of at, that has been found to avoid phase separation.Rauwel et al. (2011) In our simulations we employed the classical parallel molecular dynamics package LAMMPS.Plimpton (1995) The simulation box comprised monoclinic unit cells with 14904 atoms (containing Sb1 atoms, Sb2 atoms, Zn1 atoms and Zn2 atoms), with periodic boundary conditions applied in all three spatial directions. The equations of motion were integrated using the velocity Verlet algorithm with a time step of . The simulations were performed in the isothermal-isobaric ensemble (NPT) with the Nosé-Hoover thermostat helping the system reach thermal equilibrium at different temperatures before any statistical analysis was performed. Atomistic interactions were described by a pairwise potential that has been successfully applied to study mechanical Li et al. (2011) and phononic behaviors of \ceZn4Sb3Li et al. (2013). Benchmark runs were performed to reproduce the characteristic to phase transition around 250K, which manifests itself as a sharp step in the potential energy during a cooling process.
In our experiments, a group of -\ceZn4Sb3 samples were prepared by plasma activated sintering system (PAS) with a starting Zn composition of at. The compounds were prepared from at-purity zinc shots and at-purity antimony powder(Sinpharm Chemical Reagent Co.Ltd). These elements were loaded into a quartz ampoule and sealed under vacuum down to torr. After sealing, the ampoules were placed in a box furnace and heated to 1023 K at a rate of 375 and kept at that temperature for 72 hours. Finally, they were quenched in cold water. The obtained ingots were ground in an agate mortar and sieved. Powders of upto 48m diameter were loaded into graphite dies and sintered under vacuum (5 Pa) using PAS at a pressure of 100 MPa and 723 K for 5 minutes. The heating rate of PAS is 400 . The density () of the sintered samples were measured using the conventional Archimedes principle and were found to be of its theoretical value (6.36 /).The sintered samples with a 20 diameter were cut into several pieces for physical measurements using a spark erosion cutter. Rectangular bars with 12x3x3 and disks with 12.7 diameter were used for electrical transport measurements and thermal diffusivity measurements, respectively. Electrical conductivities () and Seebeck coefficients were measured simultaneously by dc four-terminal method using a Linseis Seebeck Coefficient/Electric Resistance Measuring System (LSR-3) under a low-pressure helium atmosphere from room temperature to 760 K. Thermal diffusivities () and specific heats () were obtained using a laser flash apparatus (NETZSCH LFA 457). The samples were coated with a thin layer of graphite to minimize errors from the emissivity of the material. The thermal conductivity () was calculated from the relationship: =, where is the mass density.
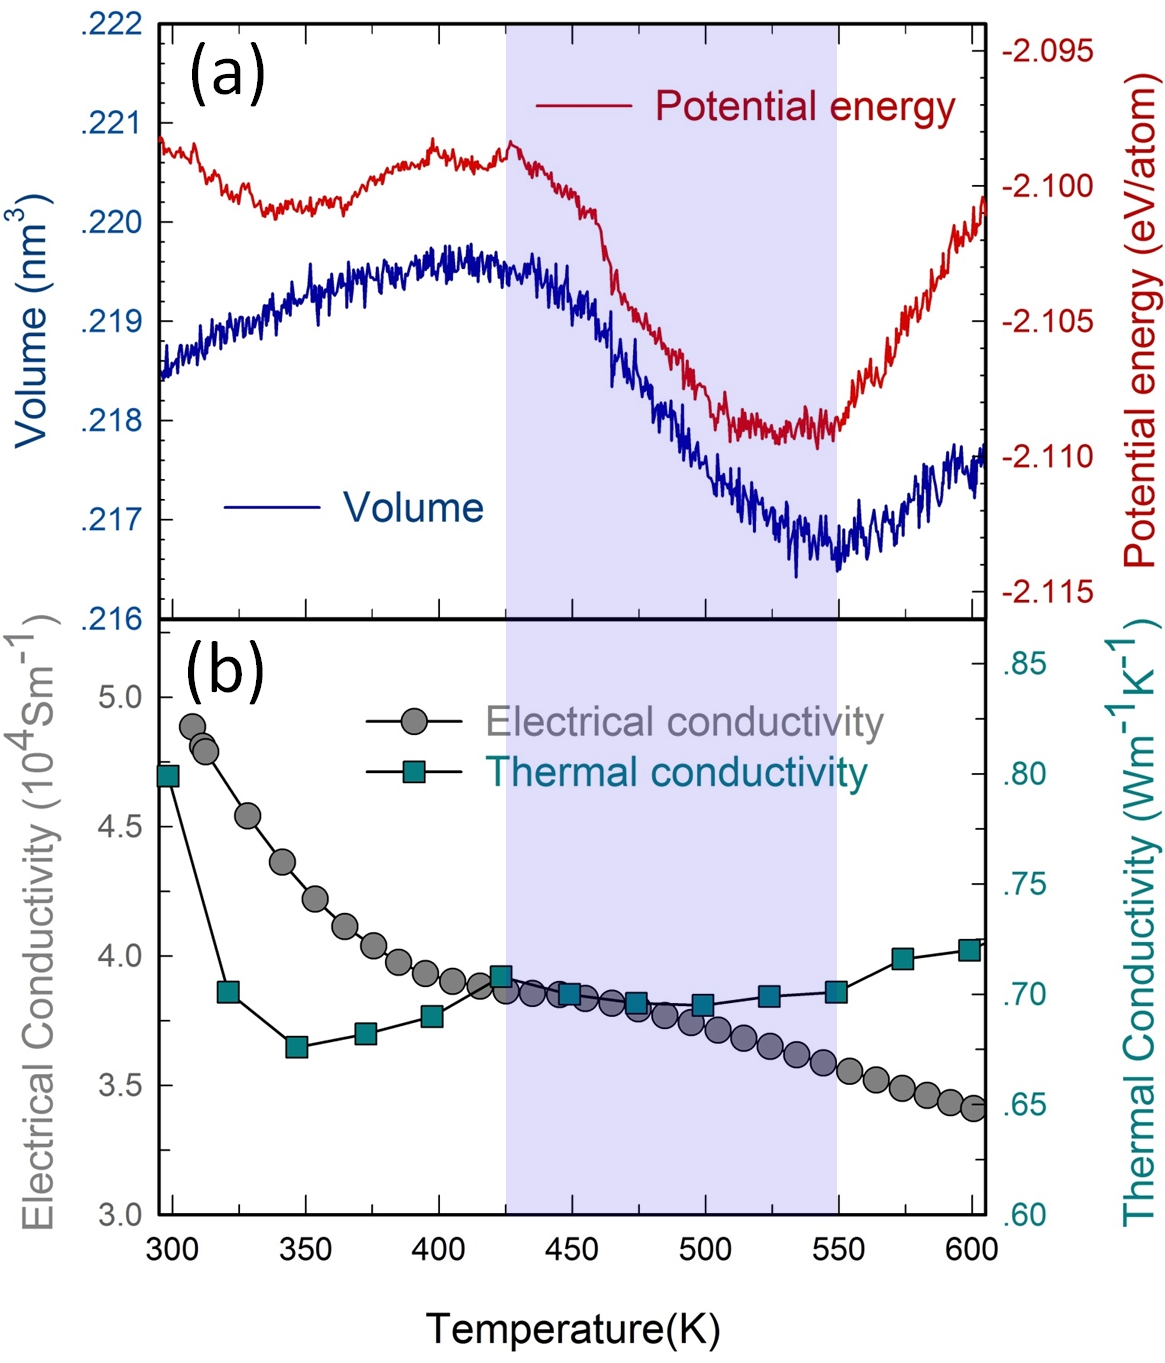
In our simulation results, we obtained the crystal lattice volume and the potential energy at increasing temperature. In Fig.1, we can see a volume decrease when the temperature reaches about 425K, accompanied with changes in the temperature dependence of the experimentally measured electrical and thermal conductivities. In our previous studies, we found that this volume change is triggered by a diffusion-like behavior of interstitial Zn atoms, this produces remarkable phonon anharmonicity responsible for the \ceZn4Sb3 low thermal conductivity.Li et al. (2013) Here we instead focus our attention on a different aspect, including a structural transition after this avalanche of atomic migration. The energy curve in Fig.1(a) reveals the nature of this process, in which a group of loosely bonded atoms adapts to a different crystallographic structure in their search for a more energetically favorable arrangement. In particular, we can see that a structural transition takes place at about 550K where the relaxation process seems to be accomplished, the volume and the energy again start to increase with increasing temperature.
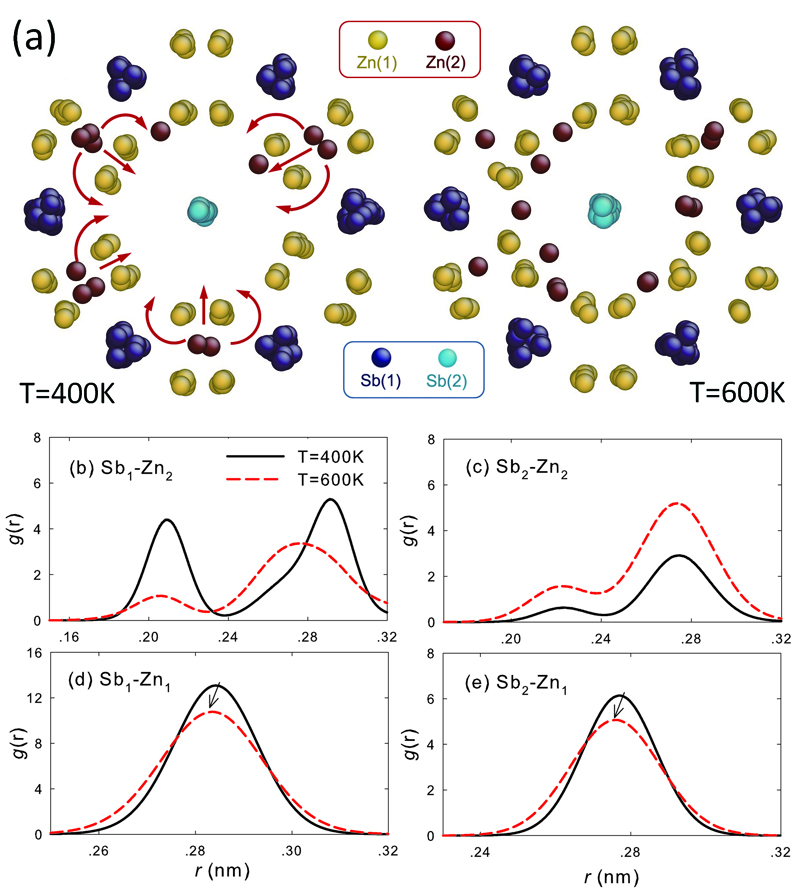
In order to obtain more information about this transition occurring around 550K, we have performed detailed analyses on the simulated atomistic trajectories. Fig.2(a) shows two atomistic configurations of the simulated \ceZn4Sb3 before (left panel) and after (right panel) the structure transition. Interstitial Zn atoms (Zn2) are found to migrate to inner sites, while Zn atoms at crystalline sites (Zn1) seem to stay in their positions. Furthermore, we have calculated the radial distribution functions of different pair correlations, through which the local relaxed structure associated with each atom is monitored. By comparing the case at 400K with that at 600K, we can see that of Zn2-Sb1 pairs becomes lower and broader at increasing temperature [Fig.2(b)], while that of Zn2-Sb2 pairs exhibits an inverse trend [Fig.2(c)]. It is therefore double-confirmed that Zn2 atoms migrate from outer to inner sites and become closer to Sb2 atoms. Regarding the main crystal lattice framework composed of Sb1, Sb2 and Zn1 atoms, which are , and occupied in our system, respectively, we can see that of Sb1-Zn1 and Sb2-Zn1 pairs [Fig.2(d,e)] are both broadened by increasing temperature after the structural transition, with peaks shifted to the left side. This shift indicates a change of interatomic distance in the main lattice, corresponding to the volume decrease during his structural transition.
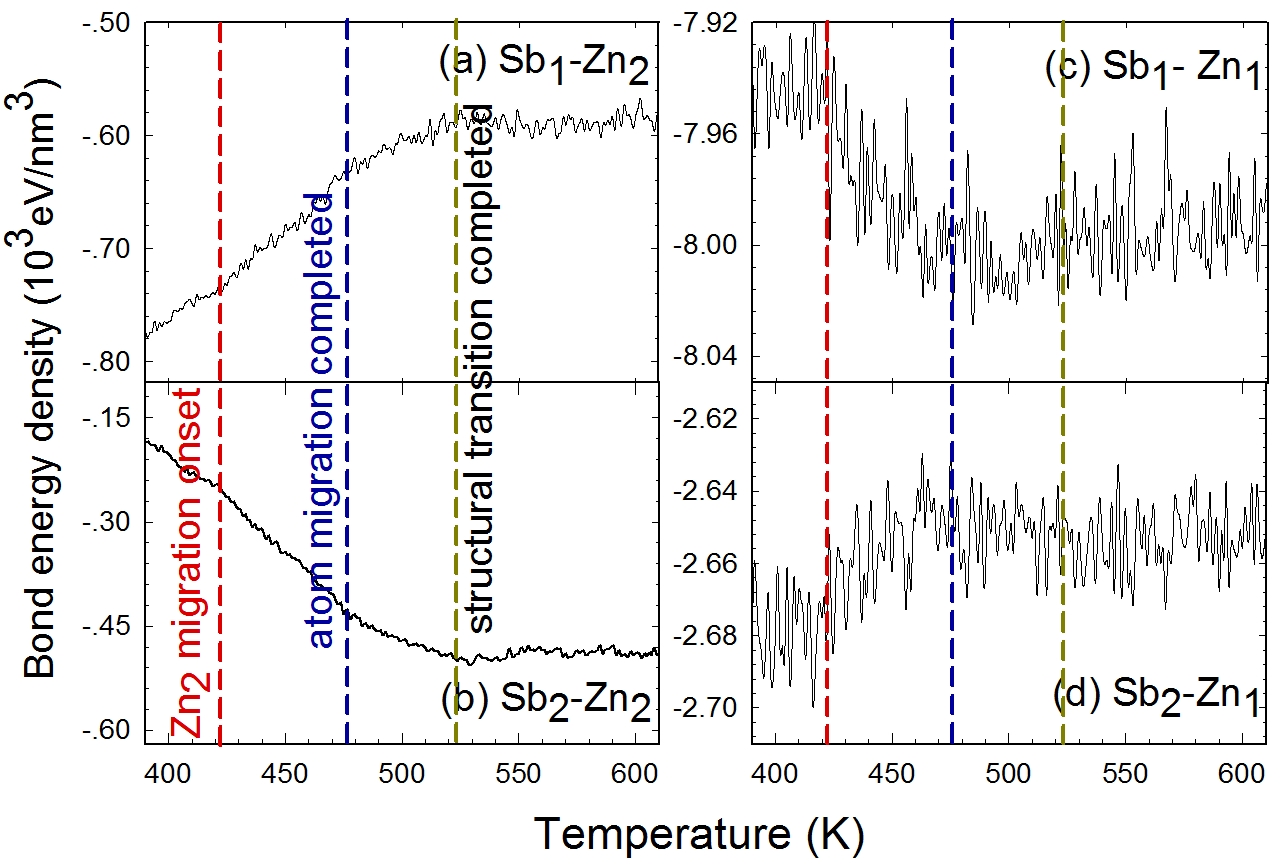
To confirm the above-described atomistic-scale details, we plot the pair potential energy between different atom sets in Fig.3. It can be seen that the bonds between Zn2 and Sb1 atoms is weakened at increasing temperature, while those between Zn2 and Sb2 atoms get greatly enhanced. These are consistent with the observations commented with Fig.2. The bond energy value of Sb1-Zn1 pair decreases while Sb2-Zn1 pairs increases at increasing temperature, these are also in good agreement with the above-discussed radial distribution function data.
In conclusion, we have investigated the atomistic origin of the structural stability change of \ceZn4Sb3, which is strongly correlated with its electrical and thermal transport coefficients. Our simulation results showed that the evolution of the crystallographic stability of \ceZn4Sb3 proceeds through four steps. Firstly, thermal energy fuels a long-range relaxation process, in which a fraction of Zn2 atoms start to migrate between interstitial sites at about 420K [Fig.3(a,b)]. Secondly, the thermally-activated atom migration gradually leads to a stabilizing structural transition of the main crystal framework composed of Zn1 and Sb [Fig.3(c,d)]which are and occupied, respectively, this process seems to be accomplished at about 480K. Thirdly, the migrated Zn atoms exhibit also a local relaxation process in which they search for a more energetically favorable configuration [Fig.3(a,b)]. Finally, the above-discussed processes result in a more stable crystal structure of \ceZn4Sb3 at high temperature, the system recovers it structural stability at about 520K[Fig.3(a-d)]. This microscopic mechanism explains the physical reason why the thermoelectric performance of zinc antimony is sensible to slight variation in Zn composition. This is consistent with experimental observationsPedersen et al. (2011) and is applicable to super-ionic frameworks in large lattice (e.g. Sb frames) with relatively small-radius interstitials with high diffusion mobility.
We thank Dr. J. Carrete at CEA grenoble and Prof. J. Li at MIT for helpful discussions. This work is supported by a grant-in-aid of 985 Project from Xi‘an Jiaotong University, the National Natural Science Foundation of China (Grant No. 11204228), the National Basic Research Program of China (2012CB619402 and 2014CB644003) and the Fundamental Research Funds for the Central Universities.
References
- Bell (2008) L. E. Bell, Science 321, 1457 (2008).
- Vineis et al. (2010) C. J. Vineis, A. Shakouri, A. Majumdar, and M. G. Kanatzidis, Adv. Mater. 22, 3970 (2010).
- Pei et al. (2012) Y. Pei, H. Wang, and G. J. Snyder, Adv. Mater. 24, 6125 (2012).
- Zebarjadi et al. (2012) M. Zebarjadi, K. Esfarjani, M. S. Dresselhaus, Z. F. Ren, and G. Chen, Energ. Environ. Sci. 5, 5147 (2012).
- Li et al. (2010) J.-F. Li, W.-S. Liu, L.-D. Zhao, and M. Zhou, NPG Asia. Mater. 2, 152 (2010).
- Snyder and Toberer (2008) G. J. Snyder and E. S. Toberer, Nat. Mater. 7, 105 (2008).
- Biswas et al. (2012) K. Biswas, J. He, I. D. Blum, Chun-Iwu, T. P. Hogan, D. N. Seidman, V. P. Dravid, and M. G. Kanatzidis, Nature 490 (2012).
- Singh (2010) D. J. Singh, Phys. Rev. B 81, 195217 (2010).
- Snyder et al. (2004) G. J. Snyder, M. Christensen, E. Nishibori, T. Caillat, and B. B. Iversen, Nat. Mater. 3, 458 (2004).
- Wang et al. (2013) H. Wang, A. D. LaLonde, Y. Pei, and G. J. Snyder, Adv. Funct. Mater. 23, 1586 (2013).
- Xu et al. (2010) J. Xu, J. Tang, K. Sato, Y. Tanabe, H. Miyasaka, M. Yamashita, S. Heguri, and K. Tanigaki, Phys. Rev. B 82, 085206 (2010).
- Yin et al. (2011) H. Yin, B. L. Pedersen, and B. B. Iversen, Eur. J. Inorg. Chem. 2011, 2733 (2011).
- Caillat et al. (1997) T. Caillat, J. P. Fleurial, and A. Borshchevsky, J. Phys. Chem. Solids 58, 1119 (1997).
- Nylen et al. (2004) J. Nylen, M. Andersson, S. Lidin, and U. Haussermann, J. Am. Chem. Soc. 126, 16306 (2004).
- Toberer et al. (2010) E. S. Toberer, P. Rauwel, S. Gariel, J. Tafto, and G. J. Snyder, J. Mater. Chem. 20, 9877 (2010).
- Lin et al. (2014) J. Lin, X. Li, G. Qiao, Z. Wang, J. Carrete, Y. Ren, L. Ma, Y. Fei, B. Yang, L. Lei, and J. Li, J. Am. Chem. Soc. 136, 1497 (2014).
- Li et al. (2013) X. Li, J. Carrete, J. Lin, G. Qiao, and Z. Wang, Appl. Phys. Lett. 103, 103902 (2013).
- Izard et al. (2002) V. Izard, M. C. Record, and J. C. Tedenac, J. Alloys Compd. 345, PII S0925 (2002).
- Toberer et al. (2007) E. S. Toberer, K. A. Sasaki, C. R. I. Chisholm, S. M. Haile, I. Goddard, W. A., and G. J. Snyder, Phys. Status Solidi. 1, 253 (2007).
- Rauwel et al. (2011) P. Rauwel, O. M. Lovvik, E. Rauwel, E. S. Toberer, G. J. Snyder, and J. Tafto, Phys. Status Solidi. 208, 1652 (2011).
- Plimpton (1995) S. Plimpton, J. Comput. Phys. 117, 1 (1995).
- Li et al. (2011) G. Li, Y. Li, X. Yang, Y. Tong, A. Zhou, L. Liu, and P. Zhai, J. Electron. Mater. 40, 1158 (2011).
- Pedersen et al. (2011) B. L. Pedersen, H. Yin, H. Birkedal, M. Nygren, B. B. Iversen, Chem. Mater. 22, 2375 (2010).