Socio-economic inequality and prospects of institutional Econophysics
Abstract
Socio-economic inequality is measured using various indices. The Gini () index, giving the overall inequality is the most commonly used, while the recently introduced Kolkata () index gives a measure of fraction of population who possess top fraction of wealth in the society. This article reviews the character of such inequalities, as seen from a variety of data sources, the apparent relationship between the two indices, and what toy models tell us. These socio-economic inequalities are also investigated in the context of man-made social conflicts or wars, as well as in natural disasters. Finally, we forward a proposal for an international institution with sufficient fund for visitors, where natural and social scientists from various institutions of the world can come to discuss, debate and formulate further developments.
I Introduction: Socio-economic inequality
The complex dynamics of human social interactions lead to interesting phenomena, and inequalities at various levels often show up in course. The recent availability of huge amount of data (empirical data from databases, electronic footprints, and sometimes large surveys) for various forms of human social interactions has made it easier to uncover certain patterns present, to analyze them and investigate the reasons behind various socio-economic inequalities manifested in them. The age of Big data has opened up new avenues and challenges, and scientists are in the quest to understand why certain things look like as they do and how do they happen. Researchers are pooling in knowledge and techniques from various disciplines lazer09 , e.g., statistics, applied mathematics, information theory, computer science, while tools of statistical physics have proved to be quite successful in better understanding of the precise (spatio-temporal) nature and origin of socio-economic inequalities prevalent in our society. More the data that is acquired and analyzed, more we become confident in addressing the whys, and hows.
Statistical physics tells us that systems of a large number of interacting dynamical units collectively exhibit a behavior which is solely determined by only a few basic dynamical properties of the individual constituent units and of the embedding dimension, but is independent of all other details. This feature, which is specific to ‘critical phenomena’, as in continuous phase transitions, is known as universality stanley1971introduction . There is no shortage of empirical evidence that several social phenomena are characterized by simple emergent behavior out of the interactions of many individual constituent units. In recent times, a growing community of researchers have been analyzing large-scale social dynamics to uncover universal patterns and proposing simple microscopic models to describe them, very similar to the minimalistic models used in statistical physics to understand physical phenomena. These studies have revealed quite a few interesting patterns and behaviors in social systems, as in elections fortunato2007scaling ; chatterjee2013universality ; mantovani2011scaling , population growth rozenfeld2008laws and economic growth stanley1996scaling , income and wealth distributions chakrabarti2013econophysics , financial markets mantegna2000introduction , languages petersen2012statistical , etc. (see Refs. Castellano:2009 ; Sen:2013 for a review).
Socio-economic inequality arrow2000meritocracy ; stiglitz2012price ; neckerman2004social ; goldthorpe2010analysing ; chatterjee2015sociorev usually concerns the existence of unequal ‘wealth’ and ‘fortunes’ accumulated due to complex dynamics and interactions within the society. Usually containing structured and recurrent patterns of unequal distributions of goods, wealth, opportunities, and even rewards and punishments, this is classically measured in terms of inequality of conditions, and inequality of opportunities. The former refers to the unequal distribution of income, wealth, assets and material goods. while the latter refers to the unequal distribution of ‘life chances’. This is reflected in levels of education, health status, treatment done by the criminal justice system etc. Socio-economic inequalities are mostly responsible for conflicts, wars, crises, oppressions, criminal activities, instability in political scenario and socio-political unrest, and that in turn affects economic growth hurst1995social . Historically as well as traditionally, economic inequalities have been extensively studied in the context of income and wealth yakovenko2009colloquium ; chakrabarti2013econophysics ; aoyama2010econophysics , although it is also measured for many quantities like energy consumption lawrence2013global . The studies of inequality in society piketty2014inequality ; Cho23052014 ; Chin23052014 ; Xie23052014 has been always very important, and is also a topic of contemporary focus and immediate global interest, drawing attention of researchers across disciplines – economics, sociology, mathematics, statistics, demography, geography, graph theory, computer science, and not surprisingly, theoretical physics.
Quantifying socio-economic inequalities is a challenge, but is done in numerous ways. The probability distributions of various quantities, of course provide the most detailed measures. It is very common to find that most quantities display broad distributions – most common are log-normals, power-laws or their combinations. For example, the distribution of income is usually found to be exponential for the bulk followed by a power law druagulescu2001exponential ; chakrabarti2013econophysics for the top income range. However, such distributions can widely differ in their forms and details, and as such they are rather difficult to handle. This leads to the introduction of various indices like the Gini gini1921measurement , Theil theil1967economics , Pietra eliazar2010measuring and other socio-geometric indices eliazar2015asociogeometry ; eliazar2015bsociogeometry , which try to characterize various geometric features of these distributions using a single number. Of course, each of these indices come with certain merits, and certain indices are more useful than others, depending on the context they are used in. In this article we will focus on the most common one, the Gini index and a recently proposed index ( Kolkata) which has a nice, useful socio-geometric interpretation.
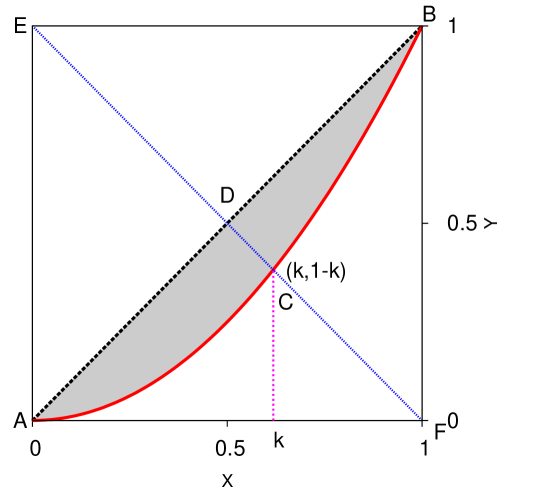
The most commonly used measure to quantify socio-economic inequality is the Gini index. To compute this, one has to consider the ‘Lorenz curve’ Lorenz , which shows the cumulative proportion of (poor to rich) ordered individuals (entries) in terms of the cumulative share of their wealth. can of course represent income or assets of individuals but it can as well represent citation of articles, votes in favor of candidates, population of cities etc. It is first computed from a given statistical distribution or a dataset. The Gini index (), defined as the ratio of the area enclosed between the Lorenz curve and the equality line, to that below the equality line, taking values for absolute equality and for absolute inequality. Let the area between (i) the Lorenz curve and the equality line be represented as , and (ii) that below the Lorenz curve be (See Fig. 1). Then the Gini index is . The recently introduced Kolkata index (symbolizing the extreme nature of social inequalities in Kolkata) or ‘-index’ ghosh2014inequality , is defined as the fraction such that fraction of people (or papers) possess fraction of highest incomes (or citations) inoue2015measuring ; chatterjee2016universality ; ghosh2016inequality .
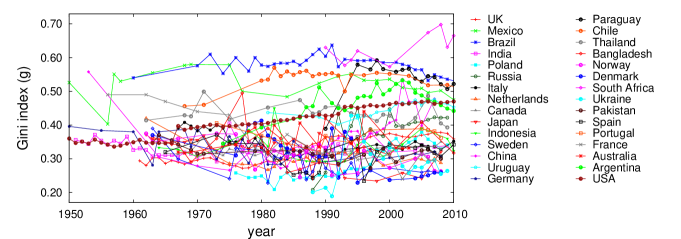
The empirical data on Gini index from World Bank data worldbank for incomes over several years are given in FIg. 2. The values seem to be mostly between and . In the later part of our article we will argue that the simple kinetic exchange models can even reproduce this feature.
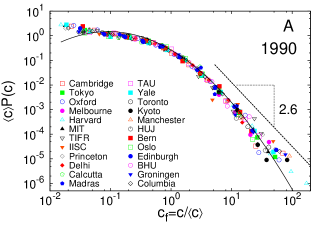
We also discuss here the specific case of the citation distributions. It was shown earlier Radicchi:2008 that the distribution of citations to papers within a discipline has a broad distribution, which is universal across broad scientific disciplines, by defining a relative indicator , where is the average citation within a discipline. Our study chatterjee2016universality confirmed this case for academic institutions as well as journals across disciplines.
Studies on the statistics of human deaths from wars, conflicts and natural disasters shows that the form of the probability distribution for number of people killed exhibit power law decay for the largest sizes, the exponent values being quite similar. We argue if a common mechanism is responsible for similarity that is manifested.
II Introduction: Institutional econophysics and sociophysics
In view of the truly interdisciplinary nature of econophysics and sociophysics, it can be argued that some interdisciplinary visiting facilities for social and natural scientists are absolutely necessary today. These will provide scientists from different disciplines to interact over some long period, discuss and debate and develop in their own discipline. In the concluding part of this article, we argue about the need to establish a research institute dedicated to socio-economic problems with an interdisciplinary character, with some specific model in mind.
III Inequality in citations for academic institutions and journals
In a recent study chatterjee2016universality , we were able to conclude that the citation distributions for articles published in different journals (Fig. 3)B, as well as from different academic institutions (Fig. 3)A followed the same functional form, irrespective of time (the year they are published) and space (institution). One has to carefully scale the probability distributions by their average, and the rescaled curves show excellent scaling collapse. The most of the resulting scaling curve fits to a lognormal function
| (1) |
while the extreme right tail deviates from this and seem to fit more to a power law with a decay exponent around .

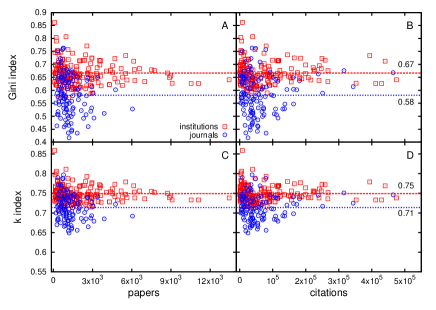
We additionally observed that for the academic institutions, Gini index was and , which means around citations come from the top papers. For academic journals, , which means about citations come from the top papers.
We further noted that Gini and indices fluctuate less around respective mean values and as the number of articles or the number of citations became large (Fig. 4). For academic institutions, the values were for Gini and . For journals, the values are and .
IV Empirical findings on relationship
The huge variety of socio-economic data suggest that there might be a simple relation between the two seemingly different inequality measures chatterjee2017socieconomic . Analysis of the following were carried out: (i) citations of papers published from academic institutions and journals (data from ISI Web of Science ISI and reported in Ref. chatterjee2016universality ), (ii) consumption expenditure data of India NSSO , Brazil Brazil0203 ; Brazil0809 , Italy Italydata , income data from USA IRS , (iii) voting data from open list proportional elections chatterjee2013universality of Italy, Netherlands and Sweden, first past the post election data for Indian Parliamentary elections and Legislative Assembly elections ECI , United Kingdom UKElec , Canada CAElec , Bangladesh BDElec , Tanzania TZElec , and (iv) city population data from Ref. ghosh2014zipf .
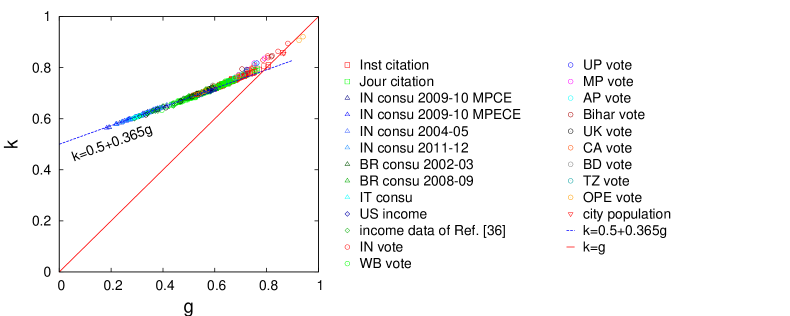
The relation seems to be perfectly linear for smaller values while it becomes non-linear at the limit of extreme inequality, i.e., as or approaches unity (Fig. 5). The most striking feature is that the data from a variety of these sources hardly depart from a seemingly smooth curve.
There has been a attempt to explain the slope of the curve for small values. by approximating the Lorenz curve as an arc of a circle chatterjee2017socieconomic . This linear relationship (with the value of the slope ) can be argued to be more generally valid. If the Lorenz curve in Fig. 1 is taken as a parabola (, as in case of normalized uniform distribution of income/wealth ; ), one gets and , giving , the values of and satisfy the above relationship very well.
V Estimates of relation from kinetic exchange models
The market models developed by physicists, specifically the kinetic exchange models Chatterjee2007 ; chakrabarti2013econophysics can provide an estimate of the relation between the inequality indices. In the CC model Chatterjee2007 , where an agent retains a (same for all) fraction of their income or wealth before going for any (stochastic) exchange (call it trade or scattering) with another agent, the dynamics is defined by
where is a random fraction in , drawn at each time step (trade or exchange). and are the wealth of the th agent at trading times and respectively. The steady state distribution of wealth is argued to be Gamma distribution Patriarca2004 ; Chatterjee2007 with the peak position shifting to higher income or wealth as increases ( corresponds to Gibbs or exponential distribution and approaches -function). The relationship for such distributions is found to be linear (Fig. 6a), obeying with .
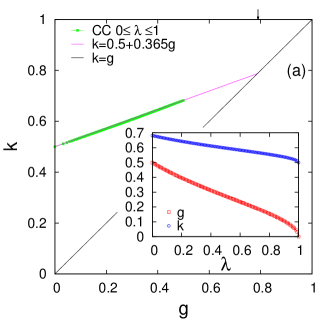

In the CCM model chakrabarti2013econophysics ; Chatterjee2007 , each agent has a saving fraction drawn from a (quenched) distribution . Following similar stochastic dynamics as in CC model,
one gets a steady state distribution of income or wealth with power law tails for large Chatterjee2007 . and computed for such distributions ghosh2016inequality are given in inset of Fig. 6b for varying range of . The relationship here is found to be nonlinear (see Fig. 6b) but very much around a similar linear relationship.
VI Universality in the statistics of deaths in conflicts and disasters
The history of human civilization has been frequently shaped by events of wars, conflicts and disasters. In recent times, the scale of disaster events have increased remarkably. Growing population around the world has been seen as one of the reasons for the increase in counts of people affected by disaster events. A study on the statistics of human deaths from wars, conflicts as well as natural disasters shows that the probability distribution of number of people killed in natural disasters as well as man made situations exhibit similar universality in statistics with power law decay for the largest sizes, the exponent values being quite similar chatterjee2016fat , in the range of . Comparing with natural disasters, where event sizes are measured in terms of physical quantities, like the energy released in earthquake, the volume of rainfall, the land area affected in forest fires, etc. also show striking similarities. These universal patterns in their statistics might suggest some subtle similarities in their mechanisms and dynamics.

VII Discussions on citations and relationship between inequality measures in general
The Gini index is the most popular among economists and sociologists, since it gives an overall measure of the inequality in a society. As evident from Fig 1, it requires accurate data for the entire Lorenz curve to provide a measure of the shaded area enclosed by it and the equality line. The Kolkata index being given by the intersection of the Lorenz curve and the cross diagonal to the equality line. The linear relationship is extremely robust for not so high values of inequality and fits different forms of Lorenz curve and hence, distributions of income, wealth, citations, etc. and this robustness is also observed empirically (Fig. 5). We could even compare these findings with simple kinetic exchange models of wealth distributions, where the scaling relation between and was found to be also true. The relationship would be extremely useful to translate from one inequality measure to the other; since fraction of people possess precisely fraction of the total wealth, translation of social inequality measures into -index language can be of major significance.
One of our recent focus had been the inequality in citations for academic institutions and journals. Although institutions and journals have their own ranking depending on the ‘quality’ of research and publications that come out, get noticed and cited, we find that the form of the distribution function for citations is invariant with respect to the average citations, holding across institutions and over time as well. In terms of absolute inequality measures, roughly 75% citations come from the top 25% papers in case of academic institutions and 71% citations come from the top 29% papers for journals.
We also discussed how the inequality statistics of deaths in social conflicts or wars compare with those in natural disasters.
VIII Concluding remarks: Some random thoughts about prospects of institutional econophysics
Twenty years have passed since the formal coining of the term and hence the launch of econophysics as a research topic (since 1995; see the entry by Barkley Rosser on Econophysics in The New Palgrave Dictionary of Economics Barkleyroseerency2008 ). Furthermore, econophysics has been assigned the Physics and Astronomy Classification Scheme (PACS) number 89.65Gh by the American Institute of Physics. However, regular interactions and collaborations between the communities of natural scientists and social scientists are rare. Though interdisciplinary research papers on econophysics and sociophysics are regularly being published at a steady and healthy rate (more than 1000 documents containing the explicit term “econophysics” and more than 240 documents containing the explicit term “sociophysics” in the years 2014 and 2015 according to Google Scholar) and published mostly in physics journals, and a number of universities (including Universities of Leiden, Bern, Paris and London) are offering the interdisciplinary courses on econophysics and sociophysics, not many clearly designated professor or other faculty positions for that matter are available yet (except for econophysics in Universities of Leiden and London). Neither there are any designated institutions on these interdisciplinary fields, nor separate departments or centres of studies for instance. We note however, happily in passing, a recently published highly acclaimed (“landmark” and “masterful”) economics book Shubik2016guidance by Martin Shubik (Seymour Knox Professor of Mathematical Institutional Economics, Emeritus, at Yale University) and Eric Smith (Santa Fe Institute) discusses extensively on econophysics approaches and in general on the potential of interdisciplinary researches inspired by the developments in natural sciences.
In view of these, it seems it is time to try for an international centre for interdisciplinary studies on complexity in social and natural sciences; specifically on econophysics and sociophysics111Although the presentation in the conference (by BKC) was mainly on the materials discussed in the earlier sections, extensive discussions with several participants, including the conference organizers, had been on this point.. The model of the Abdus Salam International Centre for Theoretical Physics (ICTP), Trieste (funded by UNESCO and IAEA), could surely be helpful to guide us here. We are contemplating if an ICTP-type interdisciplinary research institute could be initiated for researches on econophysics and sociophysics.
We note that Helbing (ETH, Zurich) and colleagues have been trying for an European Union funded “Complex Techno-Socio-Economic Analysis Centre” or “Economic and Social Observatory” for the last five years (see Ref. helbing2011white containing the White Papers arguing for the proposed centre). We are also aware that Indian Statistical Institute had taken a decision to initiate a similar centre in India (see the “Concluding Remarks” in ghosh2013econophysics ). Also there was an attempt for a similar Asian Centre in Singapore, initiated in Nyangyong Technological University. In view of some recent enthusiasms at the Japan-India Heads of States or Prime Minister level, and signing of various agreements (predominantly for business deals, infrastructure development, technical science and also cultural exchanges) by them, possibility of an Indo-Japan Center for studies on Complex Systems is also being explored. In such bilateral (Indo-Japan) initiatives, there are explicit Memorandum of Understandings already signed by the Prime Ministers. It did not have any economic or sociological study centres ever planned under such bilateral efforts.
These proposals are for regular research centres on such interdisciplinary fields, where regular researchers will investigate such systems. However, in view of the extreme interdisciplinary nature of econophysics and sociophysics, such efforts may be complemented by another visiting centre model. Unlike the above-mentioned kind of centres therefore this proposed centre may be just a visiting centre where natural and social scientists from different universities and institutions of the world can meet for extended periods to discuss and interact on various interdisciplinary issues and collaborate for such researches, following the original ICTP model.
Here, as in ICTP, apart from a few (say, about ten to start-with) promising young researchers on econophysics and sociophysics as permanent faculty who will continue active research and active visiting scientist programmes (in physics, economics and sociology) etc. can be pursued, The faculty members, in consultation with the advisers from different countries, can choose the invited visitors and workshops or courses, on economics and sociological complexity issues, can be organized on a regular basis (as for basic theoretical sciences in ICTP or in Newton Centre, Cambridge, etc.).
We think, it is an appropriate time for the healthy growth of these “New or Evolving Economic & Sociological Thinkings” including econophysics and sociophysics. We believe, Tokyo would be the ideal location for such an International Centre. In such new studies on social sciences, econophysics and sociophysics in particular, Japan has already significantly large, active and established groups and hence, Tokyo could be its natural location.
Acknowledgment
We are extremely thankful to Yuji Aruka and Taisei Kaizoji for sharing with us many enthusiastic ideas on several collaboration projects. We are also grateful to Sudip Mukherjee for his help in preparing the manuscript.
References
- (1) D. Lazer, A. Pentland, L. Adamic, S. Aral, A.-L. Barabási, D. Brewer, N. Christakis, N. Contractor, J. Fowler, M. Gutmann, T. Jebara, G. King, M. Macy, D. Roy, and M. Van Alstyne. Computational social science. Science, 323(5915):721–723, 2009.
- (2) H. E. Stanley. Introduction to Phase Transitions and Critical Phenomena. Oxford Univ. Press, Oxford and New York, 1971.
- (3) S. Fortunato and C. Castellano. Scaling and universality in proportional elections. Phys. Rev. Lett., 99(13):138701, 2007.
- (4) A. Chatterjee, M. Mitrović, and S. Fortunato. Universality in voting behavior: an empirical analysis. Sci. Reports, 3:1049, 2013.
- (5) M. C. Mantovani, H. V. Ribeiro, M. V. Moro, S. Picoli Jr, and R. S. Mendes. Scaling laws and universality in the choice of election candidates. Europhys. Lett., 96(4):48001, 2011.
- (6) H. D. Rozenfeld, D. Rybski, J. S. Andrade, M. Batty, H. E. Stanley, and H. A. Makse. Laws of population growth. Proc. Natl. Acad. Sci., 105(48):18702–18707, 2008.
- (7) M. H. R. Stanley, L. A. N. Amaral, S. V. Buldyrev, S. Havlin, H. Leschhorn, P. Maass, M. A. Salinger, and H. E. Stanley. Scaling behaviour in the growth of companies. Nature, 379(6568):804–806, 1996.
- (8) B. K. Chakrabarti, A. Chakraborti, S. R. Chakravarty, and A. Chatterjee. Econophysics of income and wealth distributions. Cambridge Univ. Press, Cambridge, 2013.
- (9) R. N. Mantegna and H. E. Stanley. Introduction to Econophysics: Correlations and Complexity in Finance. Cambridge Univ. Press, Cambridge, 2000.
- (10) A. M. Petersen, J. Tenenbaum, S. Havlin, and H. E. Stanley. Statistical laws governing fluctuations in word use from word birth to word death. Sci. Reports, 2:313, 2012.
- (11) C. Castellano, S. Fortunato, and V. Loreto. Statistical physics of social dynamics. Rev. Mod. Phys., 81:591–646, May 2009.
- (12) P. Sen and B. K. Chakrabarti. Sociophysics: An Introduction. Oxford University Press, Oxford, 2013.
- (13) K. J. Arrow, S. Bowles, and S. N. Durlauf. Meritocracy and economic inequality. Princeton Univ. Press, 2000.
- (14) J. E. Stiglitz. The price of inequality: How today’s divided society endangers our future. WW Norton & Company, 2012.
- (15) K. Neckerman. Social Inequality. Russell Sage Foundation, 2004.
- (16) J. H. Goldthorpe. Analysing social inequality: a critique of two recent contributions from economics and epidemiology. Eur. Sociological Rev., 26(6):731–744, 2010.
- (17) A. Chatterjee. Socio-economic inequalities: a statistical physics perspective. In Econophysics and Data Driven Modelling of Market Dynamics, Eds. F Abergel, H. Aoyama, B.K. Chakrabarti, A. Chakraborti, A. Ghosh,, pages 287–324. New Economic Windows, Springer, 2015.
- (18) C. E. Hurst. Social Inequality: Forms, Causes, and Consequences. Allyn and Bacon, Boston, 1995.
- (19) V. M. Yakovenko and J. Barkley Rosser Jr. Statistical mechanics of money, wealth, and income. Rev. Mod. Phys., 81(4):1703, 2009.
- (20) H. Aoyama, Y. Fujiwara, and Y. Ikeda. Econophysics and companies: statistical life and death in complex business networks. Cambridge Univ. Press, Cambridge, 2010.
- (21) S. Lawrence, Q. Liu, and V. M. Yakovenko. Global inequality in energy consumption from 1980 to 2010. Entropy, 15(12):5565–5579, 2013.
- (22) T. Piketty and E. Saez. Inequality in the long run. Science, 344(6186):838–843, 2014.
- (23) A. Cho. Physicists say it’s simple. Science, 344(6186):828, 2014.
- (24) G. Chin and E. Culotta. What the numbers tell us. Science, 344(6186):818–821, 2014.
- (25) Y. Xie. Undemocracy: Inequalities in science. Science, 344(6186):809–810, 2014.
- (26) A. A. Drăgulescu and V. M. Yakovenko. Exponential and power-law probability distributions of wealth and income in the united kingdom and the united states. Physica A, 299(1):213–221, 2001.
- (27) C. Gini. Measurement of inequality of incomes. Econ. J., 31(121):124–126, 1921.
- (28) H. Theil. Economics and information theory. North-Holland Amsterdam, 1967.
- (29) I. I. Eliazar and I. M. Sokolov. Measuring statistical heterogeneity: The pietra index. Physica A, 389(1):117–125, 2010.
- (30) I. Eliazar. The sociogeometry of inequality: Part i. Physica A, 426:93–115, 2015.
- (31) I. Eliazar. The sociogeometry of inequality: Part ii. Physica A, 426:116–137, 2015.
- (32) M. O. Lorenz. Methods for measuring the concentration of wealth. Am. Stat. Assoc., 9:209–219, 1905.
- (33) A. Ghosh, N. Chattopadhyay, and B. K. Chakrabarti. Inequality in societies, academic institutions and science journals: Gini and k-indices. Physica A, 410(14):30–34, 2014.
- (34) J-I. Inoue, A. Ghosh, A. Chatterjee, and B. K. Chakrabarti. Measuring social inequality with quantitative methodology: analytical estimates and empirical data analysis by gini and indices. Physica A, 429:184–204, 2015.
- (35) A. Chatterjee, A. Ghosh, and B. K. Chakrabarti. Universality of citation distributions for academic institutions and journals. PloS one, 11(1):e0146762, 2016.
- (36) A. Ghosh, A. Chatterjee, J.-I. Inoue, and B. K. Chakrabarti. Inequality measures in kinetic exchange models of wealth distributions. Physica A, 451:465–474, 2016.
- (37) World Bank, All the Ginis Dataset, retrieved June, 2014. http://siteresources.worldbank.org/INTRES/Resources/469232-1107449512766/allginis_2013.xls.
- (38) F. Radicchi, S. Fortunato, and C. Castellano. Universality of citation distributions: Toward an objective measure of scientific impact. Proc. Nat. Acad. Sci., 105(45):17268–17272, 2008.
- (39) A. Chatterjee, A. Ghosh, and B. K. Chakrabarti. Socio-economic inequality: Relationship between gini and kolkata indices. Physica A, 466:583–595, 2017.
- (40) ISI Web of Science, retreived April, 2014. http://portal.isiknowledge.com.
- (41) NSSO. Household Consumer Expenditure from the National Sample Survey Office (NSSO). http://mail.mospi.gov.in/index.php/catalog/CEXP.
- (42) IBGE. Instituto Brasileiro de Geografia e Estatística - Pesquisa de Orçamentos Familiares (Consumer Expenditure Survey) 2002-2003. http://www.ibge.gov.br/home/estatistica/populacao/condicaodevida/pof/2002aquisic ao/microdados.shtm, 2002-03. Accessed: September, 2015.
- (43) IBGE. Instituto Brasileiro de Geografia e Estatística - Pesquisa de Orçamentos Familiares (Consumer Expenditure Survey) 2008-2009. http://www.ibge.gov.br/english/estatistica/populacao/condicaodevida/pof/2008_2009_perfil_despesas/microdados.shtm, 2008-09. Accessed: September, 2015.
- (44) Banca d’Italia. Distribuzione dei microdati (Distribution of microdata). http://www.bancaditalia.it/statistiche/tematiche/indagini-famiglie-imprese/bilan ci-famiglie/distribuzione-microdati/index.html, 2015. Accessed: September, 2015.
- (45) Internal Revenue Service (IRS) – Individual Tax Tables, retreived June, 2014. http://www.irs.gov/uac/SOI-Tax-Stats—Individual-Statistical-Tables-by-Size-of-Adjusted-Gross-Income.
- (46) Election Commission of India. General Election Results and Statistics. www.eci.nic.in.
- (47) UK General Elections since 1832. http://www.politicsresources.net/area/uk/edates.htm.
- (48) Election Canada. http://www.elections.ca.
- (49) Bangladesh Election Commission. http://www.ec.org.bd.
- (50) National Election Commission Tanzania. http://www.nec.go.tz.
- (51) A. Ghosh, A. Chatterjee, A. S. Chakrabarti, and B. K. Chakrabarti. Zipf’s law in city size from a resource utilization model. Phys. Rev. E, 90(4):042815, 2014.
- (52) A. Chatterjee, A. S. Chakrabarti, A. Ghosh, A. Chakraborti, and T. K. Nandi. Invariant features of spatial inequality in consumption: the case of india. Physica A, 442:169–181, 2016.
- (53) A. S. Chakrabarti, A. Chatterjee, T. K. Nandi, A. Ghosh, and A. Chakraborti. Quantifying invariant features of within-group inequality in consumption across groups. arXiv:1601.02463, 2016.
- (54) A. Chatterjee and B. K. Chakrabarti. Kinetic exchange models for income and wealth distributions. Eur. Phys. J. B, 60(2):135–149, 2007.
- (55) M. Patriarca, A. Chakraborti, and K. Kaski. Statistical model with a standard distribution. Phys. Rev. E, 70(1):016104, 2004.
- (56) A. Chatterjee and B. K. Chakrabarti. Fat tailed distributions for deaths in conflcts and disasters. arxiv:1608.01886, 2016.
- (57) Peace Research Institute Oslo (PRIO): The Battle Deaths Dataset version 3.0; retreived July, 2016. https://www.prio.org/Data/Armed-Conflict/Battle-Deaths/The-Battle-Deaths-Dataset -version-30/.
- (58) The Correlates of War Project: COW War Data, 1816 - 2007 (v4.0); retreived July, 2016. http://www.correlatesofwar.org/data-sets/COW-war.
- (59) Wikipedia: List of battles and other violent events by death toll, Terror attacks; retreived July, 2016.
- (60) Uppsala Conflict Data Program (UCDP): Battle-Related Deaths Dataset v.5-2015, 1989-2014; retreived July, 2016. http://www.pcr.uu.se/research/ucdp/datasets/ucdp_battle-related_deaths_datase t/.
- (61) EM-DAT: The international Disaster Database; retreived July, 2014. http://www.emdat.be/database.
- (62) J Barkley Rosser Jr. Economics and economic complexity. In S. N. Durlauf and L. E. Blume, editors, The New Palgrave Dictionary of Economics, volume 2, pages 729–732. 2008.
- (63) M. Shubik and E. Smith. The Guidance of an Enterprise Economy. MIT Press, Cambridge, Massachusetts, 2016.
- (64) D. Helbing and S. Balietti. Complex techno-socio economics. Eur. Phys. J. Spl. Topics, 195:1–186, 2011.
- (65) A. Ghosh. Econophysics research in india in the last two decades. IIM Kozhikode Society & Management Review, 2(2):135–146, 2013.