Distance Dependent Offsets between Parallaxes for Nearby Stars and Gaia DR1 Parallaxes
Abstract
We use 612 single stars with previously published trigonometric parallaxes placing them within 25 pc to evaluate parallaxes released in Gaia’s first data release (DR1). We find that the Gaia parallaxes are, on average, mas smaller than the weighted mean trigonometric parallax values for these stars in the solar neighborhood. We also find that the offset changes with distance out to 100 pc, in the sense that the closer the star, the larger the offset. We find no systematic trends in the parallax offsets with stellar magnitude, color, or proper motion. We do find that the offset is roughly twice as large for stars south of the ecliptic compared to those that are north.
1 Introduction
The first wave of results from the Gaia astrometry mission was released on 2016 September 14, in what is known as the Gaia First Data Release (Brown et al. 2016, hereafter DR1). With this release, astrometry has entered a new era, where a few lines of SQL script yield millions of parallaxes, rather than tens of thousands from Hipparcos, or thousands from over a century of painstaking work from both the ground and space that produced parallaxes for individually-targeted stars. Because of the new rich dataset, the Gaia results will undoubtedly change the way astronomers investigate the stellar population of the Milky Way, and how they create samples of stars for in-depth studies. Because of the broad utility of the Gaia results, it is important to check that the new measurements are consistent with what came before. In this paper, we compare DR1 results to the fundamental sample of nearby stars, which motivated the pursuit of trigonometric parallaxes in the first place.
2 Matching Stars and Parallax Comparisons
To compare the new Gaia parallaxes to previously measured values, we first used the available DR1 search tools to extract stars with parallaxes placing them within 40 pc. The SQL script used was SELECT * FROM gaiadr1.tgas_source WHERE parallax 25. This query resulting 3402 stars within 25pc. We use this result to match 3806 systems within 25 pc collected by us in the past 10 years (Henry & Jao, 2015). This list contains all stars with published, accurate (uncertainty 10 mas), trigonometric parallaxes placing them within 25 pc as of January 1, 2015. This 25 pc horizon was previously defined by the Catalog of Nearby Stars (Gliese & Jahreiss, 1995) and has been widely used in nearby populations studies. Presumably single stars with no known stellar, brown dwarf, or planetary companions in this list were selected to reduce contamination of the dataset by stars with parallaxes suffering from astrometric perturbations. The search in DR1 was extended to 40 pc for cross-matching to ensure that stars beyond 25 pc in DR1 would be included. Stars with Hipparcos identifiers were matched first. If a star had no Hipparcos identifier, coordinate matching was used with a radius of 1′, after adjusting for proper motions between the DR1 epoch of 2015 and the epoch of 2000 of these nearby stars. The resulting list of 612111There are a total of 869 systems in this list with new DR1 parallaxes. stars and both sets of parallaxes used for the comparisons is given in Table Distance Dependent Offsets between Parallaxes for Nearby Stars and Gaia DR1 Parallaxes.
For the pre-Gaia measurements, if multiple trigonometric measurements were published for a given star, a weighted mean parallax value was calculated. Because parallaxes come from various sources, we make three comparisons here: (1) DR1 vs. weighted mean trigonometric parallaxes from all available sources, (2) DR1 vs. Hipparcos parallaxes (van Leeuwen, 2007), and (3) DR1 vs. YPC parallaxes from The General Catalogue of Trigonometric Parallaxes (van Altena et al., 1995), sometimes called the Yale Parallax Catalog, or simply YPC. The first two columns in Table Distance Dependent Offsets between Parallaxes for Nearby Stars and Gaia DR1 Parallaxes are coordinates in epoch and equinox 2000, followed by three columns of identifiers. Columns 6–8 list proper motions, position angles of the proper motions, and their references. The majority of proper motions are from the Tycho 2 catalog (Høg et al., 2000). A few are from Hipparcos or our SuperCOSMOS-RECONS survey (Hambly et al., 2001), the latter of which are presented here for the first time. Columns 9 and 10 are Johnson magnitudes and references. Note that some stars without Johnson have values converted from Tycho and 222Details of the conversions will be discussed in a future paper that outlines how we construct template stars to get these conversions; for converted values we list the reference as “this work”.. The 2MASS (99.99 indicates no value in 2MASS) and Gaia magnitudes are listed in columns 11 and 12. Columns 13–16 give weighted mean parallaxes, parallax errors, the number of parallaxes in the weighted means, and references. The DR1 parallaxes and errors are listed in the final two columns.
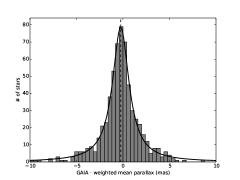
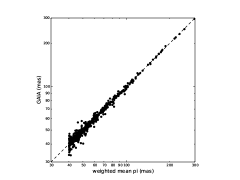
The Figure 1 shows binned results of the differences between the DR1 and the weighted mean parallaxes, in the sense . The Figure 1 compares the parallax values along a one-to-one correspondence line. This histogram shows that the distribution is not symmetric about zero, but centered around mas, indicating that the DR1 parallaxes are somewhat smaller than measured previously for nearby stars. Because of the unusually wide wings of the distribution, an unweighted Lorentz distribution was fit instead of a Gaussian distribution that represents random sampling. The offset indicates that the DR1 results place nearby stars systematically slightly further away than the current measurements. Our result is virtually identical to the systematic offset of 0.25 mas reported in Stassun & Torres (2016), who compared DR1 parallaxes to orbital parallaxes derived for 108 eclipsing binary systems. In contrast, a comparison of DR1 parallaxes to photometrically estimated parallaxes for 212 Galactic Cepheids (Casertano et al., 2016) does not show a systematic offset, instead finding that the DR1 parallaxes are in “remarkably” good agreement with the estimates from the period-luminosity relation (Riess et al., 2011). We note, however, that the result for Cepheids involves photometric parallax estimates, rather than trigonometric parallax measurements.
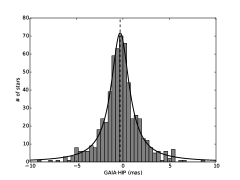
To probe possible sources of the offset, we also compared DR1 to Hipparcos and YPC results independently, as shown in Figure 1 and 1. In Figure 1, we see that the offset between DR1 and the revised Hipparcos results (van Leeuwen, 2007) for 600 stars common to both samples is mas, similar to, and in the same direction as the offset seen for the weighted mean parallaxes. Again, a Lorentz profile has been fit to the distribution. As shown in Figure 1, the much larger errors in the YPC parallaxes for 402 stars in common to both samples (offsets for 98 stars are beyond the edges of the panel) makes it difficult to reach any clear interpretation about offsets between DR1 and YPC parallaxes. Apparently, most of the differences seen between DR1 and weighted mean parallaxes are due to offsets between Gaia and Hipparcos results.
Lindegren et al. (2016) also discussed parallax differences between Hipparcos values and the DR1 in their Appendix C. They found that the median parallax difference () is 0.089 mas based on 86,928 sources, roughly one-third of the offset we have found. Although they did not outline the distance distribution of these 86,928 stars, analysis of their Figure B.1 for 87000 stars shows that the majority have parallaxes between 0 and 10 mas. Apparently, when the parallax comparison is done using stars beyond 100 pc, the discrepancy is very small.

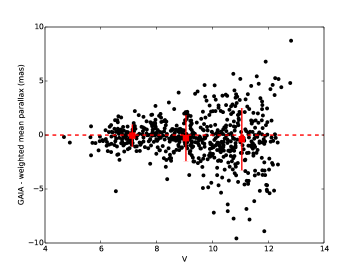
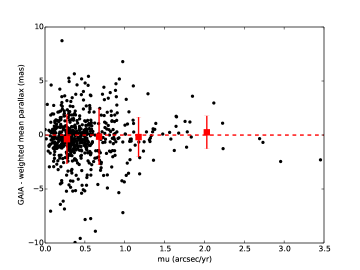
We also investigated the parallax differences in terms of magnitude, color, and proper motion to reveal whether or not any of these attributes may be linked to the systematics. Figure 2 shows no clear trends between the DR1/weighted mean parallax offset and any of these three parameters. The only evident correlations seen are expected — stars fainter in and redder in show larger offsets than brighter, bluer stars simply because their previously measured parallaxes have larger errors in general. In the DR1, the primary data set contains excess source noises for each source, and the excess noises represent the modelling errors (Lindegren et al., 2016). We found that the parallax difference is not a function of the excess noise. We also note the Lutz-Kelker bias has a negligible effect on this systematic offset reported here.

3 Systems Worthy of Note
Among the 612 stars used for our comparisons, there are two with parallax differences larger than 20%: GJ 723 and LTT 7370.
GJ 723 = HIP 91557 is a nearby M dwarf with parallaxes from YPC and Hipparcos. The weighted mean parallax is 46.125.81 mas, while the DR1 parallax is 56.4830.267 mas. The star has highly discrepant parallaxes with large errors in YPC and Hipparcos. The YPC parallax, 64.78.6 mas, is a weighted mean of three independently measured parallaxes that are in reasonably good agreement. The original Hipparcos parallax of 29.7013.06 mas (Perryman et al., 1997) was later revised to 30.497.89 mas in the van Leeuwen (2007) re-reduction. This shows the YPC parallax is consistent with the DR1 parallax.
GJ 723 lies in a very crowded background star field, and the large errors in the stochastic Hipparcos solutions may be due to close proximity of GJ 723 to two other bright stars, 2MASS J18401792-1027481 and 2MASS J18401833-1027596. GJ 723 has proper motions in R.A. and Decl. of (-130.4, -523.0), (-170.2, -525.2), (-167.69, -520.08) and (-143.6920, -557.0159) mas yr-1, respectively, from the New Luyten Two Tenths (NLTT) (Luyten & Hughes, 1980), Tycho-2 (Høg et al., 2000), Hipparcos (van Leeuwen, 2007), and DR1 catalogs. The photometric distance based on colors (Henry et al., 2004) puts the star at 21.46 pc, corresponding to a parallax of 46.59 mas that is larger than the Hipparcos value and smaller than the YPC and DR1 values. The distance to this star remains unclear.
LTT 7370 = HIP 91154 is a nearby K dwarf with a Hipparcos parallax of 46.461.44 mas (van Leeuwen, 2007). No other previously published parallax is available for this star, whereas the new DR1 parallax is 26.0830.762 mas. The proper motions in R.A. and Decl. from NLTT, Tycho-2, Hipparcos, and DR1 are (-27.2, -389.0), (-18.6, -424.1), (-20.71, -424.84), and (-22.3672, -424.9188) mas yr-1, respectively. The photometric distance based on colors (Henry et al., 2004) places the star at 22.85 pc, corresponding to a parallax of 43.7 mas, which is consistent with the Hipparcos value, but not DR1’s. This field is not crowded.
When checking coordinates from Hipparcos, 2MASS, WISE, and DR1, we found that these two stars move along their correct proper motion tracks, as generally supported by the agreement of the proper motion measurements given above. Thus, there is no evidence that DR1 has incorrect coordinates for these two stars.
4 Distance Dependent Offsets
The offset we describe above is a difference between DR1 and the weighted mean parallaxes of these 612 presumably single stars within 25 pc. We next investigated whether or not the offset depends on distance, i.e. the size of the measured parallax. We separated the 25 pc sample into two sets — stars with parallaxes between 40 and 80 mas and those with parallaxes larger than 80 mas — and performed the same histogram binning and Lorentz fitting routines for stars in these two sets. To reduce biases potentially caused by sample selection near the 40 mas cutoff, i.e. a subsample of stars beyond 25 pc in DR1 that were closer than 25 pc as measured previously, and vice versa, we created the new subsets two ways: Method 1 used the weighted mean parallaxes to define the parallax cutoff (612 stars) and Method 2 used DR1 (580 stars). Results for both methods are given in Table Distance Dependent Offsets between Parallaxes for Nearby Stars and Gaia DR1 Parallaxes, and show offsets of roughly the same size and in the same direction. Note that Method 1 was used to derive the mas offset value described above.
We then stretched the sample out to 100 pc to provide an extended view of possible systematic offsets. We used the following SQL script to extract 16,260 parallaxes for stars within 100 pc in both van Leeuwen (2007) and DR1: “SELECT parallax, parallax_error, pmra, pmdec, plx, e_plx, pm_ra, pm_de from gaiadr1.tgas_source, public.hipparcos_newreduction WHERE gaiadr1.tgas_source.hip = public.hipparcos_newreduction.hip AND parallax 10.” This is considered Method 3. Note that if stars are within 100 pc in van Leeuwen (2007) but not in DR1, they would not be extracted using this script. We then used parallaxes from DR1 to separate stars into different subsets corresponding to distance regimes of 25–50 pc and 50–100 pc, as presented in Table Distance Dependent Offsets between Parallaxes for Nearby Stars and Gaia DR1 Parallaxes. There is a clear trend of changing offset in parallax with distance. It is important to note that we do not know the multiplicity status of the 16,260 stars used in Method 3. Hence, many unresolved companions may cause small perturbations and skew some Gaia measurements in DR1. It may be that the offset is much larger in Method 3 because unsolved perturbations cause larger offsets in the DR1 parallaxes. This table also implies why the offset reported in Lindegren et al. (2016) is only mas because majority of those 87,000 stars are beyond 100 pc.
Although Lindegren et al. (2016) reported a relatively small offset of mas between DR1 and the revised Hipparcos results, they found a north-south (N-S) asymmetry when dividing their sample at ecliptic latitude () = 0: the northern stars have a larger offset ( mas) than the southern stars ( mas). We examined our sample of 612 stars within 25 pc for a N-S asymmetry, and also find a significant difference, but in the opposite sense of Lindegren et al. (2016): the southern star parallaxes are offset by , whereas the northern stars are offset by only (see Table Distance Dependent Offsets between Parallaxes for Nearby Stars and Gaia DR1 Parallaxes). There is no obvious explanation for this difference.
5 Conclusions
We have performed parallax comparisons between the Gaia’s DR1 and previously available parallax measurements for single stars within 25 pc. We conclude that there is an offset of mas between DR1 and available weighted mean parallaxes, in the sense that the DR1 results place stars at slightly larger distances than previous measurements. We also found that the Luz-Kelker bias has a negligible effect on this systematic offset reported here. Although the offset is small, it is particularly important to resolve this discrepancy if it systematically affects stars at much greater distances, for which the parallax measurements will be less than a few milliarcseconds. We also found that the offset depends on how the samples are drawn. Nearby stars tend to have larger offsets than more distant stars, at least out to 100 pc. The offsets for the ensemble of stars within 25 pc is comparable to that reported in Stassun & Torres (2016), yet only 10% of their binaries were closer than 100 pc. We suspect that they have over-estimated their offset because most of their stars are much further away than our 612 single stars. Following the trend of smaller offsets at larger distances, more distant samples, like that in Lindegren et al. (2016), will exhibit smaller offsets. However, we expect the next GAIA data release will resolve this offset due to distances. Given the significant work that has gone into measuring their large parallaxes independently, the nearest stars, once again, can play a crucial role in understanding our Milky Way.
6 Acknowledgments
We thank the anonymous referee and N. Hambly for valuable comments
that improved this manuscript. Work on constructing this 25 pc sample
has been supported by National Science Foundation under grants
AST-0507711, AST-0908402, AST-1109445, and AST-141206. This research
has made use of the SIMBAD database, operated at CDS, Strasbourg,
France. This publication makes use of data products from the Two
Micron All Sky Survey, which is a joint project of the University of
Massachusetts and the Infrared Processing and Analysis
Center/California Institute of Technology, funded by the National
Aeronautics and Space Administration and the National Science
Foundation. This work has made use of data from the European Space
Agency (ESA) mission Gaia
(http://www.cosmos.esa.int/gaia), processed by the Gaia
Data Processing and Analysis Consortium
(DPAC,
http://www.cosmos.esa.int/web/gaia/dpac/consortium). Funding
for the DPAC has been provided by national institutions, in particular
the institutions participating in the Gaia Multilateral
Agreement.
References
- Bessell (1990) Bessell, M. S. 1990, PASP, 102, 1181
- Brown et al. (2016) Brown, A., Vallenari, A., Prusti, T., et al. 2016, arXiv:1609.04172
- Casertano et al. (2016) Casertano, S., Riess, A., Bucciarelli, B., et al. 2016, arXiv:1609.05175
- Dahn et al. (1988) Dahn, C. C., Harrington, R. S., Kallarakal, V. V., et al. 1988, AJ, 95, 237
- Dittmann et al. (2014) Dittmann, J. A., Irwin, J. M., Charbonneau, D., & Berta-Thompson, Z. K. 2014, ApJ, 784, 156
- Fabricius & Makarov (2000) Fabricius, C., & Makarov, V. V. 2000, A&AS, 144, 45
- Gliese & Jahreiss (1995) Gliese, W., & Jahreiss, H. 1995, VizieR Online Data Catalog, 5070
- Hambly et al. (2001) Hambly, N. C., Davenhall, A. C., Irwin, M. J., & MacGillivray, H. T. 2001, MNRAS, 326, 1315
- Harrington & Dahn (1980) Harrington, R. S., & Dahn, C. C. 1980, AJ, 85, 454
- Harrington et al. (1993) Harrington, R. S., Dahn, C. C., Kallarakal, V. V., et al. 1993, AJ, 105, 1571
- Henry & Jao (2015) Henry, T. J., & Jao, W.-C. 2015, IAU General Assembly, 22, 2253773
- Henry et al. (2004) Henry, T. J., Subasavage, J. P., Brown, M. A., et al. 2004, AJ, 128, 2460
- Høg et al. (2000) Høg, E., Fabricius, C., Makarov, V. V., et al. 2000, A&A, 355, L27
- Ianna et al. (1996) Ianna, P. A., Patterson, R. J., & Swain, M. A. 1996, AJ, 111, 492
- Jao et al. (2005) Jao, W.-C., Henry, T. J., Subasavage, J. P., et al. 2005, AJ, 129, 1954
- Khovritchev et al. (2013) Khovritchev, M. Y., Izmailov, I. S., & Khrutskaya, E. V. 2013, MNRAS, 435, 1083
- Kilkenny et al. (2007) Kilkenny, D., Koen, C., van Wyk, F., Marang, F., & Cooper, D. 2007, MNRAS, 380, 1261
- Koen et al. (2010) Koen, C., Kilkenny, D., van Wyk, F., & Marang, F. 2010, MNRAS, 403, 1949
- Lindegren et al. (2016) Lindegren, L., Lammers, U., Bastian, U., et al. 2016, arXiv:1609.04303
- Luyten & Hughes (1980) Luyten, W. J., & Hughes, H. S. 1980, Proper Motion Survey, University of Minnesota, 55,
- Perryman et al. (1997) Perryman, M. A. C., et al. 1997, A&A, 323, L49
- Riedel et al. (2010) Riedel, A. R., Subasavage, J. P., Finch, C. T., et al. 2010, AJ, 140, 897
- Riess et al. (2011) Riess, A. G., Macri, L., Casertano, S., et al. 2011, ApJ, 730, 119
- Shkolnik et al. (2012) Shkolnik, E. L., Anglada-Escudé, G., Liu, M. C., et al. 2012, ApJ, 758, 56
- Stassun & Torres (2016) Stassun, K. G., & Torres, G. 2016, arXiv:1609.05390
- Subasavage et al. (2009) Subasavage, J. P., Jao, W.-C., Henry, T. J., et al. 2009, AJ, 137, 4547
- Weis (1987) Weis, E. W. 1987, AJ, 93, 451
- Weis (1988) Weis, E. W. 1988, AJ, 96, 1710
- Weis (1991) Weis, E. W. 1991, AJ, 101, 1882
- Weis (1991) Weis, E. W. 1991, AJ, 102, 1795
- Weis (1993) Weis, E. W. 1993, AJ, 105, 1962
- Weis (1996) Weis, E. W. 1996, AJ, 112, 2300
- Weis et al. (1999) Weis, E. W., Lee, J. T., Lee, A. H., et al. 1999, AJ, 117, 1037
- Winters et al. (2015) Winters, J. G., Henry, T. J., Lurie, J. C., et al. 2015, AJ, 149, 5
- van Altena et al. (1995) van Altena, W. F., Lee, J. T., & Hoffleit, D. 1995, The General Catalogue of Trigonometric Stellar Parallaxes (4th ed.; New Haven: Yale Univ. Obs.)
- van Leeuwen (2007) van Leeuwen, F. 2007, A&A, 474, 653
| R.A. (2000.0) | Decl. (2000.0) | Name | HIP | Gaia | P.A. | Ref | V | Ref | G | # of | Ref | ||||||
|---|---|---|---|---|---|---|---|---|---|---|---|---|---|---|---|---|---|
| source_id | (″/yr) | (deg) | (mag) | (mag) | (mag) | (mas) | (mas) | (mas) | (mas) | ||||||||
| (1) | (2) | (3) | (4) | (5) | (6) | (7) | (8) | (9) | (10) | (11) | (12) | (13) | (14) | (15) | (16) | (17) | (18) |
| 00:05:17.68 | 67:49:57.4 | GJ0003 | 436 | 4706630496753986944 | 0.571 | 191.9 | 8 | 8.48 | 2 | 5.71 | 8.00 | 62.970 | 0.709 | 2 | 23,26 | 61.142 | 0.3358 |
| 00:06:19.19 | 65:50:25.9 | LHS1019 | 523 | 4899957901143352576 | 0.586 | 160.5 | 8 | 12.17 | 13 | 7.63 | 10.92 | 59.850 | 2.640 | 1 | 26 | 57.100 | 0.3270 |
| 00:06:36.77 | 29:01:17.4 | GJ0005 | 544 | 2860924685628241024 | 0.420 | 115.1 | 8 | 6.06 | 1 | 4.31 | 5.82 | 73.100 | 0.558 | 2 | 23,26 | 72.627 | 0.5204 |
| 00:08:27.29 | 17:25:27.3 | HIP000687 | 687 | 2772804841615919616 | 0.110 | 233.8 | 8 | 10.80 | 19 | 6.98 | 9.89 | 45.980 | 1.930 | 1 | 26 | 46.386 | 0.3303 |
| 00:12:50.25 | 57:54:45.4 | GJ2001 | 1031 | 4918476357015844352 | 0.123 | 286.8 | 8 | 7.23 | 13 | 5.38 | 6.96 | 49.530 | 0.580 | 1 | 26 | 48.461 | 0.3542 |
References. — (1)this work; (2)Bessell 1990; (3)Dahn et al. 1988; (4)Dittmann et al. 2014; (5)Fabricius & Makarov 2000; (6)Harrington & Dahn 1980; (7)Harrington et al. 1993; (8)Høg et al. 2000; (9)Ianna et al. 1996; (10)Jao et al. 2005; (11)Khovritchev et al. 2013; (12)Kilkenny et al. 2007; (13)Koen et al. 2010; (14)Riedel et al. 2010; (15)Shkolnik et al. 2012; (16)Subasavage et al. 2009; (17)Weis 1987; (18)Weis 1988; (19)Weis 1993; (20)Weis 1996 (21)Weis et al. 1999; (22)Winters et al. 2015; (23)van Altena et al. 1995; (24)Weis 1991; (25)Weis 1991; (26)van Leeuwen 2007
Note. — This table is available in its entirety in a machine-readable form in the online journal. A portion is shown here for guidance regarding its form and content.
| Method 1 | Method 2 | Method 3 | ||||
|---|---|---|---|---|---|---|
| weighted mean horizon | Gaia-DR1 horizon | Gaia-DR1 horizon | ||||
| parallax sets | # of stars | offset | # of stars | offset | # of stars | offset |
| (mas) | (mas) | (mas) | (mas) | |||
| 80 | 85 | 0.340.11 | 80 | 0.290.10 | 128 | 0.500.08 |
| 4080 | 527 | 0.230.02 | 500 | 0.170.02 | 725 | 0.160.03 |
| 2040 | 3815 | 0.080.02 | ||||
| 1020 | 11592 | 0.060.01 | ||||
| all | 612 | 0.240.02 | 580 | 0.190.02 | 16260 | 0.070.01 |
| offset | 80 mas | 80 40 mas | total | |
|---|---|---|---|---|
| (mas) | # of stars | # of stars | # of stars | |
| North ( 0.) | 0.170.03 | 39 | 266 | 305 |
| South ( 0.) | 0.320.04 | 46 | 261 | 307 |