SDSS-IV MaNGA: Properties of galaxies with kinematically decoupled stellar and gaseous components
Abstract
We study the properties of 66 galaxies with kinematically misaligned gas and stars from MaNGA survey. The fraction of kinematically misaligned galaxies varies with galaxy physical parameters, i.e. , SFR and sSFR. According to their sSFR, we further classify these 66 galaxies into three categories, 10 star-forming, 26 “Green Valley” and 30 quiescent ones. The properties of different types of kinematically misaligned galaxies are different in that the star-forming ones have positive gradient in Dn4000 and higher gas-phase metallicity, while the green valley/quiescent ones have negative Dn4000 gradients and lower gas-phase metallicity on average. There is evidence that all types of the kinematically misaligned galaxies tend to live in more isolated environment. Based on all these observational results, we propose a scenario for the formation of star forming galaxies with kinematically misaligned gas and stars the progenitor accretes misaligned gas from a gas-rich dwarf or cosmic web, the cancellation of angular momentum from gas-gas collisions between the pre-existing gas and the accreted gas largely accelerates gas inflow, leading to fast centrally-concentrated star-formation. The higher metallicity is due to enrichment from this star formation. For the kinematically misaligned green valley and quiescent galaxies, they might be formed through gas-poor progenitors accreting kinematically misaligned gas from satellites which are smaller in mass.
keywords:
galaxies: surveys – galaxies: evolution – galaxies: formation – galaxy: abundances – galaxies: stellar content – galaxies: structure.1 Introduction
In the framework of hierarchical structure formation, a galaxy grows from primordial density fluctuations and its subsequent evolution is shaped by a range of internal and external processes. Galaxies can recycle gas through stellar mass loss. Stellar evolution models predict that a stellar population on average returns about half of its stellar mass to the interstellar space over a Hubble time (Jungwiert, Combes, & Palouš, 2001; Lia, Portinari, & Carraro, 2002; Pozzetti et al., 2007). As a result of the angular momentum conservation, such gas should be kinematically aligned with the stars. On the other hand, external processes, e.g. major mergers, minor mergers and gas accretion from the halo, could also bring a significant amount of gas into a galaxy to reshape its structure and evolution. If externally acquired gas can enter a galaxy with random angular momentum, a mismatch in the star and gas kinematics is expected (Bertola, Buson, & Zeilinger, 1992; Bureau & Chung, 2006; Corsini, 2014). Galaxies with misaligned gas and stellar kinematics are the key demonstrations for the regulation by external processes (Rubin, 1994; Schweizer & Seitzer, 1998).
The phenomenon of gas and star misalignment is now known to be ubiquitous in elliptical and lenticular galaxies. Systematic studies with long-slit spectroscopy have reported a fraction of 20–25 per cent (Bertola, Buson, & Zeilinger, 1992; Kuijken, Fisher, & Merrifield, 1996; Kannappan & Fabricant, 2001). This fraction increases to a value of 30-40 per cent with integral-field spectroscopy (Sarzi et al., 2006; Davis et al., 2011; Barrera-Ballesteros et al., 2014, 2015). However, the frequency of this phenomenon in the general galaxy population is still uncertain. There are only two statistical estimates of the frequency of counter rotators in a general population, and the sample size is about tens of galaxies (Kannappan & Fabricant, 2001; Pizzella et al., 2004). Both works report zero detection of counter rotators in star forming galaxies. Equally important, we have no idea about whether the physical mechanisms responsible for misaligned gas-star kinematics completely reshape the host galaxies or merely perturb them; whether there is any difference in the physical properties between blue and red misaligned galaxies, are they on an evolution sequence, or related in some way?
In this paper, we search for galaxies with decoupled gas and star kinematics from MaNGA (Mapping Nearby Galaxies at Apache Point Observatory, Bundy et al., 2015), a new integral field spectroscopic survey. The sample size of MaNGA is about ten times larger than that of ATLAS3D (Cappellari et al., 2011) and CALIFA (Sánchez et al., 2012). In contrast to long-slit spectroscopy which fails to identify the pattern of the kinematic misalignment between gas and stars out of the complicated kinematics in Spirals especially barred Spirals, the IFU observation is important in obtaining more robust determinations of misaligned gas/star kinematics. Finally, the MaNGA sample is unbiased with respect to morphology, inclination, color, etc. And it can be trivially corrected to a volume complete sample. This is the first time we study this kind of galaxies in a large and complete sample with IFU observation. Chen et al. (2016) report the fraction of kinematic misalignment phenomenon in different categories of galaxies: star-forming sequence, green valley and quiescent sequence. They focus on the misaligned star forming galaxies, finding their central regions undertake more intense star-formation than the outskirt, indicating the acquisition of external gas might be an important mechanism in the growth of the central regions. As a follow-up work, we look into the properties of misaligned galaxies in all these three categories. This paper is organized as follows. In Section 2, we briefly introduce the MaNGA survey and our data analysis method as well as sample selection criteria. The properties of the kinematically misaligned galaxies, including the fraction of misaligned galaxies as a function of galaxies physical parameters (, SFR, sSFR), the stellar population, metallicity as well as environment, are studied in Section 3. We discuss the observational results in Section 4. A short summary is presented in Section 5. We use the cosmological parameters = 70 km s-1 Mpc-1, = 0.3, and = 0.7 throughout this paper.
2 Data
2.1 The MaNGA Survey
MaNGA is one of three core programs in the fourth-generation Sloan Digital Sky Survey (SDSS-IV) that began on 2014 July 1 (Bundy et al., 2015; Drory et al., 2015; Yan et al., 2016), using SDSS 2.5-in telescope (Gunn et al., 2006). It is designed to investigate the internal kinematic structure and composition of gas and stars in an unprecedented sample of 10,000 nearby galaxies at a spatial resolution of 2′′ ( 1kpc). MaNGA employs dithered observations with 17 fiber-bundle integral field units with 5 sizes: 2N19 (12′′ in diameter), 4N37,4N61,2N91, 5N127 (32′′). Two dual-channel BOSS spectrographs (Smee et al., 2013) provide simultaneous wavelength coverage over 360010300 at R 2000. With a typical integration time of 3 hours, MaNGA reaches a target band signal-to-noise ratio of 48 (-1 per fiber) at 23 ABmag arcsec-2, which is typical for the outskirts of MaNGA galaxies. The observing strategy for MaNGA can be found in Law et al. (2015).
The MaNGA targets constitute a luminosity-dependent volume-limited sample, selected almost entirely from SDSS “main" galaxy sample (Strauss et al., 2002). An intensive effort to design and optimize the MaNGA target selection under various constraints and requirements is presented in D. A. Wake et al. (in preparation), who also give details on the final selection cuts applied and the resulting sample sizes and their distributions in various properties. In what follows, we present a brief conceptual summary based on a near-final set of selection criteria. The MaNGA sample design is predicated on three major concepts: (1) the sample size is required to be roughly 10,000 galaxies; (2) the sample is complete above a given stellar mass limit of log/> 9, and has a roughly flat log distribution. This selection is motivated by ensuring adequate sampling of stellar mass, which is widely recognized as a key parameter or “principal component" that defines the galaxy population; (3) the sample is chosen to prioritize uniform radial coverage in terms of the scale length associated with the galaxy’s light profile, which is the major-axis half-light radius, .
MaNGA selects “Primary" and “Secondary" samples defined by two radial coverage goals. The Primary selection (z= 0.03) reaches 1.5 (for more than 80 per cent of its targets) sampled with an average of five radial bins. It accounts for 5000 galaxies. To the Primary selection we add a “Color-Enhanced sample" (CE) of an additional 1700 galaxies designed to balance the color distribution at fixed . The color enhancement increases the number of high-mass blue galaxies, low-mass red galaxies, and “green valley" galaxies tracing important but rare phases of galaxy evolution. We refer to these two selections as “Primary+". The Secondary selection of 3300 galaxies (z = 0.045) is defined in an identical way to the Primary sample, but with a requirement that 80 per cent of the galaxies be covered to 2.5 . In this work, we use 1351 galaxies that have been observed by MaNGA till the summer of 2015. The 1351 galaxies here constitute the first year of MaNGA observing. MaNGA targets are observed plate by plate, so and subset selected this way will have the exact same distribution of IFU sizes as the final sample and should be a representative subset of the final sample.
2.2 Data Analysis
2.2.1 Spectral fitting
Principal component analysis (PCA) is a standard multivariate analysis technique, designed to identify correlations in large data sets. Using PCA, Chen et al. (2012) designed a method to estimate stellar masses, mean stellar ages, star formation histories (SFHs), dust extinctions and stellar velocity dispersions for galaxies from the Baryon Oscillation Spectroscopic Survey (BOSS). To obtain these results, we use the stellar population synthesis models of (Bruzual & Charlot, 2003, BC03) to generate a library of model spectra with a broad range of SFHs, metallicities, dust extinctions and stellar velocity dispersions. The PCA is run on this library to identify its principal components (PC) over a certain rest-frame wavelength range 37005500. We then project both the model spectra and the observed spectra onto the first seven PCs to get the coefficients of the PCs, which represents the strength of each PC presented in the model or observed spectra. We derive statistical estimates of various physical parameters by comparing the projection coefficients of the observed galaxy to those of the models as follows. The goodness of fit of each model determines the weight to be assigned to the physical parameters of that model when building the probability distributions of the parameters of the given galaxy. The probability density function (PDF) of a given physical parameter (in this work it is stellar velocity dispersion) is thus obtained from the distribution of the weights of all models in the library. We characterize the PDF using the median and the 16 per cent 84 per cent range (equivalent to 1 range for Gaussian distributions).
In this work, we directly use the PCs given by Chen et al. (2012). In order to get the velocity field of a galaxy, we shift the best fit model from 1000 km s-1 to 1000 km s-1 by a step size of 2 km s-1. For each step, we calculate reduced between the best fit model and the observed spectrum, the rotation velocity of stars at a certain pixel is determined by the fit with the lowest value. The uncertainty of the rotation velocity is given by the width of the minimum at which = 1. Comparing with other codes (e.g. pPXF, Cappellari & Emsellem, 2004) designed for extracting the stellar kinematics and stellar population from absorption-line spectra of galaxies, the advantage of PCA is that it includes PCs which carry the information of stellar velocity dispersion, and the small and non-degenerate template set (PCs) makes it possible to obtain good velocity dispersion measurements on low S/N data, removing the need for spatial binning of the data. On the other hand, since we do not need to fit stellar velocity dispersion as a free parameter like , the PCA method transfers a two-dimensional numerical problem into one-dimension, largely decreasing the calculation time. The disadvantage is that it can not give h3 and h4 Gauss-Hermite moments.
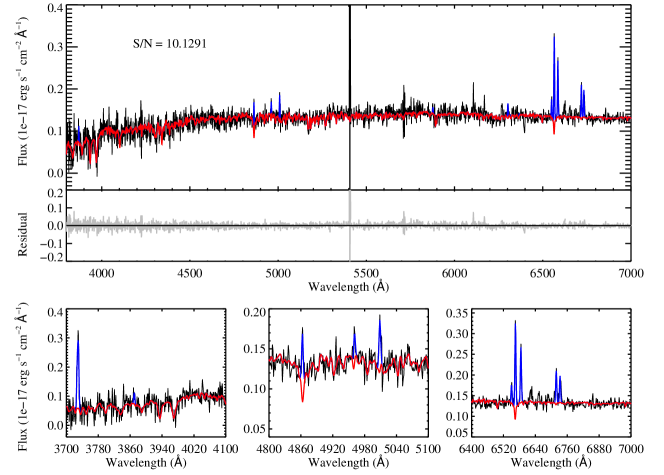
Once we have the rotation velocity and stellar velocity dispersion for each spatial pixel, we model the stellar continuum of each spectrum using the BC03 stellar population synthesis models to separate the stellar continuum and absorption lines from the nebular emission lines. The best fit continuum model is then subtracted from the observed spectrum to give the pure emission line spectrum, and each emission line is then fitted with one Gaussian component. We include [O ii]3727, H, [O iii]4959,5007, H, [N ii]6584, [S ii]6717,6731 in our emission line fitting. The line center and width of them are all tied together. Figure 1 shows one example of the continuum and emission line fit. The black line is the observed spectrum with a median S/N 10 and the best fit model is in red. The blue components are the best Gaussian fit of emission lines. We derive the velocity field of ionized gas by comparing the line centers of emission lines to the rest-frame values.
2.2.2 Velocity field
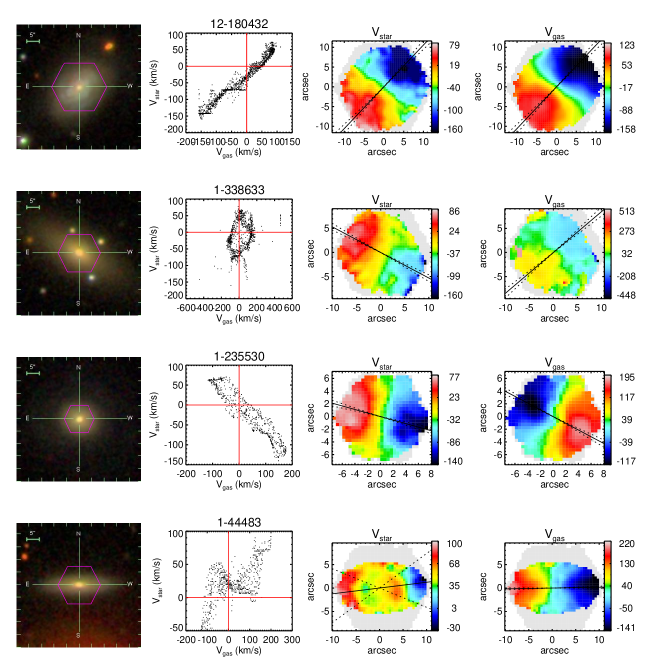
In Figure 2, we show the velocity fields of stars and ionized gas of four galaxies as examples. The top panel shows a galaxy in which the kinematics of gaseous and stellar components are aligned with each other; in the second row, we show a galaxy with gas and stars rotating perpendicularly; in the third row, it is an example of counter rotating galaxy; while the fourth row shows a 2 galaxy as that was found from ATLAS3D (Krajnović et al., 2011). 2 galaxies are galaxies which are the superposition of two counter-rotating stellar disks. This produces a special velocity field with counter-rotation stellar core. The stellar velocity dispersion maps usually have two peaks along the major-axis away from the center, at the position where the two disks have the maximum difference in rotation velocity (which increases the value of stellar velocity dispersion), hence the name “2". These galaxies are formed either by accretion of counter-rotating gas, or by the merging of two coplanar disks. The direction of the angular momentum vector of any tracer can be found by estimating its kinematic position angle (PA). The kinematics PAs of warm ionized gas and stars are measured using the FIT_KINEMATIC_PA routine described in appendix C of Krajnović et al. (2006). It is defined as the counter-clockwise angle between north and a line which bisects the tracer’s velocity field, measured on the receding side. One can then define the kinematic misalignment angle = as the difference between the kinematic PAs of gas and stars. The solid lines in Figure 2 show the best fit position angles and the two dashed lines show the error. We define galaxies with as gas-star misaligned ones.
2.2.3 Star formation rates stellar masses
Chang et al. (2015) produced new calibrations for global SFR and by combining SDSS and WISE photometry for the SDSS spectroscopic galaxy sample. They created the spectral energy distributions (SEDs) that cover = 0.4-22 for 858,365 present-epoch galaxies. Using MAGPHYS, they then modeled the attenuated stellar SED and dust emissions at 12 and 22 , calibrating the global SFR as well as . We match the MaNGA galaxies with Chang’s catalog to get the global SFR and stellar mass, finding 1220 matches. According to our definition, 66 of them are star-gas misaligned ones (Chen et al., 2016).
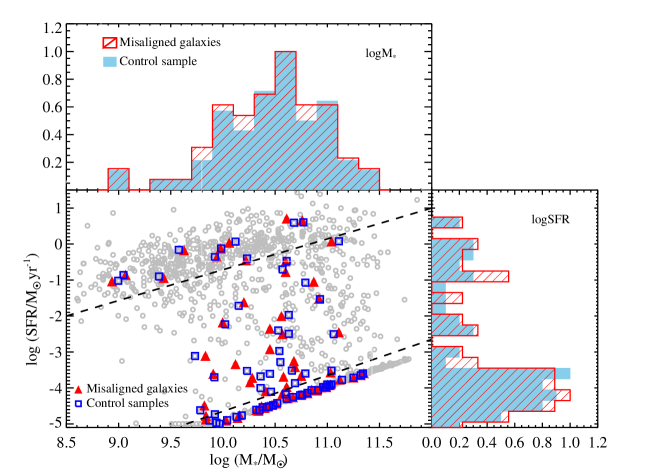
To investigate how the properties of misaligned galaxies are different from others, we built a control sample of 66 kinematically aligned galaxies as comparison. For each misaligned galaxy, we select a kinematically aligned () control galaxy which is closely matched in SFR and . The motivations for choosing this set of matching parameters are the following: (i) constraining the control galaxies to have similar stellar mass is extremely important because stellar population properties are known to vary strongly as a function of galaxy mass. (ii) constraining the control galaxies to have similar SFR is due to the fact that the fraction of kinematically misaligned galaxies is a strong function of star formation activity, see section 3.1. Figure 3 shows the distributions of kinematically misaligned galaxies (red) and the control sample (blue) in SFR vs. diagram. The top panel gives the histograms of of misaligned sample (red) and control sample (blue). The right panel shows the histograms of SFR. The peaks of all the histograms are set to 1. The control galaxies we select match well with the misaligned galaxies in these two parameters.
We further classify 66 misaligned/control galaxies into 10 star-forming, 26 “Green Valley” and 30 quiescent galaxies based on their locations in SFR vs. diagram. The star-forming galaxies are defined as , the quiescent ones have and the galaxies in between are defined as green valley galaxies. The two dashed lines in Figure 3 are to discriminate star-forming, green valley and quiescent galaxies. These three categories of misaligned/control galaxies are used in following sections.
3 Results
3.1 The fraction of kinematically misaligned galaxies as a function of galaxy physical parameters
Thanks to MaNGA target selection strategy, it provides us with a representative sample of all galaxy types where the selection is well understood. Also due to the large sample of MaNGA, for the first time, we can study how the fraction of kinematic misalignment depends on galaxies physical parameters, i.e. , SFR, sSFR SFR/, over all galaxy types.
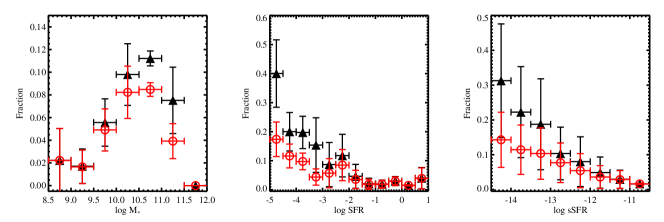
Figure 4 shows the fraction of kinematically misaligned galaxies as a function of (left), SFR (middle) and sSFR (right). We estimate the sample variance errors using a bootstrap technique, by resampling the MaNGA galaxies for 2000 times. The errors are given by the root-mean-square difference between the fraction values calculated from each bootstrap sample and the mean value. It is clear that this fraction peaks at log/ 10.5, and it is a decreasing function of SFR as well as sSFR. In quality, the strong clustering of the galaxies with decoupled gas and star kinematics in galaxies with weak star formation activity can be easily understood – if all the galaxies accrete retrograde gas with equal probability, then for the gas poor low SFR galaxies, the accreted gas would survive longer since the interaction with existing gas is less important and the collision cross section between gas and star is too small to influence the retrograde angular momentum of the accreted gas. The reduction of this fraction at low stellar mass end corresponds to the fact that in the local universe, galaxies with log/ 10 are dominated by star forming ones with higher sSFR. The decreasing of this fraction at the high mass end is consistent with the result of ATLAS3D (Davis et al., 2011), which is based on a sample of massive early type galaxies (ETGs). They suggest that the alignment in the most massive galaxies can be caused by galaxy scale processes which reduce the probability that cold, kinematically misaligned gas can be accreted on to the galaxy, i.e. AGN feedback, the ability to host a hot X-ray gas halo, or a halo mass threshold.
3.2 Galaxy morphologies and H EQW maps
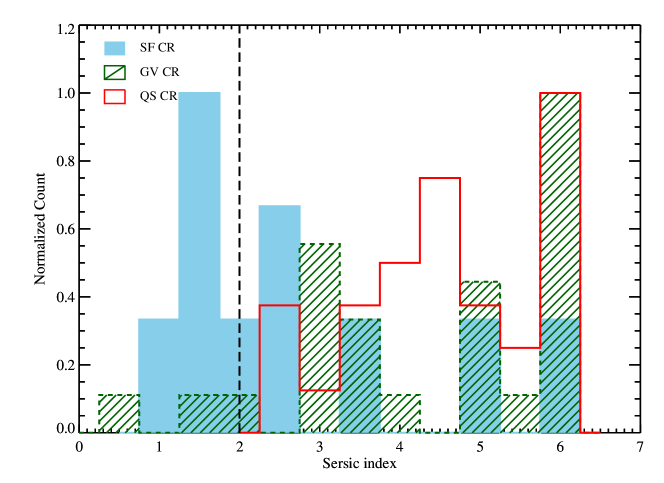
Before undertaking any further investigations on these kinematically misaligned galaxies, we look into their morphologies first. We use the srsic indices n (Sérsic, 1963, 1968) to characterize the morphologies of 66 kinematically misaligned galaxies. The surface brightness profile of galaxies can be fit by the Srsic profile:
| (1) |
where is the central surface brightness and is the effective radius that encloses half of the total light. The parameter is the well known srsic index. Figure 5 shows the distribution of the srsic index taken from NASA-Sloan Atlas(Abazajian et al., 2009; Blanton et al., 2011)111 http://www.nsatlas.org/ for star-forming (blue), green valley (green) and quiescent (red) kinematically misaligned galaxies. The vertical dashed line marks the position of , which is the often used proxy for bulge versus disk dominated galaxies. Misaligned star forming galaxies are indeed more disk like, while most green valley and quiescent misaligned galaxies seem to be spheroid dominated. However, this should be confirmed dynamically, e.g. via an objective assessment of the stellar angular momentum.
Sixty percent of the star-forming, 92% green valley and all the quiescent misaligned galaxies have srsic indices 2. While the fraction of the overall galaxy population for each category is 27, 68 and 96%, respectively. The srsic index distribution of star forming and green valley misaligned galaxies are significantly different from their general galaxy population.
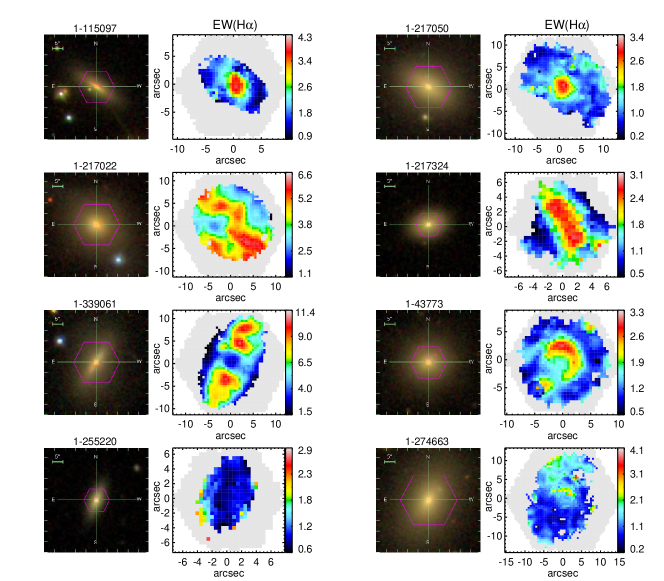
In Figure 6, we show the SDSS false-color images and the H equivalent width (EQWHα) maps of 8 kinematically misaligned galaxies. All the spaxels shown in the EQWHα maps have reliable emission line detections with S/N 3. We divide the 66 kinematically misaligned galaxies into the following four classes based on the substructures revealed in EQWHα maps.
-
(1)
About 23 per cent of misaligned galaxies have EQWHα peaking at center and decreasing with radius (top panel of Figure 6).
-
(2)
EQWHα map has biconical patterns. These galaxies with old stellar populations are referred as the “red geysers” discovered by Cheung et al. (2016) in MaNGA survey, providing a strong indication on the material exchange processes such as gas accretion, minor merger and outflow (second panel). We only find 4 misaligned galaxies (6 per cent) with this feature.
-
(3)
There are 10/66 misaligned galaxies show ring-like or off-center structure in EQWHα map (third panel).
-
(4)
The whole EQWHα maps of 56 per cent misaligned galaxies are smooth, no obvious substructure exists (fourth panel).
3.3 Stellar population
3.3.1 Dn4000 & HA map
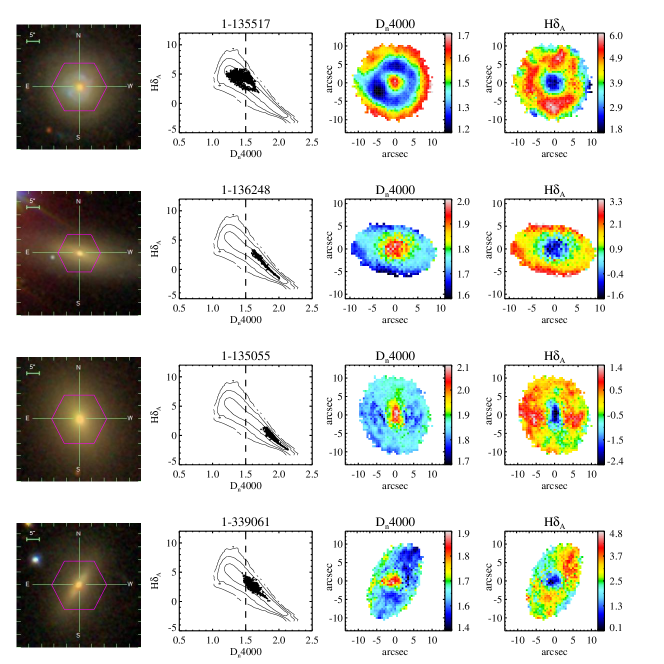
We investigate the star formation history of kinematically misaligned galaxies using the Dn4000 versus HA diagnostic diagram developed by Kauffmann et al. (2003). It is based on the measurement of two famous spectral indices around the 4000Å wavelength region, the 4000Å break (Dn4000) and the strength of H absorption line (HA). At wavelength around 4000Å , galaxy spectra vary in both spectral shape and strength of H absorption line. These two are inversely correlated: younger galaxies have deeper H absorption and weaker 4000Å break. The combination of these two indices can tell us the recent star formation history of galaxies.
We closely follow the measurements adopted by Kauffmann et al. (2003). The index Dn4000 is parameterized as the ratio of the flux density between two narrow continuum bands 3850 – 3950 and 4000 – 4100Å. The HA index is defined as the equivalent width of H absorption feature in the bandpass 4083 – 4122Å. We measure the parameters for each spaxel and place them in Dn4000 versus HA diagram. Considering the uncertainty of the spectral fitting, we only use the spaxels with median signal-to-noise ratio per pixel greater than 10.
Figure 7 shows examples of spatial resolved Dn4000 and HA distribution. Different rows show representatives of different types of kinematically misaligned galaxies. From top to bottom, they are star-forming, green valley, quiescent galaxies, respectively. From left to right, the columns in Figure 7 show the SDSS false-color images, the Dn4000 vs. HA planes, as well as the Dn4000 and HA maps, respectively. The background contour is the distribution of SDSS DR4222http://wwwmpa.mpa-garching.mpg.de/SDSS/DR4/rawdata.html results in which the two parameters are measured in exactly the same way (Brinchmann et al., 2004). For green valley/quiescent galaxies, most of the spaxels have Dn4000 > 1.5, indicating they are dominated by old stellar populations. In opposite, the star-forming galaxies are dominated by younger stellar populations with Dn4000 less than 1.5. This is an expected result since the classifications of star forming, green valley and quiescent galaxies are based on sSFR, and there is an anti-correlation between Dn4000 and sSFR (Kauffmann et al., 2004). This is consistent with the fact that star-forming misaligned galaxies are blue disk-like galaxies while green valley and quiescent misaligned galaxies are red and bulge-dominated galaxies with lower SFR.
3.3.2 Radial profiles of Dn4000 & HA
In this section, we present the comparison of radial profiles of Dn4000 and HA between kinematically misaligned galaxies and their control samples.
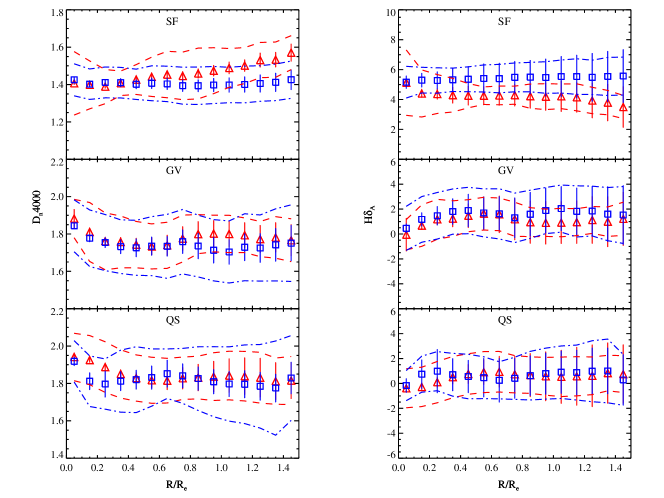
In Figure 8, we show Dn4000 and HA as a function of radius within 1.5 for star-forming, green valley and quiescent misaligned galaxies (red triangles) as well as their control sample (blue squares). The symbols show the mean values in bins of 0.1 . The dashed lines and dash-dot lines show the scatter region for kinematically misaligned and control samples, respectively. The radii are the projected distances from the galactic center to the spaxels where indices are measured, in the unit of the effective radius.
As the Dn4000 radial profiles show, both the green valley/quiescent misaligned galaxies and their control samples have negative gradients. The stellar populations within 1.5 are old with Dn4000 1.8. In contrast, the star-forming misaligned galaxies have obvious positive gradient in Dn4000, indicating the stellar populations in the central regions are younger than those at outskirts, while the control sample has a flat distribution of Dn4000. Chen et al. (2016) introduce the star formation activity parameter to quantify the growth of the misaligned galaxies, finding the rapid growth of the central regions in these galaxies by the acquisition of counter-rotating gas.
3.4 Gas-phase metallicity
The chemical abundance is powerful in constraining the evolution and star formation histories of galaxies. Comparing with the stellar metallicity derived from absorption features, the gas-phase metallicity derived from the strong nebular emission lines have the following advantages (Tremonti et al., 2004): (1) the S/N of emission lines exceed that of continuum, and many optically faint galaxies exhibit the highest emission-line equivalent widths. (2) the metallicity measured from emission lines is free of the uncertainty caused by age and -enhancement which plague the interpretation of absorption-line indices. (3) the gas-phase metallicity can reflect the present-day abundance rather than the average of the past generations of stellar populations. However, the prevalent strong-line abundance diagnostics are developed using the stellar population synthesis and photoionization models, which limits these estimations to be only applicable to the HII regions (Kewley & Dopita, 2002).
For the first step, we use the BPT diagram (Baldwin, Phillips, & Terlevich, 1981) to separate areas with the AGN excitations, SF excitations, and the combination of them as well as the LINER-like excitations by the criterion described in Kewley et al. (2001) and Kauffmann et al. (2003). Only the spaxels with reliable emission line detection (S/N 3) are used.
For the misaligned star forming galaxies, they experience on-going star formation in the central regions (Chen et al., 2016). Therefore, we directly match them to the MPA/JHU catalog333http://wwwmpa.mpa-garching.mpg.de/SDSS/DR7/oh.html to get the metallicity (Tremonti et al., 2004) for eight star forming misaligned galaxies. For green valley/quiescent misaligned galaxies, we find 7 of them have regions dominated by ionization from star-formation, 5 in green valley and 2 in quiescent sequence. Except for two galaxies in which the star formation regions are at the center, all the others have extended star-forming regions ranging from 0.3 to 1.3 . Because most of the star-forming regions in the 7 green valley/quiescent galaxies are located in the outskirts and the star-forming spaxels distribute close to each other or in a ring, we stack the spectra from star-forming regions in each galaxy to improve S/N, and derive the metallicity from stacked spectra. Here we use exactly the same metallicity indicator as that used in Tremonti et al. (2004).
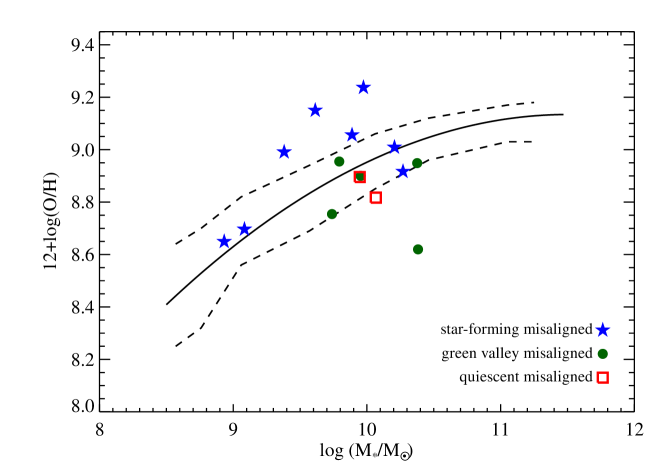
Figure 9 shows the stellar mass-metallicity relation. The solid line is the stellar massmetallicity relation for the local star forming galaxies given by Tremonti et al. (2004), the two dashed lines show the scatter region. For the star-forming galaxies (blue stars), we find that half of them follow the typical massmetallicity relation, the other half lie above this relation by about 0.30.4 dex. In contrast, the green valley/quiescent galaxies (green dots/red squares) are systematically below the typical massmetallicity relation by about 0.1 dex.
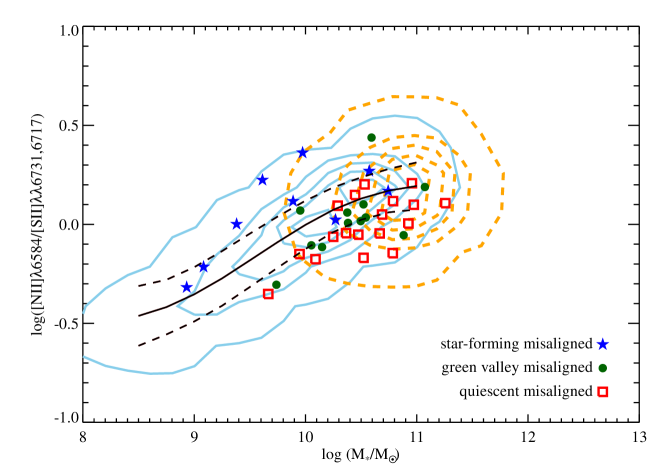
Considering that the spaxels we used in green valley/quiescent galaxies are 0.31.3 away from the center, the universal negative metallicity gradient (0.1 dex per ) may contribute to the lower metallicity we observed. On the other hand, there are only 7 green valley/quiescent galaxies have metallicity measurements and they might not be the representatives for the whole green valley/quiescent misaligned population. Considering the gas in most misaligned green valley/quiescent galaxies is not excited by star formation, we apply an alternative indicator [N ii]6584/[S ii]6717,6731 to trace the metallicity. [N ii]6584/[S ii]6717,6731 is a good indicator because nitrogen is a secondary -process element while sulphur is the primary nucleosynthesis element (Kewley & Dopita, 2002; Dopita et al., 2013). Although [N ii]6584/[S ii]6717,6731 is the proxy for N/O ratio, in the range of 12+log(O/H) > 8.0, it correlates with O/H abundance very well (Dopita et al., 2016; Kashino et al., 2016). Also, the two emission lines are close in wavelength so the reddening is negligible.
In Figure 10, we show vs. ([N ii]6584/[S ii]6717,6731) for SDSS star forming galaxies (blue contour) and LINERs (orange contour) for the central 3 arcsec region. The data are taken from MPA/JHU DR7 catalog. The black solid line shows the median value and two dashed lines show the scatter region. There is a strong correlation between stellar mass and [N ii]6584/[S ii]6717,6731. The change of 0.1 dex in [N ii]6584/[S ii]6717,6731 responds to less than an order-of-magnitude change in stellar mass. The LINERs overlap with the star forming galaxies. The over-plotted symbols are the kinematically misaligned galaxies. Consistent with what we see in Figure 9, the star-forming misaligned galaxies (blue stars) have higher [N ii]6584/[S ii]6717,6731. While misaligned green valley/quiescent galaxies are systematically 0.1 dex lower than the median value of the whole galaxy sample at fixed stellar mass.
As we know, the gas in the kinematically misaligned galaxies comes from external processes, i.e. gas accretion or mergers. If the gas is accreted from cosmic web, the metallicity should be 1 dex lower than the typical value. The fact that it is only 0.1 dex lower in metallicity for green valley and quiescent misaligned galaxies indicates that the gas is accreted from companions which are smaller in mass. This is consistent with Cheung et al. (2016), in which they find a kinematically misaligned galaxy is accreting materials from its less massive satellite. Davis et al. (2015) show that ETGs with signatures of recent minor mergers have low dust-to-gas ratio as well as metallicity, and typically undergo a recent 10-30:1 merger. This is also consistent with our current result as well as Cheung et al. (2016). However, if the progenitors contain considerable amount of gas, the pre-existing gas would collide with the accreted gas, leading to gas inflow and following star formation in the central regions. The higher central metallicity in star-forming misaligned galaxies could be due to the enrichment from the star formation. In a closed-box model (Dalcanton, 2007), the metallicity will mainly depend on the gas mass fraction , so the abundances get elevated very quickly as a large fraction of the available gas turns into stars. The low Dn4000 at the center in the star forming misaligned galaxies is a hint that those stars exist.
3.5 The environment
In this section, we compare the environment of the misaligned galaxies and the control sample to investigate the environmental dependence of the kinematic misalignment.
3.5.1 Estimating the environment
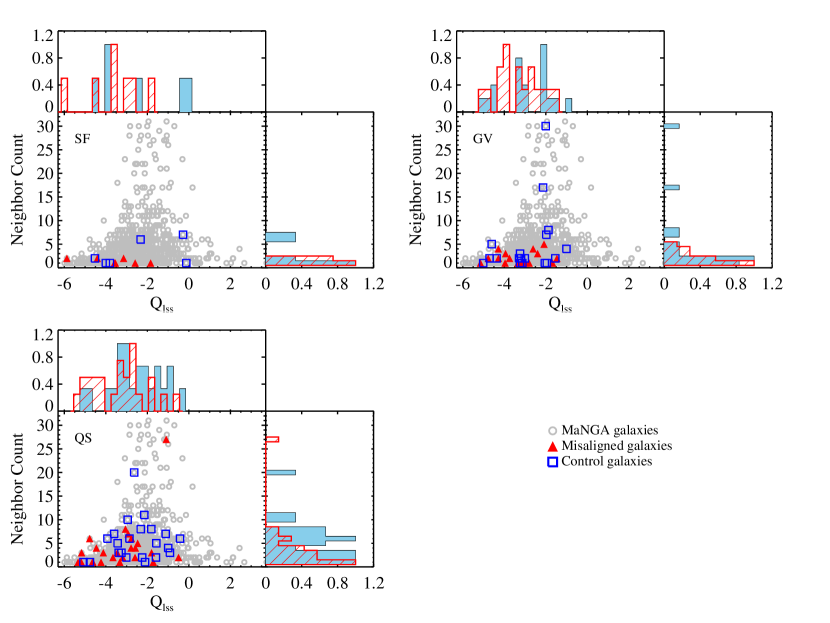
We characterize the environment with two parameters, the neighbor number () and the tidal strength parameter (). The neighbor number is defined as the counts of galaxies brighter than -19.5 mag in -band absolute magnitude within a fixed volume of 1 Mpc in projected radius and 500 km s-1 in redshift to the primary galaxy. Given the neighbor number is independent of the stellar mass and cannot account for the interaction a galaxy suffering from its satellites, we also use the tidal strength parameter to depict the effect of total interaction strength produced by all the neighbors within the fixed volume (Verley et al., 2007; Argudo-Fernández et al., 2015), the higher the parameter is, the stronger the interaction is. The parameter is defined as
| (2) |
where and are the stellar masses of the neighbor and the primary galaxy. The is the projected distance from the primary galaxy to the satellite and is the estimated diameter of the central galaxy (Argudo-Fernández et al., 2015).
For the misaligned sample, about 28.8 per cent (19 out of 66) of them have no neighbor brighter than 19.5 mag within the fixed volume (3 star-forming galaxies, 10 green valley galaxies and 6 quiescent galaxies). The relevant numbers for the control samples are 4, 8 and 8, respectively, corresponding to a fraction of 30 per cent in total.
We present the two environment parameters in Figure 11. Again we split the sample into star forming main sequence (top left), green valley (top right) and quiescent sequence (bottom). There is a trend that the kinematically misaligned galaxies (red triangles) are more isolated than the aligned control sample (blue squares) for all the three categories. The same trend has been reported by Katkov, Sil’chenko, & Afanasiev (2014) where they found around 71 per cent gaseous discs in isolated S0 galaxies are counter-rotating with stellar components. This is also consistent with the result from ATLAS3D (Davis et al., 2011), in which they find about 42 per cent of fast-rotating field ETGs have kinematically decoupled gas and stars while the fraction is much lower (10 per cent) for galaxies within Virgo cluster. For a better comparison with the result of Davis et al. (2011), we match our samples with the group catalog444http://gax.shao.ac.cn/data/Group.html generated by Yang et al. (2007), finding only 1 star-forming and 3 quiescent misaligned galaxies located in clusters (clusters are defined as halo mass ). And the fraction of kinematically misaligned galaxies decreases with increasing halo mass.
The above facts are consistent with what Davis et al. (2011) proposed that the dense environment would suppress the external processes of gas acquisition. However, due to the limitation of our sample size, the environmental dependence of misaligned galaxies is not very remarkable. Fortunately, the final MaNGA sample will include 10,000 galaxies, in which we expect 500 galaxies to present kinematic misalignment.
3.5.2 Galaxy pair
In this Section, we further investigate whether the kinematic misalignment is caused by close interaction, by quantifying the frequency of close companions. It is well known that the SDSS spectroscopic sample suffers from the incompleteness for close pairs less than 55′′ due to the fiber collision. Fortunately, many SDSS regions are observed by multiple plates such that some close pairs can be recovered. It has been shown that with proper correction with spectroscopic completeness, it is possible to conduct a statistical study of close pairs with the SDSS sample (Patton & Atfield, 2008). In what follows, we ignore the spectroscopic incompleteness effect, since we are only interested in comparing the pair fraction between the kinematically misaligned sample and its corresponding control sample in a relative sense.
For each galaxy, we search for its spectroscopic companion(s) with projected separation 50 kpc/h and line-of-sight velocity difference 500 km s-1. We find 10 () misaligned galaxies are in pairs, 2 star-forming, 4 green valley as well as 4 quiescent, and the number of corresponding control sample in pairs are 2, 1 and 4, respectively. It seems that the kinematic misalignment is not necessarily associated with galaxy pairs, except for the misaligned green valley galaxies. Again, we caution that the sample size is quite limited. A larger sample is required to draw a more robust conclusion.
4 Discussion
The properties and origins of kinematically misaligned galaxies have been studied from the perspective of observations (Kannappan & Fabricant, 2001; Sarzi et al., 2006; Davis et al., 2011) and simulations (van de Voort et al., 2015; Lagos et al., 2015). However, previous studies are mainly focusing on ETGs (ellipticals and S0) but rarely in star-forming galaxies.
Thanks to the large complete MaNGA sample, Chen et al. (2016) for the first time detect kinematic misalignment in star-forming galaxies in a large complete sample. The fraction of misaligned galaxies detected in star-forming main sequence is 2 per cent, while the fraction in green valley and quiescent sequence is 7 per cent and 8 per cent , respectively.
We investigate the morphology, stellar population, metallicity as well as environment of different types of misaligned galaxies and find the star-forming misaligned galaxies have different properties from the green valley/quiescent ones.
4.1 Properties of kinematically misaligned galaxies
The morphologies of different types of misaligned galaxies are separated clearly by srsic index. About 90 per cent misaligned ones in green valley and quiescent sequence are early type galaxies with . In contrast, the misaligned star-forming galaxies are more disky, having lower sérsic index. Chen et al. (2016) fit the -band surface brightness profiles of the misaligned star-forming galaxies and find half of them already have photometric bulge components.
We use Dn4000 and HA to trace the local stellar populations. The green valley and quiescent misaligned galaxies are dominated by old stellar populations with Dn4000 1.8 and they have similar negative radial gradients as the control sample. Given that wet major merger is an efficient way in triggering star formation (Veilleux, Kim, & Sanders, 2002; Springel, Di Matteo, & Hernquist, 2005; Kormendy & Sanders, 1992), the high Dn4000 value suggests no wet major mergers occurred in green valley/quiescent misaligned galaxies within the last 12 Gyr. The star-forming misaligned galaxy sample has positive Dn4000 gradient with young stellar populations with Dn4000 1.5 at the central regions, while the control sample has a flat distribution of Dn4000 on average.
We use both 12+Log(O/H) and [N ii]6584/[S ii]6717,6731 as gas-phase metallicity tracers, finding the quiescent and green valley misaligned galaxies are 0.1 dex poorer in metal than the prediction of typical stellar mass-metallicity relation derived from local star-forming galaxies. But the value is not as low as that of the pristine gas from cosmic web. We propose the kinematically decoupled gas in green valley/quiescent galaxies is accreted from satellites which are smaller in stellar mass. Cheung et al. (2016) studied one misaligned galaxy in detail, finding it is stripping material from a companion. The situation is opposite in star-forming misaligned galaxies, where the metallicity is higher than the typical stellar mass-metallicity relation. Due to the intense star-forming activities at the central regions, large fraction of gas turns into stars and as a consequence elevates the abundance instantaneously.
By comparing the environments of the misaligned galaxies with a control sample closely matched in SFR , we find that the misaligned galaxies prefer to locate at lower density areas. In quality, this result is consistent with that of Davis et al. (2011), in which they find that the galaxies in Virgo cluster are mostly kinematically aligned between gas and stars while around 425 per cent field fast-rotating ETGs host kinematically misaligned gas. They propose the dense environment may suppress the host galaxies accreting external kinematically decoupled gas.
4.2 Origins of kinematically misaligned galaxies
The origin of kinematically misaligned galaxies is a puzzle for a long time. Given the angular momentum conservation, it’s natural to suppose external processes to play the key role in leading kinematic misalignment between gas and stars. Simulations show that episodic and continuous gas accretion (Thakar & Ryden, 1996, 1998) as well as merging with companions (Bois et al., 2011; Naab et al., 2014) can lead to kinematically decoupled components in the host galaxies.
For the misaligned galaxies located in the star forming main sequence, most of them have positive Dn4000 gradients. Chen et al. (2016) propose a scenario to explain this phenomenon. The gas-rich progenitors accrete external kinematically decoupled gas. The inevitable gas-gas collisions between accreted and pre-existing gas lead to the cancellation of angular momentum, accelerating the gas inflow. If the angular momentum carried by the external gas exceeds that in pre-existing gas, the kinematic misalignment would show up in the host galaxies. On the other hand, large amounts of gas sinks to the central region, leading to the fast centrally-concentrated star formation and instantaneous elevation of metallicity. This picture explains why the misaligned galaxies located in the star forming main sequence have positive radial profiles in Dn4000 and higher metallicity at galaxy centers. The stars formed through this process will finally become bulge components although at the beginning they belong to a disk from a kinematic point of view. In other words, this process leads to the fast growth of central parts of galaxies as Chen et al. (2016) suggested.
Most misaligned galaxies in green valley/quiescent sequence have old stellar population with Dn4000 1.8. Both the misaligned galaxies and control sample have similar negative radial gradients in Dn4000. And the metallicities in these galaxies are 0.1 dex lower than the prediction of local stellar mass-metallicity relation. In these green valley or quiescent galaxies, the progenitors might be passive gas-poor ETGs. They accrete misaligned gas from neighbors that are smaller in mass. On one hand, the amount of the accreted gas can only rejuvenate ETGs with low level star-formation activity. On the other hand, the small collision cross section between gas and stars leads to a long dynamical friction timescale. The gas-star misalignment will persist for 2-5 Gyr (van de Voort et al., 2015; Davis & Bureau, 2016) in these systems leading to a higher fraction of misaligned galaxies.
As we mentioned above, the accretion of large amount of misaligned gas is an efficient way for the growth of central part of galaxies (final bulge). Here comes the question whether bulges formed from misaligned gas acquisition have similar properties as those formed from the ordinary way, such as major merger. This question is out of the scope of the current paper, but should be an interesting project in near future.
5 Summary
We study 66 kinematically misaligned galaxies selected from 1351 MaNGA survey. These galaxies are classified into three categories according to their sSFR, 10 of them are star-forming galaxies, 26 located in the green valley and 30 are quiescent galaxies. The kinematically decoupled galaxies located in the star forming main sequence appear to have different properties, i.e. stellar populations, metallicity, from green valley and quiescent ones.
We study how the fraction of kinematically misaligned galaxies varies with galaxy physical parameters, i.e. , SFR, sSFR, finding the fraction peaks at log/ 10.5, and it decreases with SFR sSFR.
From the perspective of morphology, kinematic decoupled galaxies located in green valley and quiescent sequence appear to be bulge dominated. The star-forming misaligned galaxies are more disky. For all the kinematically misaligned galaxies, their ionized gaseous and stellar velocity fields are regular. However, their EQWHα maps can be classified into four different morphological types, i.e. peaks at center, biconical patterns, ring-like structures and no obvious structures.
The stellar populations traced by Dn4000 and HA show that stars in quiescent and green valley kinematically misaligned galaxies are old. The values of Dn4000 and HA indicate that these galaxies haven’t experienced substantial star formation in the past 12 Gyr. The kinematically misaligned galaxies located in the star forming main sequence have younger stellar populations and fast star formation at the central regions.
In quiescent and green valley kinematically misaligned galaxies, the gas-phase metallicity is 0.1 dex lower than the prediction of local stellar massmetallicity relation. While in star forming misaligned galaxies, half of them have 0.30.4 dex higher central gas-phase metallicity.
All types of kinematically misaligned galaxies prefer to locate in low density areas, indicating that dense environment would suppress the external process of gas acquisition and the formation of misaligned galaxies.
In the kinematically misaligned star-forming galaxies, the accreted gas collides with the pre-existing gas, losing angular momentum and triggering star formation in central regions, leading to the fast growth of the central regions. In contrast, the green valley/quiescent misaligned galaxies are formed in the way that gas-poor progenitors accrete kinematically decoupled gas from dwarf satellites.
Acknowledgements
Y.M.C acknowledge support from NSFC grant 11573013, 11133001, the Opening Project of Key Laboratory of Computational Astrophysics, National Astronomical Observatories, Chinese Academy of Sciences. Y.S. acknowledges support from NSFC grant 11373021, the CAS Pilot-b grant No. XDB09000000 and Jiangsu Scientific Committee grant BK20150014. C.A.T. acknowledges support from National Science Foundation of the United States Grant No. 1412287.
This work was supported by World Premier International Research Center Initiative (WPI Initiative), MEXT, Japan and by JSPS KAKENHI Grant Number JP15K17603
Funding for the Sloan Digital Sky Survey IV has been provided by the Alfred P. Sloan Foundation, the U.S. Department of Energy Office of Science, and the Participating Institutions. SDSS- IV acknowledges support and resources from the Center for High-Performance Computing at the University of Utah. The SDSS web site is www.sdss.org.
SDSS-IV is managed by the Astrophysical Research Consortium for the Participating Institutions of the SDSS Collaboration including the Brazilian Participation Group, the Carnegie Institution for Science, Carnegie Mellon University, the Chilean Participation Group, the French Participation Group, Harvard-Smithsonian Center for Astrophysics, Instituto de Astrofísica de Canarias, The Johns Hopkins University, Kavli Institute for the Physics and Mathematics of the Universe (IPMU) / University of Tokyo, Lawrence Berkeley National Laboratory, Leibniz Institut für Astrophysik Potsdam (AIP), Max-Planck-Institut für Astronomie (MPIA Heidelberg), Max-Planck-Institut für Astrophysik (MPA Garching), Max-Planck-Institut für Extraterrestrische Physik (MPE), National Astronomical Observatory of China, New Mexico State University, New York University, University of Notre Dame, Observatório Nacional / MCTI, The Ohio State University, Pennsylvania State University, Shanghai Astronomical Observatory, United Kingdom Participation Group, Universidad Nacional Autónoma de México, University of Arizona, University of Colorado Boulder, University of Oxford, University of Portsmouth, University of Utah, University of Virginia, University of Washington, University of Wisconsin, Vanderbilt University, and Yale University.
References
- Abazajian et al. (2009) Abazajian K. N., et al., 2009, ApJS, 182, 543-558
- Argudo-Fernández et al. (2015) Argudo-Fernández M., et al., 2015, A&A, 578, A110
- Baldwin, Phillips, & Terlevich (1981) Baldwin J. A., Phillips M. M., Terlevich R., 1981, PASP, 93, 5
- Barrera-Ballesteros et al. (2015) Barrera-Ballesteros J. K., et al., 2015, A&A, 582, A21
- Barrera-Ballesteros et al. (2014) Barrera-Ballesteros J. K., et al., 2014, A&A, 568, A70
- Bertola, Buson, & Zeilinger (1992) Bertola F., Buson L. M., Zeilinger W. W., 1992, ApJ, 401, L79
- Blanton et al. (2011) Blanton M. R., Kazin E., Muna D., Weaver B. A., Price-Whelan A., 2011, AJ, 142, 31
- Bois et al. (2011) Bois M., et al., 2011, MNRAS, 416, 1654
- Brinchmann et al. (2004) Brinchmann J., Charlot S., White S. D. M., Tremonti C., Kauffmann G., Heckman T., Brinkmann J., 2004, MNRAS, 351, 1151
- Bruzual & Charlot (2003) Bruzual G., Charlot S., 2003, MNRAS, 344, 1000 (BC03)
- Bundy et al. (2015) Bundy K., et al., 2015, ApJ, 798, 7
- Bureau & Chung (2006) Bureau M., Chung A., 2006, MNRAS, 366, 182
- Cappellari & Emsellem (2004) Cappellari M., Emsellem E., 2004, PASP, 116, 138
- Cappellari et al. (2011) Cappellari M., et al., 2011, MNRAS, 413, 813
- Chang et al. (2015) Chang Y.-Y., van der Wel A., da Cunha E., Rix H.-W., 2015, ApJS, 219, 8
- Chen et al. (2012) Chen Y.-M., et al., 2012, MNRAS, 421, 314
- Chen et al. (2016) Chen Y.-M., et al., 2016, Nature Commun., in press
- Cheung et al. (2016) Cheung E., et al., 2016, Natur, 533, 504
- Corsini (2014) Corsini E. M., 2014, ASPC, 486, 51
- Dalcanton (2007) Dalcanton J. J., 2007, ApJ, 658, 941
- Davis et al. (2011) Davis T. A., et al., 2011, MNRAS, 417, 882
- Davis et al. (2015) Davis T. A., et al., 2015, MNRAS, 449, 3503
- Davis & Bureau (2016) Davis T. A., Bureau M., 2016, MNRAS, 457, 272
- Dopita et al. (2013) Dopita M. A., Sutherland R. S., Nicholls D. C., Kewley L. J., Vogt F. P. A., 2013, ApJS, 208, 10
- Dopita et al. (2016) Dopita M. A., Kewley L. J., Sutherland R. S., Nicholls D. C., 2016, Ap&SS, 361, 61
- Drory et al. (2015) Drory N., et al., 2015, AJ, 149, 77
- García-Lorenzo et al. (2015) García-Lorenzo B., et al., 2015, A&A, 573, A59
- Gunn et al. (2006) Gunn J. E., et al., 2006, AJ, 131, 2332
- Jungwiert, Combes, & Palouš (2001) Jungwiert B., Combes F., Palouš J., 2001, A&A, 376, 85
- Kannappan & Fabricant (2001) Kannappan S. J., Fabricant D. G., 2001, AJ, 121, 140
- Kashino et al. (2016) Kashino D., Renzini A., Silverman J. D., Daddi E., 2016, ApJ, 823, L24
- Katkov, Sil’chenko, & Afanasiev (2014) Katkov I. Y., Sil’chenko O. K., Afanasiev V. L., 2014, MNRAS, 438, 2798
- Kauffmann et al. (2003) Kauffmann G., et al., 2003, MNRAS, 346, 1055
- Kauffmann et al. (2003) Kauffmann G., et al., 2003, MNRAS, 341, 33
- Kauffmann et al. (2004) Kauffmann G., White S. D. M., Heckman T. M., Ménard B., Brinchmann J., Charlot S., Tremonti C., Brinkmann J., 2004, MNRAS, 353, 713
- Kewley & Dopita (2002) Kewley L. J., Dopita M. A., 2002, ApJS, 142, 35
- Kewley et al. (2001) Kewley L. J., Dopita M. A., Sutherland R. S., Heisler C. A., Trevena J., 2001, ApJ, 556, 121
- Kormendy & Sanders (1992) Kormendy J., Sanders D. B., 1992, ApJ, 390, L53
- Krajnović et al. (2006) Krajnović D., Cappellari M., de Zeeuw P. T., Copin Y., 2006, MNRAS, 366, 787
- Krajnović et al. (2011) Krajnović D., et al., 2011, MNRAS, 414, 2923
- Kuijken, Fisher, & Merrifield (1996) Kuijken K., Fisher D., Merrifield M. R., 1996, MNRAS, 283, 543
- Lagos et al. (2015) Lagos C. d. P., Padilla N. D., Davis T. A., Lacey C. G., Baugh C. M., Gonzalez-Perez V., Zwaan M. A., Contreras S., 2015, MNRAS, 448, 1271
- Law et al. (2015) Law D. R., et al., 2015, AJ, 150, 19
- Lia, Portinari, & Carraro (2002) Lia C., Portinari L., Carraro G., 2002, MNRAS, 330, 821
- Naab et al. (2014) Naab T., et al., 2014, MNRAS, 444, 3357
- Patton & Atfield (2008) Patton D. R., Atfield J. E., 2008, ApJ, 685, 235
- Pizzella et al. (2004) Pizzella A., Corsini E. M., Vega Beltrán J. C., Bertola F., 2004, A&A, 424, 447
- Pozzetti et al. (2007) Pozzetti L., et al., 2007, A&A, 474, 443
- Rubin (1994) Rubin V. C., 1994, AJ, 108, 456
- Sánchez et al. (2012) Sánchez S. F., et al., 2012, A&A, 538, A8
- Sarzi et al. (2006) Sarzi M., et al., 2006, MNRAS, 366, 1151
- Sérsic (1963) Sérsic J. L., 1963, BAAA, 6, 41
- Sérsic (1968) Sérsic J. L., 1968, adga.book,
- Schweizer & Seitzer (1998) Schweizer F., Seitzer P., 1998, AJ, 116, 2206
- Smee et al. (2013) Smee S. A., et al., 2013, AJ, 146, 32
- Springel, Di Matteo, & Hernquist (2005) Springel V., Di Matteo T., Hernquist L., 2005, ApJ, 620, L79
- Strauss et al. (2002) Strauss M. A., et al., 2002, AJ, 124, 1810
- Thakar & Ryden (1996) Thakar A. R., Ryden B. S., 1996, ApJ, 461, 55
- Thakar & Ryden (1998) Thakar A. R., Ryden B. S., 1998, ApJ, 506, 93
- Tremonti et al. (2004) Tremonti C. A., et al., 2004, ApJ, 613, 898
- van de Voort et al. (2015) van de Voort F., Davis T. A., Kereš D., Quataert E., Faucher-Giguère C.-A., Hopkins P. F., 2015, MNRAS, 451, 3269
- Veilleux, Kim, & Sanders (2002) Veilleux S., Kim D.-C., Sanders D. B., 2002, ApJS, 143, 315
- Verley et al. (2007) Verley S., et al., 2007, A&A, 472, 121
- Yan et al. (2016) Yan R., et al., 2016, AJ, 151, 8
- Yang et al. (2007) Yang X., Mo H. J., van den Bosch F. C., Pasquali A., Li C., Barden M., 2007, ApJ, 671, 153