Petroleum Refinery Multi-Antenna Propagation Measurements
Abstract
This paper presents the results of the first multi-antenna propagation measurement campaign to be conducted at an operating petroleum refining facility. The measurement equipment transmits pseudo-random noise test signals from two antennas at a 2.47 GHz carrier with a signal bandwidth of approximately 25 MHz. The measurement data is analyzed to extract path loss exponent, shadowing distribution, fading distribution, coherence bandwidth and antenna correlation. The results reveal an environment where large scale attenuation is relatively mild, fading is severe and good performance is expected from both antenna and frequency diversity.
I Introduction
Petroleum refining facilities are an important potential growth area for wireless technology. Refining facilities have made extensive use of wired data networks for over 35 years [1] and some refineries now have over 20,000 networked sensors and actuators [2]. There is also clear economic incentive for petroleum operators to move to wireless links. The metal safety shielding for wired cables in refineries can cost between $200 and $2,000 per foot [3]. Replacing these wired links with wireless would eliminate this cost.

One barrier to wireless adoption is our lack of understanding of wireless propagation within a refinery. Wireless will mainly be used to connect outdoor sensors and actuators attached to pipes and vessels in an environment similar to Fig. 1. This unique environment has arguably the greatest concentration of metallic scattering objects found anywhere. To date, industrial propagation measurement studies have focused on the manufacturing and factory environment [4, 5, 6, 7, 8, 9, 10, 11, 12]. However, the indoor factory environment is clearly very different than Fig. 1. The only effort to date characterizing refinery propagation is [13] which presents a modified path loss model based on classifying the physical environment into different categories. This model is verified using average received power measurements collected using wireless modems but the results are limited to path loss only.
This paper presents the first multi-antenna propagation measurement campaign to be conducted at an operating gas refinery that captures both large and small scale channel statistics. Sections II and III discuss the measurement equipment and environment, respectively. Section IV presents the methods used to analyze the data. Results are presented in Section V with concluding remarks made in Section VI.
II Equipment
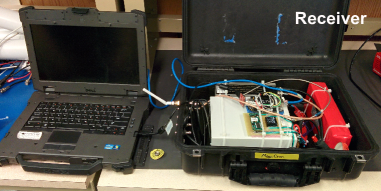
The measurement transmitter, shown in Fig. 2, transmits different time offsets of the same 25 Mchip/sec maximal length chip pseudo-random noise (PN) sequence [14] from two PCTEL MHO24004NM dipole antennas [15]. Antenna separation is approximately 16 cm. The two offset sequences are denoted and . The signals are transmitted at 6 dBm equivalent isotropically radiated power (EIRP) at a carrier frequency of 2.4724 GHz. The measurement receiver correlates the received signal with and in real time. The correlation is performed over 100,000 chips so that a MISO channel impulse response is captured on a laptop every 4 ms for a measurement capture rate of 250 Hz. The transmitter and receiver are synchronized in time and frequency using SIM940 rubidium clock references [16].
Due to the potential of explosive vapors in the air, all electrical equipment used near petroleum refinery equipment must meet the Class 1/Division 1 (C1/D1) standard which specifies all equipment must be shielded to prevent acting as an ignition source [17]. The transmit unit in Fig. 2 is contained in a C1/D1 compliant enclosure.

III Refinery Environment
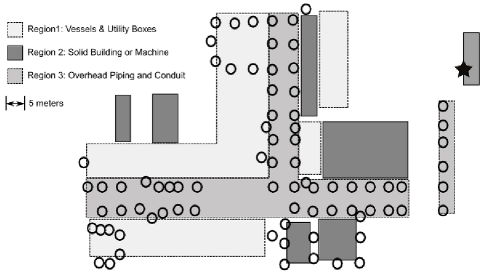
The measurements were conducted at a Shell Canada gas refinery and a simplified map of the measurement area is shown in Fig. 3. The environment consists of three regions: areas with tall vessels (10 m to 30 m in height) and piping similar to Fig. 1, solid metallic buildings or equipment that were opaque to radio signals and roadways covered by overhead piping and conduit approximately 2.5 m in the air. The measurements characterize propagation conditions between 80 different candidate sensor/actuator locations, indicated by the black circles, and a central building housing the refinery process control hardware, indicated by the star.
At each sensor/actuator location, the C1/D1 compliant transmitter was held so the antennas were approximately 1.25 m from the ground. During the measurement, the antennas were moved in a grid approximately 0.5 m 0.5 m to capture local spatial variation. The receiver was located outside the C1/D1 zone and connected to a single MHO24004NM dipole mounted 15 m in the air on the outside of the central process control building.
IV Data Analysis
The impulse response of the channel between transmit antenna and the receiver is represented by matrix where is the number of channel impulse responses captured and is the number of discrete channel taps. The element at row and column of is denoted .
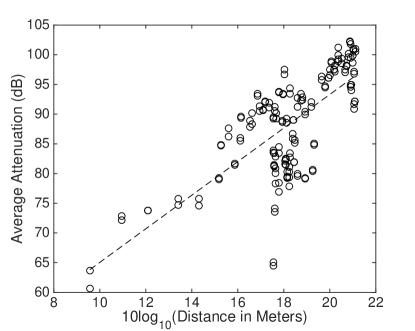
To determine large scale channel effects, an average attenuation is calculated for measurement location by averaging the signal received from antenna i according to . Unlike [13], large scale propagation is analyzed using a standard path loss and shadowing model. The path loss exponent is the slope of a best fit line on a log-log plot of attenuation versus distance and the shadowing values are the amount that each attenuation point deviates from that line [11].
The power delay profile (PDP) of the channel is determined by averaging the power of along the axis. The PDP is then used to calculate an RMS delay spread, , for each measurement as described in [11]. The coherence bandwidth of the channel is then defined as [11].
To analyze small scale fading statistics, each measurement for each location is normalized to have unit average power along the axis. The channel responses are then transformed into the frequency domain by taking the discrete Fourier transform of each along index . Let denote the transformed impulse response where is the discrete frequency index and the definitions of and are unchanged. The channel frequency response matrix is defined as , where is the matrix element on the th row and th column.
The number of frequency response values with independent small scale fading is , where is the discrete coherence bandwidth of the channel and is the discrete bandwidth of the measurement signal. Since fading values are captured for each of these frequency points, this allows the creation of a fading vector for the th transmit antenna defined as .
Small scale fading severity is quantified using Ricean K-factor. Before K-factor is estimated, the Chi-square goodness-of-fit test [18] is applied to the fading vector to ensure its envelope variations can be accurate represented by the Ricean distribution. A significance level of 10% is used, meaning there is a 10% chance that measurements that are actually Ricean will be discarded. K-factor is estimated for all measurements satisfying the Chi-square test using the method of moments [19]. Antenna correlation is calculated by determining the correlation coefficient between and . A correlation value is calculated for all measurements, regardless of whether they satisfy the Ricean fit test.
V Results
The results of the large scale analysis are shown in Figs. 4 and 5. The slope of the best fit line in Fig. 4 yields a path loss exponent of 2.76 and shadowing standard deviation is 5.93 dB. While both the shadowing and path loss values seem low given the amount of clutter, it is important to remember the highly metallic nature of the environment. Since the majority of the scattering objects are metallic, reflection is the dominant propagation mechanism with less absorption and diffusion than occurs in other environments. On average, this results in a higher proportion of the transmit power reaching the receiver.
It is also clear from Fig. 5 that shadowing does not display the traditional log-normal distribution. A true log-normal distribution requires the power of the received signal to be the product of many random attenuation factors due to scatterers along the propagation path [20]. We note that a refinery has at least as many objects contributing to shadowing as the indoor wireless channel and that indoor shadowing is much closer to log-normal [21]. Therefore, we assume that the cause of the unusual shadowing distribution is not a lack of scattering events. Instead, the mostly metallic environment does not create a sufficiently random change in amplitude and phase during each scattering event for the product of those events to quickly approach a log-normal distribution.

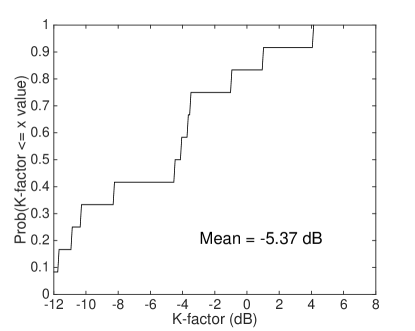
The CDF of the measurement K-factor values shown in Fig. 6 indicates very severe fading. With a mean K-factor of -5.37 dB, the fading is approximately Rayleigh. This is not surprising given the dense number of scattering objects surrounding the locations in Fig. 3. However, since the vast majority of refinery sensors and actuators are fixed to one location and none of the scattering objects move, Fig. 6 underscores that utilizing diversity techniques will be extremely important since a sensor in a deep fade cannot rely its motion or motion in the environment to improve its propagation conditions.
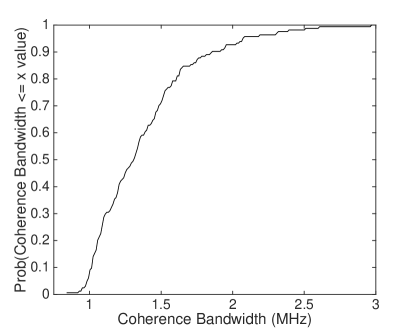
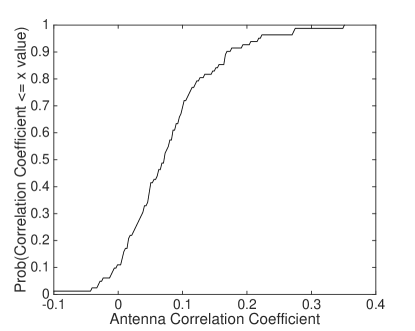
Fortunately, the measurements indicate that both antenna diversity and frequency diversity through channel hopping will be effective. Fig. 7 shows the CDF of the coherence bandwidth of the measured channels. A mean of 1.38 MHz corresponds to a mean RMS delay spread of 154 ns. ISA 100.11a is a representative industrial wireless network standard [22] that utilizes an 802.15.4 physical layer and makes extensive use of channel hopping. As the channels for this standard are separated by 5 MHz, this coherence bandwidth suggests that the channels will enjoy the independent fading necessary to make frequency hopping an effective fading mitigation option. Fig. 8 shows the CDF of the antenna fading correlation coefficient is very low with a mean value of 0.079. This means that multiple antennas will also be effective for those nodes where size and cost allow for them.
VI Conclusion
This paper has presented the first multi-antenna measurement campaign conducted at an operating petroleum refinery that captures both large and small scale channel statistics. The results reveal an environment where path loss and shadowing are milder than the number of obstacles would suggest due to the large number of reflecting metallic objects that are present. Fading is severe due to the large number of scatterers but low values for both coherence bandwidth and antenna correlation coefficient indicate that frequency and antenna diversity are both good options for mitigating this fading.
References
- [1] “Industrial Communication Technology Handbook” CRC Press, 2014
- [2] R.E. Young “Petroleum refining process control and real-time optimization” In IEEE Control Systems Magazine 26.6, 2006, pp. 73–83 DOI: 10.1109/MCS.2006.252833
- [3] Ian Johnstone, James Nicholson, Babar Shehzad and Jeff Slipp “Experiences from a Wireless Sensor Network Deployment in a Petroleum Environment” In Proceedings of the 2007 International Conference on Wireless Communications and Mobile Computing, IWCMC ’07 Honolulu, Hawaii, USA: ACM, 2007, pp. 382–387 DOI: 10.1145/1280940.1281022
- [4] J. Miranda et al. “Path loss exponent analysis in Wireless Sensor Networks: Experimental evaluation” In 2013 11th IEEE International Conference on Industrial Informatics (INDIN), 2013, pp. 54–58 DOI: 10.1109/INDIN.2013.6622857
- [5] J.F. Coll, J. Chilo and B. Slimane “Radio-Frequency Electromagnetic Characterization in Factory Infrastructures” In IEEE Transactions on Electromagnetic Compatibility 54.3, 2012, pp. 708 –711 DOI: 10.1109/TEMC.2012.2197753
- [6] Shuiping Luo, N. Polu, Zhizhang Chen and J. Slipp “RF channel modeling of a WSN testbed for industrial environment” In 2011 IEEE Radio and Wireless Symposium (RWS), 2011, pp. 375–378 DOI: 10.1109/RWS.2011.5725435
- [7] S. Kozlowski, R. Szumny, K. Kurek and J. Modelski “Statistical modelling of a wideband propagation channel in the factory environment” In European Conference on Wireless Technology (EuWiT 2008), 2008, pp. 190 –193
- [8] E. Tanghe et al. “The industrial indoor channel: large-scale and temporal fading at 900, 2400, and 5200 MHz” In IEEE Transactions on Wireless Communications 7.7, 2008, pp. 2740–2751 DOI: 10.1109/TWC.2008.070143
- [9] J. Kunisch and J. Pamp “Locally Coherent Ultra-Wideband Radio Channel Model for Sensor Networks in Industrial Environment” In 2006 IEEE International Conference on Ultra-Wideband, 2006, pp. 363–368 DOI: 10.1109/ICU.2006.281577
- [10] A. Miaoudakis, A. Lekkas, G. Kalivas and S. Koubias “Radio channel characterization in industrial environments and spread spectrum modem performance” In 10th IEEE Conference on Emerging Technologies and Factory Automation (ETFA 2005). 1, 2005 DOI: 10.1109/ETFA.2005.1612506
- [11] T.S. Rappaport, S.Y. Seidel and K. Takamizawa “Statistical channel impulse response models for factory and open plan building radio communicate system design” In IEEE Transactions on Communications 39.5, 1991, pp. 794 –807 DOI: 10.1109/26.87142
- [12] P. Yegani and C.D. McGillem “A statistical model for the factory radio channel” In IEEE Transactions on Communications 39.10, 1991, pp. 1445 –1454 DOI: 10.1109/26.103039
- [13] S. Savazzi, S. Guardiano and U. Spagnolini “Wireless channel characterization and modeling in oil and gas refinery plants” In 2013 IEEE International Conference on Industrial Technology (ICIT), 2013, pp. 1546–1551 DOI: 10.1109/ICIT.2013.6505902
- [14] J. G. Proakis “Digital Communications” McGraw Hill, 2001
- [15] PCTEL Broadband Technology Group “White MAXRAD High Performance Omnidirectional Antennas”, www.winncom.com, Accessed: July 28, 2015
- [16] Stanford Research Systems “SIM 940 Rubidium Frequency Standard” Revision 1.3, 2007
- [17] Emerson Process Management “Hazardous Area Classifications and Protections”, Product Bulletin D103222X012, 2012
- [18] W. C. Navidi “Statistics for Engineers and Scientists” McGraw-Hill, 2006
- [19] L.J. Greenstein, D.G. Michelson and V. Erceg “Moment-method estimation of the Ricean K-factor” In IEEE Communications Letters 3.6, 1999, pp. 175–176 DOI: 10.1109/4234.769521
- [20] H. Suzuki “A Statistical Model for Urban Radio Propogation” In IEEE Transactions on Communications 25.7, 1977, pp. 673–680
- [21] A. Hong et al. “Experimental Evaluation of Correlation Properties of Large Scale Parameters in an Indoor LOS Environment” In 2006 3rd International Symposium on Wireless Communication Systems (ISWCS ’06), 2006, pp. 55–59
- [22] American National Standard “ANSI/ISA-100.11a-2011 Wireless systems for industrial automation: Process control and related applications”, 2011