ALMA observations of massive molecular gas filaments encasing radio bubbles in the Phoenix cluster
Abstract
We report new ALMA observations of the CO(3-2) line emission from the molecular gas reservoir in the central galaxy of the Phoenix cluster. The cold molecular gas is fuelling a vigorous starburst at a rate of and powerful black hole activity in the form of both intense quasar radiation and radio jets. The radio jets have inflated huge bubbles filled with relativistic plasma into the hot, X-ray atmospheres surrounding the host galaxy. The ALMA observations show that extended filaments of molecular gas, each long with a mass of several billion solar masses, are located along the peripheries of the radio bubbles. The smooth velocity gradients and narrow line widths along each filament reveal massive, ordered molecular gas flows around each bubble, which are inconsistent with gravitational free-fall. The molecular clouds have been lifted directly by the radio bubbles, or formed via thermal instabilities induced in low entropy gas lifted in the updraft of the bubbles. These new data provide compelling evidence for close coupling between the radio bubbles and the cold gas, which is essential to explain the self-regulation of feedback. The very feedback mechanism that heats hot atmospheres and suppresses star formation may also paradoxically stimulate production of the cold gas required to sustain feedback in massive galaxies.
1 Introduction
The energy output by active galactic nuclei (AGN) has long been recognized as sufficient to unbind the interstellar medium from even the most massive host galaxies (Silk & Rees 1998). Recent observations of ionized and molecular gas outflows driven by intense radiation or radio jet activity from the central AGN show that this energy can be efficiently coupled to the surrounding interstellar gas (eg. Morganti et al. 2005; Nesvadba et al. 2006; Feruglio et al. 2010; Rupke & Veilleux 2011; Alatalo et al. 2011; Dasyra & Combes 2011; Morganti et al. 2015). Chandra X-ray observations of the hot atmospheres surrounding giant elliptical galaxies and central cluster galaxies have also revealed huge cavities where the hot gas has been displaced by expanding radio bubbles inflated by radio jets (McNamara et al. 2000; Fabian et al. 2000, 2006). Known as AGN feedback, these energetic outbursts are therefore observed to couple effectively to the cold and warm interstellar gas and the hot gas atmospheres surrounding massive galaxies. AGN feedback is an essential mechanism in galaxy formation that powers gas outflows to truncate massive galaxy growth. This process is thought to produce the observed evolution of galaxies from gas-rich, star forming systems to ‘red and dead’ ellipticals and imprint the observed coevolution of massive galaxies and supermassive black holes (SMBHs; Magorrian et al. 1998; Croton et al. 2006; Bower et al. 2006).
However, the details of how a SMBH can regulate the growth of its host environment over many orders of magnitude in spatial scale are still poorly understood. In the most massive galaxies at the centres of cool core galaxy clusters, the radiative cooling time of the hot gas atmosphere can fall below a Gyr and heat input from the AGN must be distributed throughout the central to prevent the formation of a cooling flow (eg. Edge et al. 1992; Peres et al. 1998; Voigt & Fabian 2004). Without this energy input, gas would cool unimpeded from the cluster atmosphere and produce at least an order of magnitude more molecular gas and star formation than is observed in central cluster galaxies (Johnstone et al. 1987; Edge 2001; Salomé & Combes 2003). Radio jets powered by the central AGN inflate buoyant radio bubbles and drive shocks and sound waves into the intracluster medium to produce distributed heating throughout the cluster core (for reviews see McNamara & Nulsen 2007, 2012; Fabian 2012). X-ray studies of large samples of galaxy groups and clusters show that this energy input is sufficient to replace the majority of the radiative losses from the cluster gas on large scales (Bîrzan et al. 2004; Dunn & Fabian 2006; Rafferty et al. 2006). The heating rate supplied by the AGN is also observed to be closely correlated with the cooling rate of the cluster atmosphere, which implies a highly effective feedback loop operating over this huge range of spatial scales. A few per cent of the most rapidly cooling cluster gas does cool to low temperatures and likely feeds the observed cold molecular gas reservoirs and star formation in the central galaxy. Although the level of gas cooling falls far below the predictions of cooling flows, prompt accretion of this residual component is likely required to link the large scale cooling rate to the energy output of the AGN in an efficient feedback loop.
Observations of ionized and molecular gas at the centres of clusters have revealed cool gas filaments extending radially from the galaxy centre towards radio bubbles inflated by the jet (Fabian et al. 2003; Salomé et al. 2006, 2008; Hatch et al. 2006; Lim et al. 2008). In the Perseus cluster, the velocity structure of the H-emitting filaments, which are coincident with detections of CO emission from the IRAM telescope, traces streamlines underneath a buoyantly rising radio bubble (Salomé et al. 2006, 2011). ALMA observations of molecular gas at the centres of clusters (Russell et al. 2014, 2016; McNamara et al. 2014; David et al. 2014; Tremblay et al. 2016; Vantyghem et al. 2016) have shown cold gas filaments extending along the trajectories of radio bubbles. The molecular clouds have either been lifted directly by the bubbles or cooled in situ from warmer, thermally unstable gas lifted in their wakes. The velocities of the molecular clouds are remarkably slow compared to the stellar velocity dispersion in these massive galaxies and lie well below the galaxy’s escape velocity. The molecular gas will likely fall back towards the galaxy centre and fuel both star formation and future AGN activity.
Here we present new ALMA observations of the CO(3-2) emission from the molecular gas in the central galaxy of the Phoenix cluster. Discovered with the South Pole Telescope, the Phoenix cluster (SPT-CLJ2344-4243), at redshift , is the most luminous X-ray cluster known (Williamson et al. 2011; McDonald et al. 2012), and the starburst hosted by its central galaxy is amongst the largest found in any galaxy below redshift 1. The star formation is observed in bright filaments stretching beyond , sustained by a 20 billion solar mass reservoir of molecular gas (McDonald et al. 2013a, 2014). The stellar mass of the massive central galaxy is (McDonald et al. 2012, 2013a) and it hosts an unusual central supermassive black hole that is powering both intense radiation and relativistic jets. Observations show these to be distinct modes of AGN feedback. The black hole may be in the process of transitioning from a radiatively powerful quasar to a radio galaxy (eg. Churazov et al. 2005; Russell et al. 2013; Hlavacek-Larrondo et al. 2013) whose mechanical power output of is among the largest measured (eg. Hlavacek-Larrondo et al. 2015; McDonald et al. 2015). The Phoenix cluster therefore hosts an extreme example of this common mechanism in galaxy evolution. Both the powerful black hole activity and the vigorous starburst are fuelled by the massive cold molecular gas reservoir, whose structure can now be resolved with ALMA to understand how these processes are regulated.
2 Data reduction

The brightest cluster galaxy (BCG) in the Phoenix cluster was observed by ALMA on 15 and 16 June 2014 (Cycle 2, ID 2013.1.01302.S; PI McDonald) simultaneously covering the CO(3-2) line at and the sub-mm continuum emission in three additional basebands at 219.5, 230.5 and . The single pointing observations were centred on the nucleus with a field of view of . The total time on source was split into nine observations and interspersed with observations of the phase calibrator J2357-5311. This bright quasar was also observed for bandpass and flux calibration. The observations utilised 35 antennas with baselines of . The frequency division correlator mode was used for the spectral line observation with a bandwidth and frequency resolution of . The velocity channels were binned to a resolution of for the subsequent analysis. Based on optical spectroscopy of the central galaxy, we use a velocity center at a redshift , which also corresponds to the velocity center of the molecular emission peak. We note that optical IFU observations have revealed a very dynamic environment in the ionized gas and bulk motions could produce a systematic offset in the gas velocities with respect to the gravitational potential of the BCG (McDonald et al. 2014).
The observations were calibrated in casa version 4.3.1 (McMullin et al. 2007) using the ALMA pipeline reduction scripts. Continuum-subtracted data cubes were generated using clean and uvcontsub. Additional self-calibration did not produce significant improvement in the image quality. Different weightings were explored to determine the optimum for imaging. Natural weighting detected the extended filaments at the highest signal-to-noise but no major differences could be discerned between the various weightings due to the good uv coverage. The final data cube used natural weighting and had a synthesized beam of with P.A. . The rms noise in the line-free channels was at CO(3-2) for channels. An image of the continuum emission with an rms noise of was generated by combining spectral channels from all four basebands that were free of line emission. The continuum image was produced using natural weighting and the synthesized beam was with P.A. .
| Region | /dof | Component | Integrated intensity | Peak | FWHM | Velocity shift |
|---|---|---|---|---|---|---|
| (Jy km/s) | (mJy) | (km/s) | (km/s) | |||
| Total | 198/141 | 1 | ||||
| 2 | ||||||
| 3 |
3 Results
3.1 Molecular gas morphology
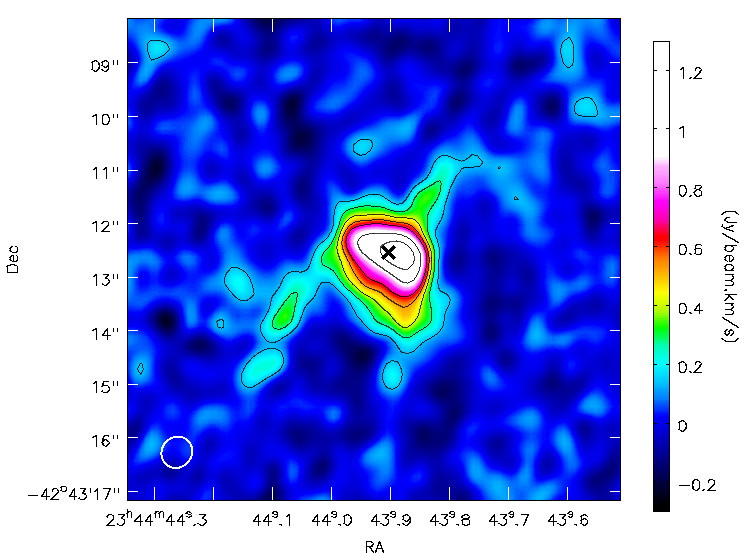
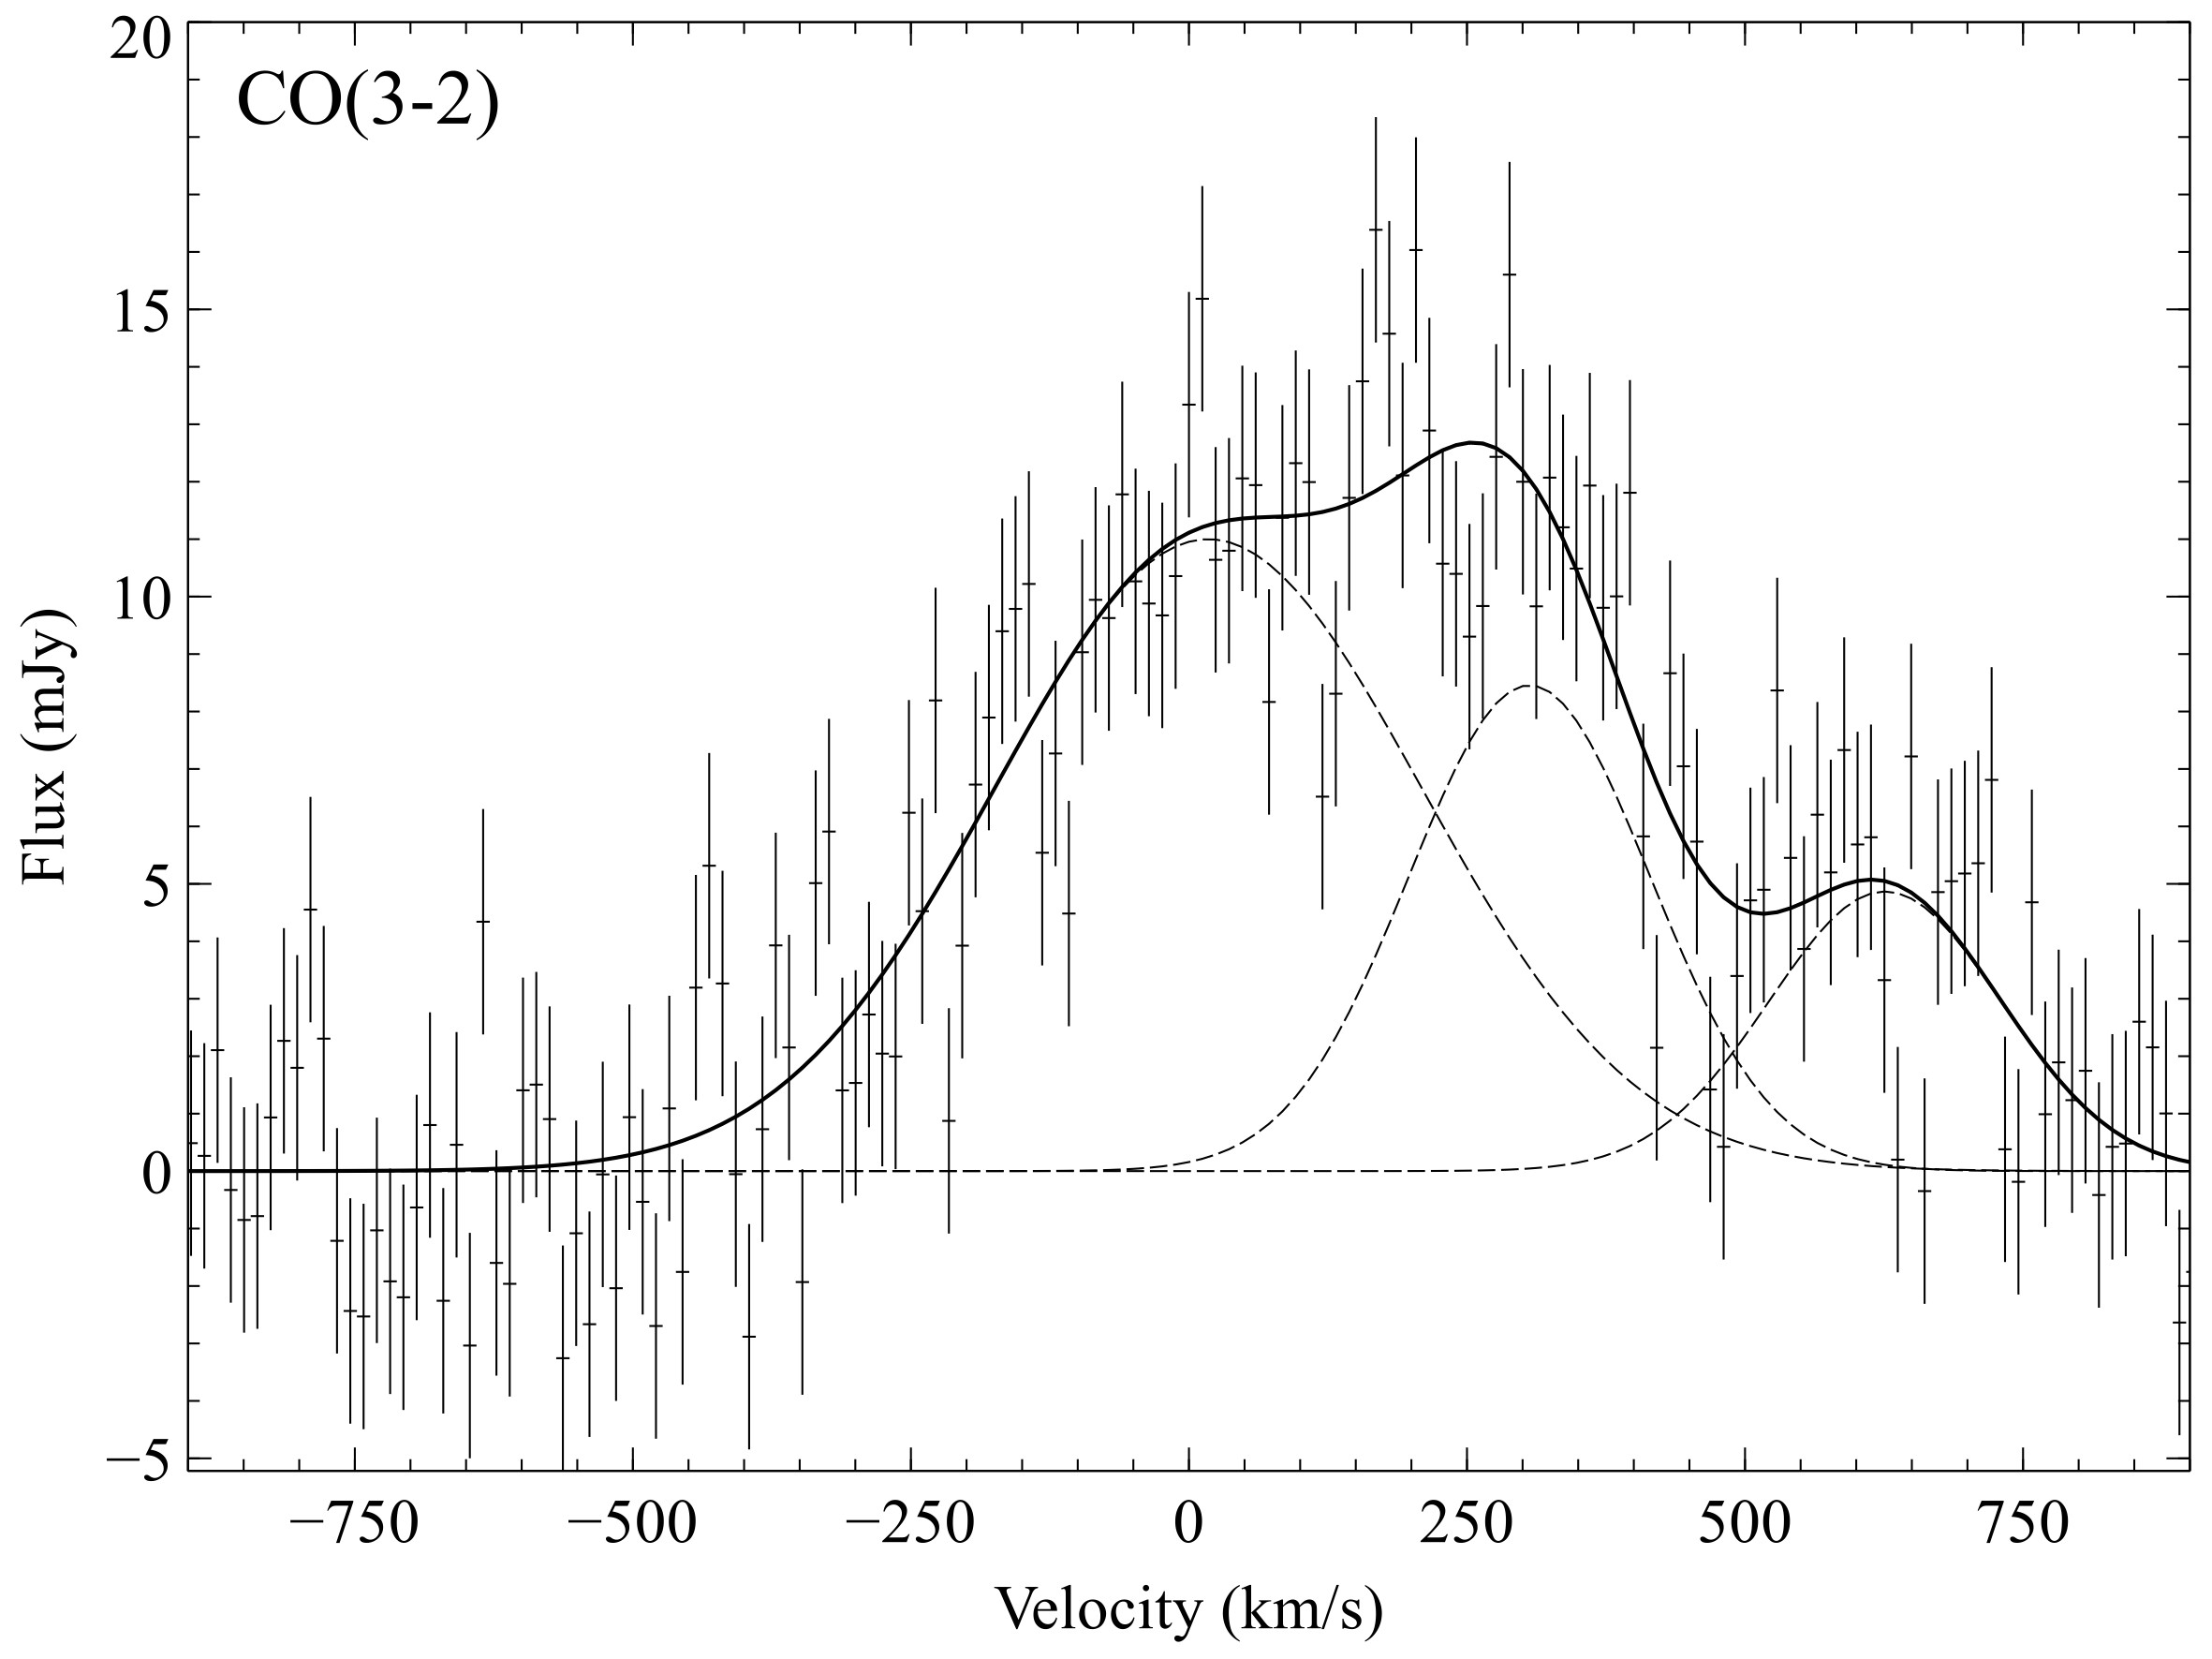
The CO(3-2) molecular line emission peaks at the galaxy center, offset by to the W of the radio nucleus (Fig. 1 left). The central molecular gas peak extends along a NE to SW axis across the nucleus. Two filaments extend () to the NW and SE of the central emission peak. The emission also extends for several arcsec as a broader structure to the S of the nucleus. Fig. 1 (right) shows the continuum-subtracted total CO(3-2) spectral line profile extracted from a region centred on the nucleus and covering all extended emission. The line profile is very broad, covering , and consists of multiple velocity components. The total spectrum was fitted with three Gaussian components using the package mpfit (Markwardt 2009). The brightest velocity component is centred on the galaxy’s systemic velocity and has the largest FWHM of . At least two additional velocity components are redshifted to and and have significantly lower FWHMs of . The best fit results, corrected for primary beam response and instrumental broadening, are shown in Table 1.
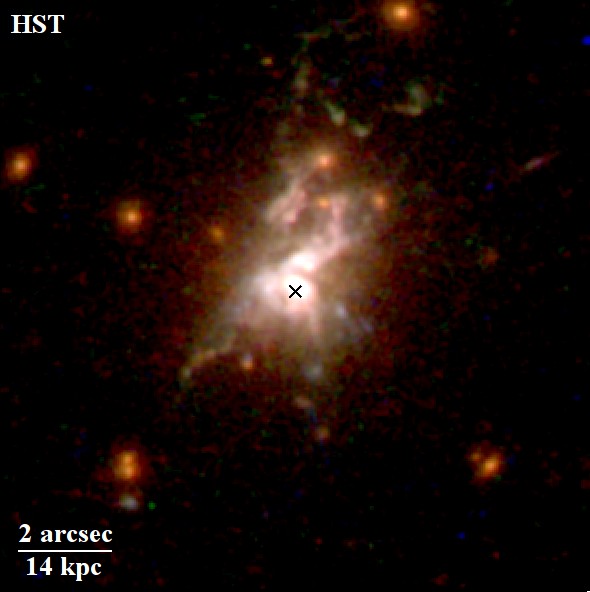
The most luminous redshifted component covering the velocities from to corresponds to the most extended emission (Fig. 2). The remaining molecular gas at and lies within of the nucleus. Fig. 2 clearly shows that this velocity component traces the most extended emission from the NW and SE filaments and the third filament to the S. The filament widths are unresolved and may consist of many individual strands (Fabian et al. 2008). Each filament coincides with regions of bright ionized gas emission, dust and filamentary star formation previously detected in optical and UV observations (Fig. 2 right; McDonald et al. 2013a, 2014).
The filaments are draped around the rims of two large X-ray cavities (Fig. 2, left) detected in deep Chandra X-ray observations (McDonald et al. 2015). These cavities are each across and centered at a radius of and were created as radio bubbles inflated by the AGN displaced the cluster gas. The SE and S filaments encase the inner half of the southern X-ray cavity, which is larger and has the greater cavity power of the two. The NW filament lies along the W edge of the northern X-ray cavity but no significant counterpart is detected along the E edge. The filaments may form part of a patchy thin shell surrounding the inner half of each bubble. This molecular shell would be brightest at the largest projected distance around the bubble, which could explain the remarkable coincidence between the filaments and the bubble edges and the limited amount of molecular gas projected across either bubble.
The total CO(3-2) intensity of is almost a factor of 2 greater than the integrated intensity measured by the SMA of (McDonald et al. 2014). The SMA observation was taken at very low elevation, is only modestly significant and likely affected by a substantial continuum subtraction uncertainty, making it particularly difficult to calibrate. The measured FWHM of from the SMA observation is also significantly less than determined the FWHM of for a single component spectral fit to the ALMA total spectrum. This discrepancy in the total CO(3-2) flux could therefore be due to uncertainty in the SMA continuum subtraction.
3.2 Velocity structure
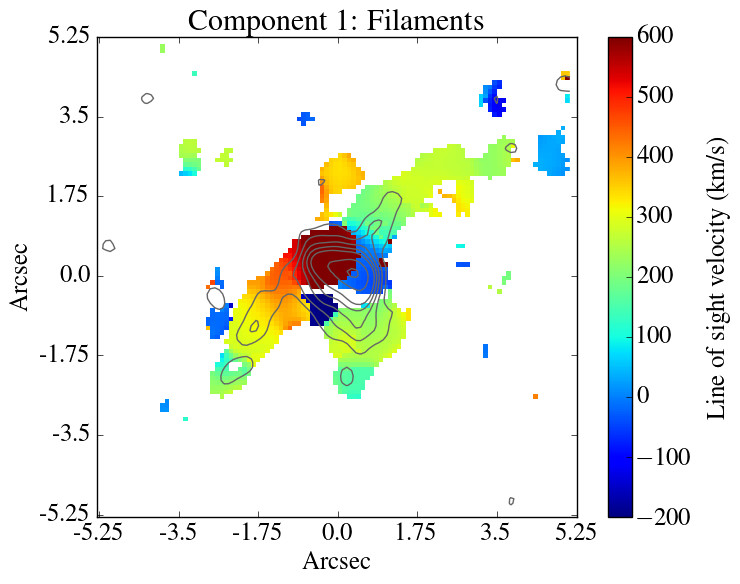
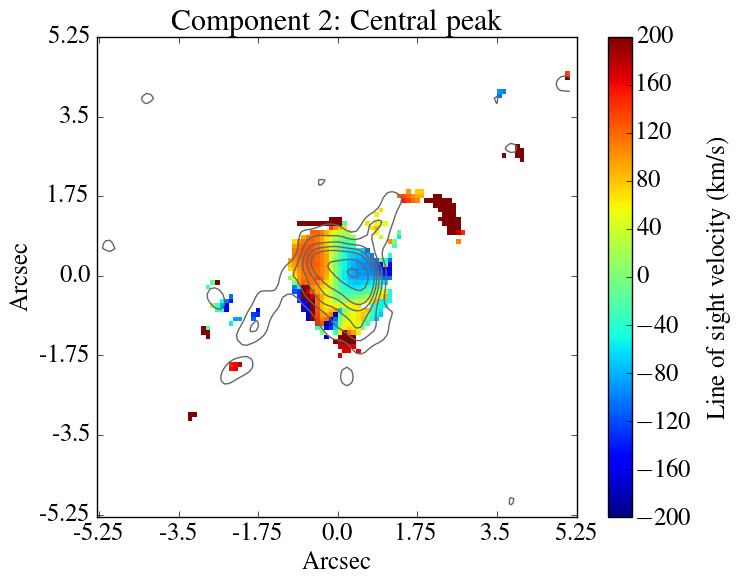
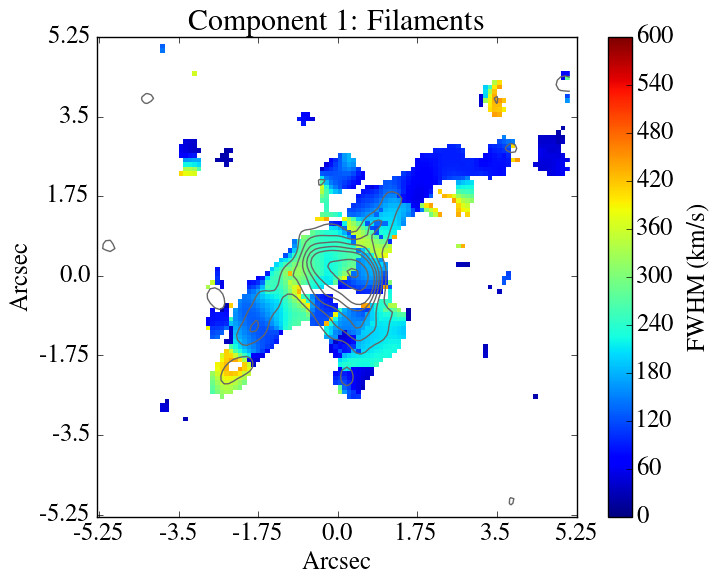
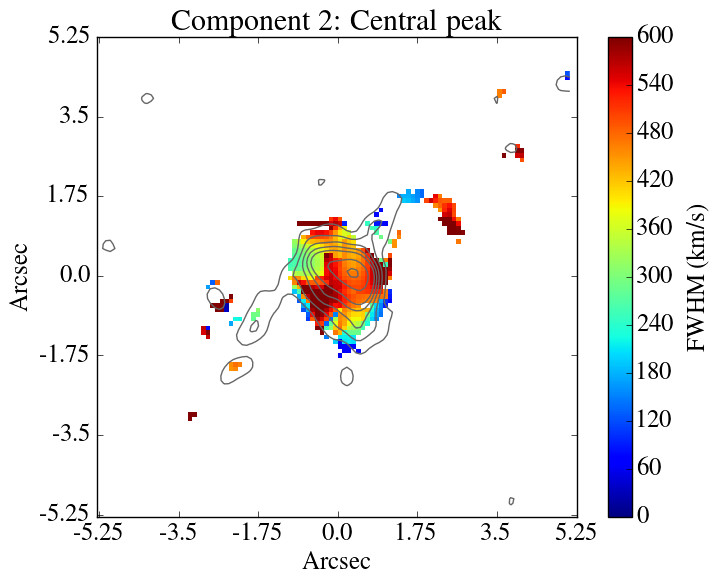
The velocity structure of the molecular gas was mapped by extracting spectra in synthesized beam-sized regions each centred on each spatial pixel in the ALMA cube. The extracted spectra were fitted with mpfit using one, two or three Gaussian components. We required at least significance for the detection of an emission line in each region based on 1000 Monte Carlo simulations of the spectrum. Figs. 3 and 4 show the maps of the line centre and FWHM that were generated for each best-fit velocity component. These maps show two distinct components in the molecular gas: the extended filaments characterized by smooth velocity gradients and narrow FWHM and a compact central gas peak with much broader FWHM.
All three extended filaments have ordered velocity gradients along their lengths and low FWHM decreasing to at the largest radii in the NW and S filaments. The smooth velocity gradients and narrow FWHM over the length of each extended structure reveal a steady, ordered flow of molecular gas around and beneath the radio bubbles. The velocities at the furthest extent of each filament are similar at and increase towards the galaxy nucleus with the highest velocities at the smallest radii. In the SE filament, the velocity increases with decreasing radius to to the E of the nucleus. The steady velocity gradient suggests that the SE filament forms a continuous structure to the galaxy centre. The velocity gradient along the NW filament, from at radius () to at the nucleus, also indicates a separate, continuous structure. The S filament is fainter, shorter and wider and has a shallower velocity gradient. The FWHM is below at radius () but quickly broadens to with decreasing radius indicating that the S filament is disrupted towards the galaxy centre. The SE and NW filaments meet in projection at the nucleus. The velocity differential is large across the nucleus at to with no evidence for disruption at this resolution and no significant increase in FWHM of the velocity components for each filament. Collisions between the gas clouds in these two ordered filaments may produce a sharp transition in velocity to the second observed velocity component.
The central compact molecular gas peak forms a separate velocity structure from the extended filaments with a much higher FWHM and a E-W velocity gradient from to across the nucleus (Fig. 3). The velocity gradient across the nucleus appears to lie perpendicular to the velocity gradients along the NW and SE filaments. The FWHM peaks along the projected intersection of the two filaments. The increase in FWHM could indicate variation in the orientation of the filaments at the galaxy centre but, although it could be a contributing effect, this would require a reversal of the velocity gradient in a similar length of filament oriented along the line of sight at the galaxy centre. It is more likely that the FWHM is intrinsically higher in the central molecular gas peak. The E-W velocity gradient centred on the nucleus is consistent with ordered motion or rotation about the AGN within a radius of () but higher spatial resolution observations are required to determine if this corresponds to a disk.
The strong velocity gradients in the molecular gas are comparable to those observed for the warm ionized gas (McDonald et al. 2014). The ionized gas, traced by the [o iii]4959, 5007 doublet, shows a relatively smooth gradient from to the SE of the nucleus decreasing to to the NW. The velocity is at the peak of the [o ii] emission around the nucleus. The low velocities of to at the centre correspond to the bright central peak and are consistent with the gas velocities around the nucleus in the molecular gas. The high velocities in the ionized gas to the SE and NW are comparable to the bright, innermost regions of the SE and NW filaments. Although the ionized gas velocities appear to decrease at larger radii, which corresponds to the outer regions of the filaments, the emission is faint and extends beyond the field of view (McDonald et al. 2014).
The fraction of the total CO(3-2) flux in each filament was estimated by using the velocity structure to separate the filaments from the compact central emission peak. Using a spectrum extracted from a region covering the central peak, we determined the integrated flux in each filament based on the best-fit model for their distinct velocity structures. This was added to the flux determined from conservative regions covering only the extended structure of each filament. The low velocity structure at large radius in each filament could not be easily spectrally separated from the low velocities of the gas across the nucleus. Therefore it was not possible to use a purely spectral or purely spatial separation of the extended and compact structures. From this hybrid technique, we estimate that the SE filament contains of the total flux and the NW filament contains . The extent of the S filament is particularly uncertain. Based on the assumption that all the emission to the S of the nucleus with a FWHM below is associated with the S filament then it contains of the total flux.
In summary, roughly half of the total flux lies in three extended filaments which have ordered velocity gradients along their lengths and low FWHM. The velocities at the furthest extent of each filament are similar at and increase towards the galaxy nucleus with the highest velocities at the smallest radii. The central compact emission peak forms a separate velocity structure with a much higher FWHM and a velocity gradient lying perpendicular to the filaments from to across the nucleus. The velocity structure is consistent with ordered motion around the nucleus but higher spatial resolution observations would be required to determine if this is a disk.
3.3 Molecular gas mass
By assuming a CO-to-H2 conversion factor and a line ratio CO(3-2)/CO(1-0) (Edge 2001; Russell et al. 2016), the total molecular gas mass can be inferred from the integrated CO intensity:
| (1) |
where is the luminosity distance, is the redshift of the BCG and is the integrated CO(1-0) intensity. However, the molecular gas mass is particularly sensitive to the CO-to-H2 conversion factor, which is quite uncertain and not expected or observed to be universal (see Bolatto et al. 2013 for a review). Previous studies of BCGs in cool core clusters (Edge 2001; Salomé & Combes 2003; Russell et al. 2014; McNamara et al. 2014) have used the Galactic value (Solomon et al. 1987; Solomon & Vanden Bout 2005). However in intense starburst galaxies and ULIRGs such as the BCG in the Phoenix cluster, the molecular gas exists at higher densities and temperatures producing an extended warm gas phase with a much higher column density than a quiescent system. Under these conditions, the CO emission is more luminous and should be lowered (eg. Downes et al. 1993; Iono et al. 2007; Aravena et al. 2016). The high star formation density of within the central (McDonald et al. 2014), warm dust temperature of and large FWHM in the galaxy center suggest that a lower is appropriate for the central molecular gas structure and potentially also for the filaments. We therefore assume (Downes & Solomon 1998) but note that Chandra observations measure subsolar metallicity of in the surrounding ICM. Low metal abundance likely will boost over our assumed value, unless the cool gas in the filaments has an increased metallicity over the ambient medium (eg. Panagoulia et al. 2013).
For the integrated CO(3-2) intensity of , the total molecular gas mass is . As discussed in section 3.1, the integrated intensity is almost a factor of two higher than that found by the earlier SMA observation (McDonald et al. 2014), which is likely due to uncertainty in the continuum subtraction for the SMA result. Note also that McDonald et al. (2014) assume a line ratio CO(3-2)/CO(1-0) , which produces a similar molecular gas mass despite the difference in integrated intensity. The central molecular gas peak in the Phoenix cluster accounts for of the total CO flux and therefore has a molecular gas mass of . The SE, NW and S filaments contain , and , respectively. The uncertainty on the factor increases the uncertainty on the molecular gas masses to roughly a factor of a few. This estimate of the molecular gas mass also appears low when compared with correlations with the H luminosity (Salomé & Combes 2003) and the dust-to-gas ratio of (McDonald et al. 2012). However, our conclusions are not qualitatively altered by the estimated uncertainty.
3.4 AGN continuum
An unresolved central continuum source was detected at RA 23:44:43.902, Dec -42:43:12.53 with a flux of at . The position and flux are consistent with the SMA continuum detection at (McDonald et al. 2014111Note that the lower SMA continuum flux given in McDonald et al. 2014 is a typographical error.). The ALMA continuum image does not reveal any extended emission due to star formation. The continuum source is coincident with radio and hard X-ray point source emission. Low frequency radio observations from the SUMSS and ATCA archives suggest a synchrotron continuum slope of and therefore we expect synchrotron emission from the AGN of at (McDonald et al. 2014). The observed point source flux is therefore consistent with a combination of synchrotron emission and dust emission from the SMBH’s immediate environment.
4 Discussion
In the central galaxy of the Phoenix cluster, massive molecular gas filaments form dense, cold rims around both of the inner X-ray cavities, where hot gas has been displaced by radio jet activity. These observations now clearly demonstrate that the structure of the largest molecular gas reservoirs located in the most massive galaxies is shaped by the expansion and trajectory of the radio bubbles. Previous sub-mm observations of brightest cluster galaxies have indicated tentative correlations between X-ray cavity axes and the orientations of molecular gas filaments, including ALMA observations of Abell 1835 and PKS 0745-191 (McNamara et al. 2014; Russell et al. 2016). IRAM observations of the nearby Perseus cluster detected molecular gas coincident with regions of the complex optical emission line nebula, including several filaments of ionized gas that extend toward radio bubbles (Salomé et al. 2006; Lim et al. 2008; Salomé et al. 2011). These observed direct interactions between the cold gas, which fuels the starburst and black hole activity, and the jet-blown bubbles are essential to explain the observed close regulation of AGN feedback.
The total molecular gas mass of (section 3.3) in the central galaxy of the Phoenix cluster is substantially higher than that typically found in early-type galaxies (Young et al. 2011). BCGs situated in dense cluster atmospheres with short radiative cooling times are known to preferentially host cold molecular gas in excess of several (Edge 2001; Salomé & Combes 2003). The molecular gas structures are observed to be coincident with bright optical emission line nebulae and the most rapidly cooling X-ray gas (Fabian et al. 2003; Salomé et al. 2006). In the Phoenix cluster, the molecular filaments are similarly coincident with the brightest, soft X-ray emission, ionized gas plumes and dust regions. The X-ray gas cooling rate measured with XMM-Newton RGS of (Tozzi et al. 2015) is consistent with the observed mass of molecular gas originating in cooling of the hot atmosphere over roughly the buoyant rise time of the inner and outer bubbles in the Phoenix cluster (, see also Russell et al. 2014; McNamara et al. 2014). An alternative merger origin for such a substantial mass of molecular gas would require multiple gas-rich donor galaxies, which are rare at the centres of rich clusters (eg. Young et al. 2011). It is more likely that the molecular gas originated in gas cooling from the surrounding hot atmosphere.
The molecular gas clouds have either been subsequently lifted into extended filaments by the expanding radio bubbles or formed in filaments via thermal instabilities induced in uplifted low entropy X-ray gas. Radio jets have been observed to drive significant outflows of molecular gas from galaxies (Morganti et al. 2005; Dasyra & Combes 2012; Morganti et al. 2015). For the Phoenix cluster, McDonald et al. (2015) estimated the mechanical jet energy from the work done displacing the hot gas against the surrounding pressure. By measuring the size of the inner cavities and the local gas pressure, the cavity enthalpy was estimated as . Only a few per cent of this mechanical energy could supply the observed kinetic energy of the molecular filaments. However, the coupling mechanism between dense, molecular clouds and radio bubbles is unclear and this mechanism would have to be extremely efficient to lift 50% of the cold gas into extended filaments. Volume-filling X-ray gas would be much easier to lift.
Outflows of hot X-ray gas, enriched with metals by stellar activity in the central galaxy, are observed in galaxy clusters as plumes of high metallicity gas lifted along the jet axis for tens to hundreds of kpc (Simionescu et al. 2008; Kirkpatrick et al. 2009). Low entropy X-ray gas should become thermally unstable when lifted to a radius where its cooling time approaches the infall time (Nulsen 1986; Pizzolato & Soker 2005; McNamara et al. 2014, 2016). Theoretical models further indicate that lifting low entropy gas in the updraft of rising radio bubbles stimulates condensation of molecular clouds (Li & Bryan 2014; Brighenti et al. 2015; Voit et al. 2016). Therefore, an infall time that is significantly longer than the free-fall time, will enhance thermal instabilities and promote the formation of molecular gas clouds in the bubbles’ wakes (McNamara et al. 2016).
The inner radio bubbles in the Phoenix cluster displace and therefore, by Archimedes’ principle, could lift the of gas required to supply the molecular gas in the filaments. The similarity in the molecular gas velocity at large radius, and in the velocity gradients beneath bubbles with apparently different dimensions, supports this scenario where the molecular gas cools and decouples from the hot atmosphere and falls toward the galaxy center. Whilst the velocity range covers at the galaxy center, the molecular gas velocities at the outer tip of each filament, separated by , are consistent with . Such similar velocities suggest that this remote molecular gas could be coupled to the hot atmosphere (Hitomi Collaboration et al. 2016), which is moving relative to the BCG. Bulk motion of the cluster gas could also explain the bubble asymmetry. The smoothly increasing gas velocities with decreasing radius along the NW and SE filaments indicate massive gas flows underneath the radio bubbles. Although the velocity structure cannot cleanly distinguish between inflow and outflow, the remarkable similarity in the molecular gas velocities at large radii suggests the molecular gas could be decoupling from the hot atmosphere and the smoothly increasing velocities toward the galaxy centre suggest subsequent infall.
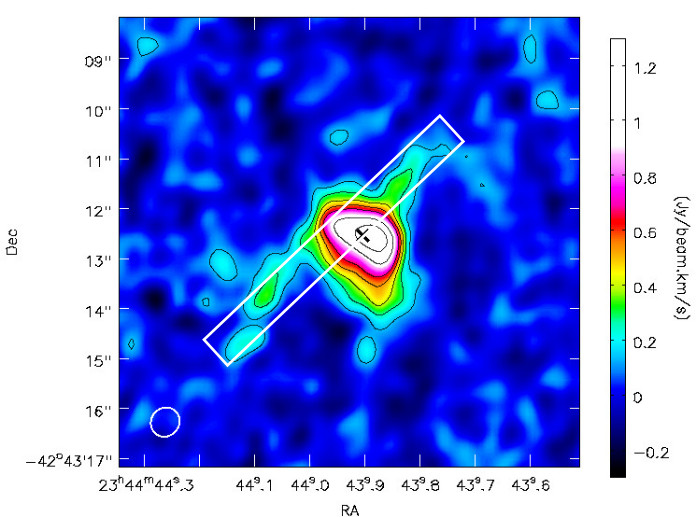
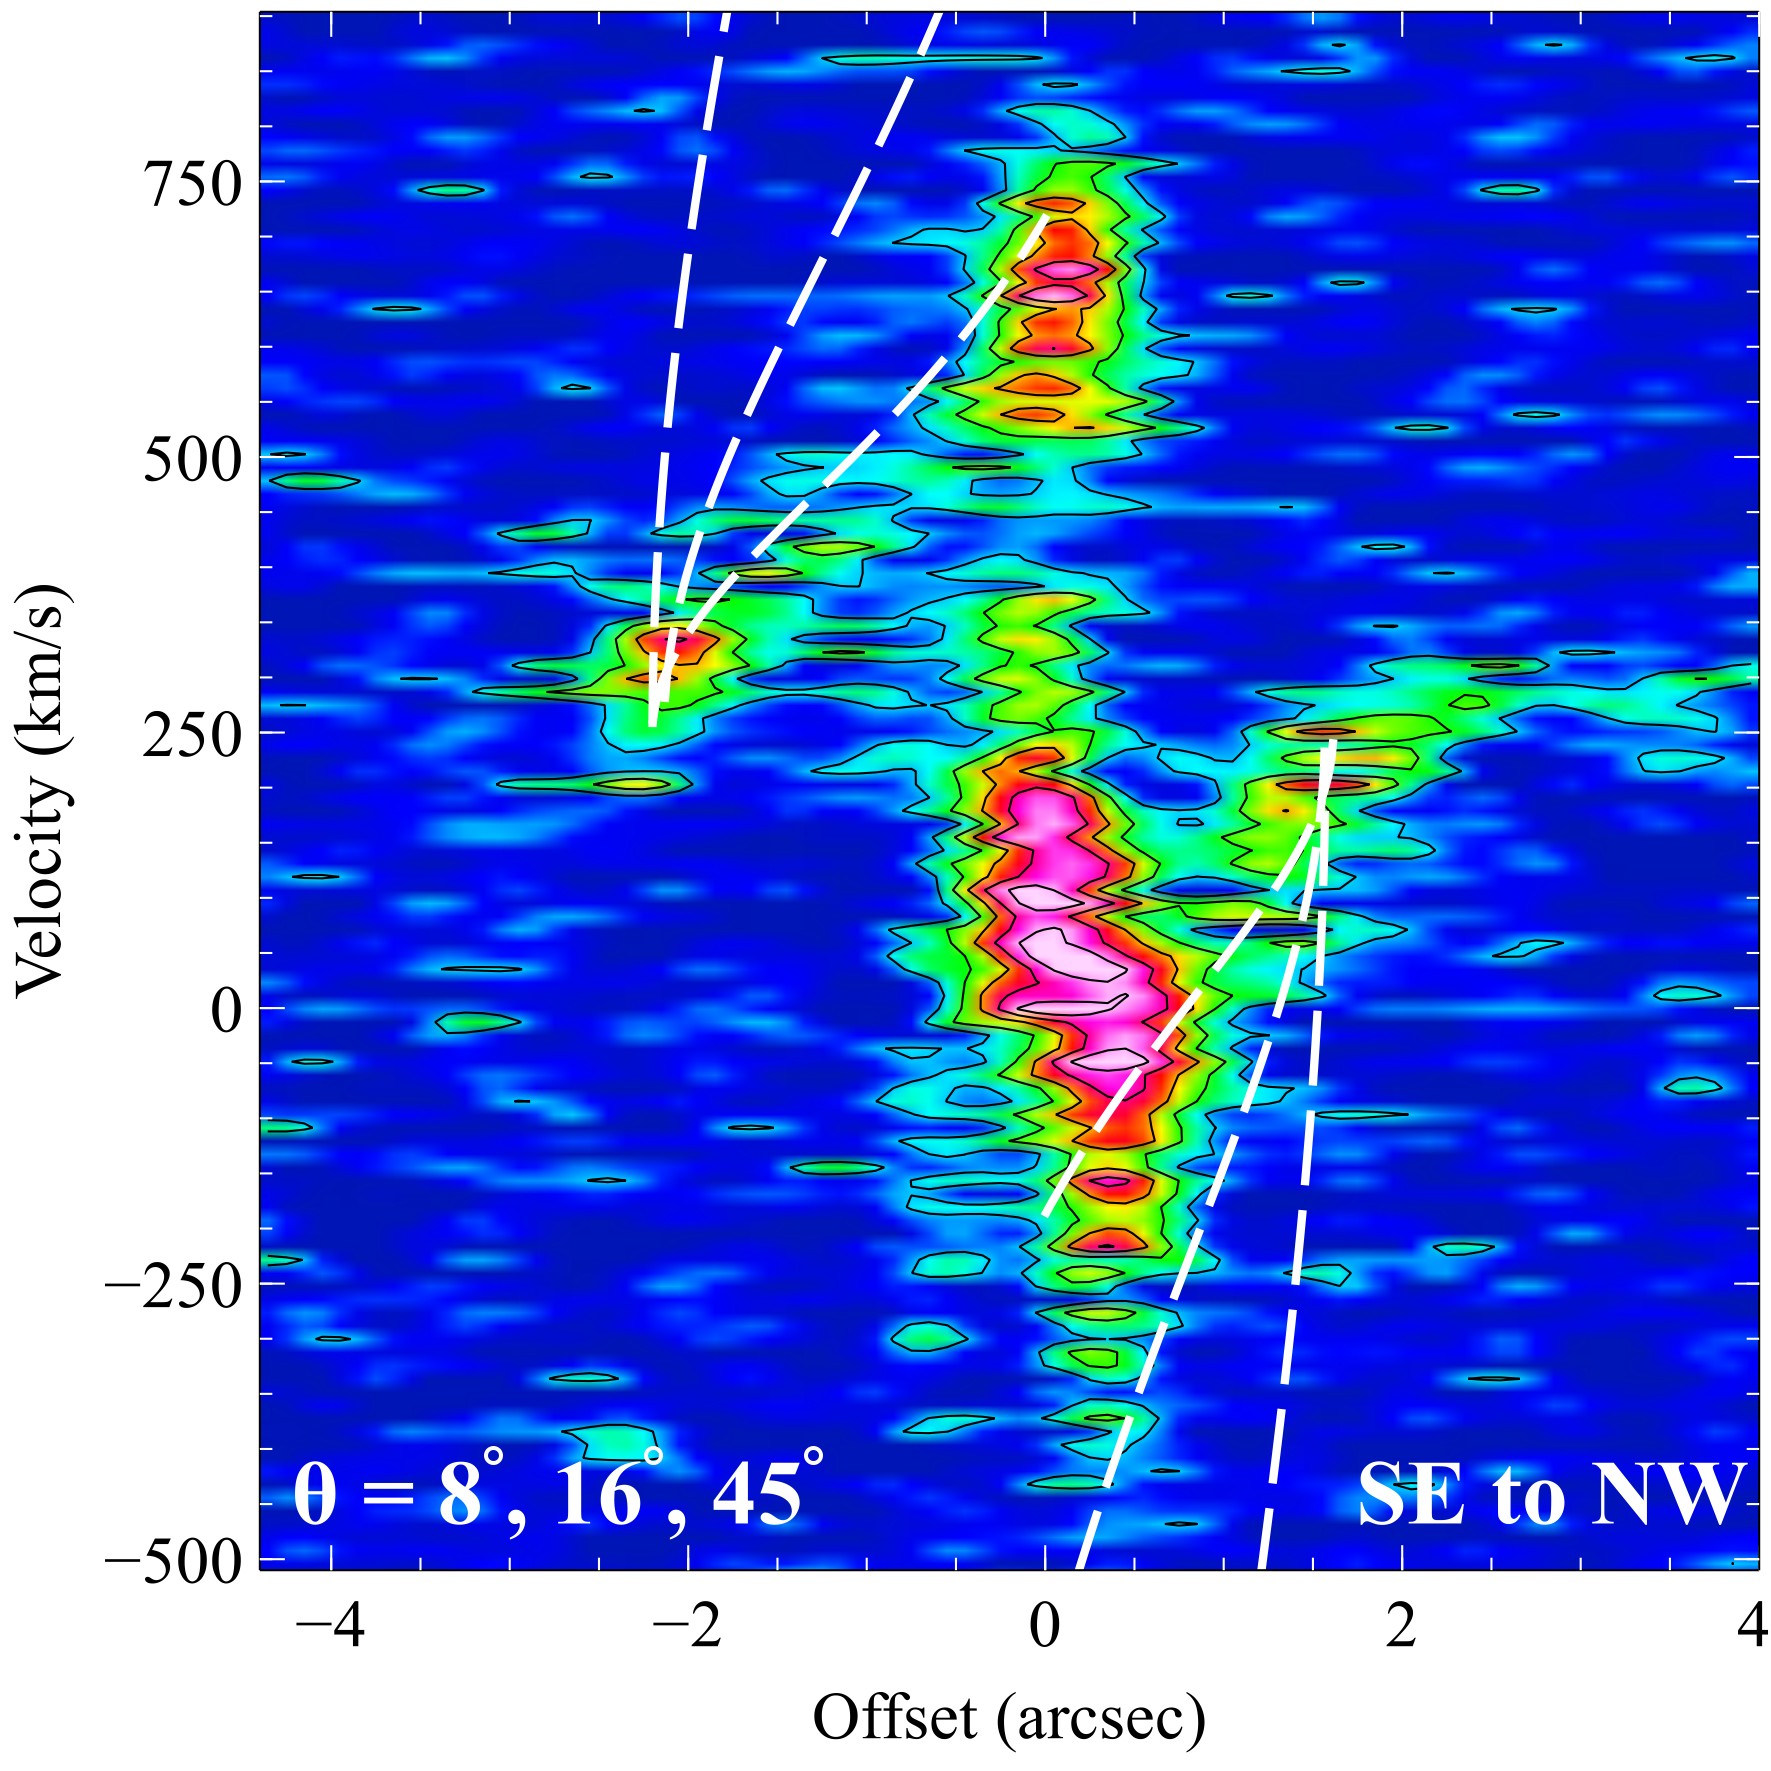
The smooth velocity gradients along the SE and NW filaments are shown clearly in Fig. 5. Following Lim et al. (2008), we assume a Hernquist model for the gravitational potential of the central galaxy (Hernquist 1990) constrained by parameters for the total galaxy mass and effective radius . The velocity acquired by a gas blob that free-falls in this gravitational potential is given by
| (2) |
where is the scale radius (), is the initial velocity of the gas blob and is its initial radius. McDonald et al. (2012) (see also McDonald et al. 2013a) determine an effective radius of from HST imaging in five photometric bands. The scale radius is therefore estimated at .
The total galaxy mass was estimated from Chandra observations assuming hydrostatic equilibrium for the hot X-ray atmosphere in the gravitational potential. We used spectra extracted in concentric annuli (McDonald et al. 2015) and the nfwmass model (Nulsen et al. 2010) in xspec (version 12.9.0; Arnaud 1996) to determine the best-fit NFW profile parameters assuming a spherical, hydrostatic atmosphere. The best-fit scale radius and the normalization constant . We therefore estimate a galaxy total mass of within a radius of . For the best-fit NFW profile, the cluster mass within is . This is consistent with the mass determined from scaling relations with (Williamson et al. 2011) and with (McDonald et al. 2015).
The remaining free parameters for the Hernquist model are the initial radius of the gas blob, the inclination of the trajectory to the line of sight and the initial velocity, where the clouds are coupled to the hot atmosphere. As discussed in section 3.2, the outermost velocities in the filaments are similar and therefore all models used . The initial radius was selected to match each model to the outermost region of the appropriate filament. Fig. 5 shows the PV diagram for the NW to SE axis along the NW and SE filaments with free-fall models for several inclination angles. The observed shallow velocity gradients can only be matched by the lowest inclination angles , for which both filaments are oriented close to the plane of the sky. Beyond the initial acceleration, the model velocity gradient does not depend on the initial radius and velocity. Although the inclination and the total mass are degenerate, the total mass would have to be overestimated by at least a factor of a few to allow inclination angles of . This would also likely require the total stellar mass of (McDonald et al. 2012, 2013a) to have been significantly overestimated. We therefore suggest that such stringent requirements for the orientations of all three filaments, and similar results from ALMA observations of PKS 0745-191 and Abell 1835 (McNamara et al. 2014; Russell et al. 2016), demonstrate that the gas velocities are more likely intrinsically low. Rather than require that the observed filaments are all aligned in the plane of the sky, we suggest that the filament velocities are inconsistent with gravitational free-fall. In addition to the effect of inclination, the infalling gas blobs are slowed, potentially by magnetic tension (Fabian et al. 2008; Russell et al. 2016) or by cloud-cloud collisions within the central few kpc (Pizzolato & Soker 2005; Gaspari et al. 2015).
5 Conclusions
Half of the molecular gas reservoir at the center of the Phoenix cluster lies in extended filaments draped around expanding radio bubbles inflated by relativistic jets and powered by the SMBH. The filaments have smooth velocity gradients along their lengths and narrow line widths consistent with massive, ordered gas flows around the radio bubbles. Although the velocity structure alone does not allow us to distinguish cleanly between inflow or outflow, the massive molecular gas flow is clearly shaped by the recent radio-jet activity. The molecular gas may have been directly lifted in the bubble wakes or formed in situ at large radius from uplifted low entropy X-ray gas that became thermally unstable. The gas velocities appear too low for the bulk of the cold gas to escape the galaxy and the gas will eventually fall back toward the galaxy center to feed the central gas peak. The observed close coupling between the radio bubbles and the cold gas is essential to explain the self-regulation of feedback and understand the stability of this mechanism in clusters over at least half the age of the universe (McDonald et al. 2013b; Ma et al. 2013; Hlavacek-Larrondo et al. 2015).
Acknowledgements
HRR and ACF acknowledge support from ERC Advanced Grant Feedback 340442. MM acknowledges support by NASA through contracts HST-GO-13456 (Hubble) and GO4-15122A (Chandra). BRM acknowledges support from the Natural Sciences and Engineering Council of Canada and the Canadian Space Agency Space Science Enhancement Program. PEJN acknowledges support from NASA contract NAS8-03060. BB is supported by the Fermi Research Alliance, LLC under Contract No. De-AC02-07CH11359 with the United States Department of Energy. ACE acknowledges support from STFC grant ST/L00075X/1. JHL acknowledges support from the Natural Sciences and Engineering Council of Canada, the Canada Research Chairs program and the Fonds de recherche Nature et technologies. CR acknowledges support from the Australian Research Council’s Discovery Projects funding scheme (DP150103208). We thank the reviewer for constructive comments and HRR thanks Adrian Vantyghem for helpful discussions. This paper makes use of the following ALMA data: ADS/JAO.ALMA 2013.1.01302.S. ALMA is a partnership of ESO (representing its member states), NSF (USA) and NINS (Japan), together with NRC (Canada), NSC and ASIAA (Taiwan), and KASI (Republic of Korea), in cooperation with the Republic of Chile. The Joint ALMA Observatory is operated by ESO, AUI/NRAO and NAOJ. The scientific results reported in this article are based on data obtained from the Chandra Data Archive.
References
- Alatalo et al. (2011) Alatalo, K., Blitz, L., Young, L. M., et al. 2011, ApJ, 735, 88
- Aravena et al. (2016) Aravena, M., Spilker, J. S., Bethermin, M., et al. 2016, MNRAS, 457, 4406
- Arnaud (1996) Arnaud, K. A. 1996, in Astronomical Society of the Pacific Conference Series, Vol. 101, Astronomical Data Analysis Software and Systems V, ed. G. H. Jacoby & J. Barnes, 17–+
- Bîrzan et al. (2004) Bîrzan, L., Rafferty, D. A., McNamara, B. R., Wise, M. W., & Nulsen, P. E. J. 2004, ApJ, 607, 800
- Bolatto et al. (2013) Bolatto, A. D., Wolfire, M., & Leroy, A. K. 2013, ARA&A, 51, 207
- Bower et al. (2006) Bower, R. G., Benson, A. J., Malbon, R., et al. 2006, MNRAS, 370, 645
- Brighenti et al. (2015) Brighenti, F., Mathews, W. G., & Temi, P. 2015, ApJ, 802, 118
- Churazov et al. (2005) Churazov, E., Sazonov, S., Sunyaev, R., et al. 2005, MNRAS, 363, L91
- Croton et al. (2006) Croton, D. J., Springel, V., White, S. D. M., et al. 2006, MNRAS, 365, 11
- Dasyra & Combes (2011) Dasyra, K. M., & Combes, F. 2011, A&A, 533, L10
- Dasyra & Combes (2012) —. 2012, A&A, 541, L7
- David et al. (2014) David, L. P., Lim, J., Forman, W., et al. 2014, ApJ, 792, 94
- Downes & Solomon (1998) Downes, D., & Solomon, P. M. 1998, ApJ, 507, 615
- Downes et al. (1993) Downes, D., Solomon, P. M., & Radford, S. J. E. 1993, ApJ, 414, L13
- Dunn & Fabian (2006) Dunn, R. J. H., & Fabian, A. C. 2006, MNRAS, 373, 959
- Edge (2001) Edge, A. C. 2001, MNRAS, 328, 762
- Edge et al. (1992) Edge, A. C., Stewart, G. C., & Fabian, A. C. 1992, MNRAS, 258, 177
- Fabian (2012) Fabian, A. C. 2012, ARA&A, 50, 455
- Fabian et al. (2008) Fabian, A. C., Johnstone, R. M., Sanders, J. S., et al. 2008, Nature, 454, 968
- Fabian et al. (2003) Fabian, A. C., Sanders, J. S., Crawford, C. S., et al. 2003, MNRAS, 344, L48
- Fabian et al. (2006) Fabian, A. C., Sanders, J. S., Taylor, G. B., et al. 2006, MNRAS, 366, 417
- Fabian et al. (2000) Fabian, A. C., Sanders, J. S., Ettori, S., et al. 2000, MNRAS, 318, L65
- Feruglio et al. (2010) Feruglio, C., Maiolino, R., Piconcelli, E., et al. 2010, A&A, 518, L155
- Gaspari et al. (2015) Gaspari, M., Brighenti, F., & Temi, P. 2015, A&A, 579, A62
- Hatch et al. (2006) Hatch, N. A., Crawford, C. S., Johnstone, R. M., & Fabian, A. C. 2006, MNRAS, 367, 433
- Hernquist (1990) Hernquist, L. 1990, ApJ, 356, 359
- Hitomi Collaboration et al. (2016) Hitomi Collaboration, Aharonian, F., Akamatsu, H., et al. 2016, Nature, 535, 117
- Hlavacek-Larrondo et al. (2013) Hlavacek-Larrondo, J., Fabian, A. C., Edge, A. C., et al. 2013, MNRAS, 431, 1638
- Hlavacek-Larrondo et al. (2015) Hlavacek-Larrondo, J., McDonald, M., Benson, B. A., et al. 2015, ApJ, 805, 35
- Iono et al. (2007) Iono, D., Wilson, C. D., Takakuwa, S., et al. 2007, ApJ, 659, 283
- Johnstone et al. (1987) Johnstone, R. M., Fabian, A. C., & Nulsen, P. E. J. 1987, MNRAS, 224, 75
- Kirkpatrick et al. (2009) Kirkpatrick, C. C., McNamara, B. R., Rafferty, D. A., et al. 2009, ApJ, 697, 867
- Li & Bryan (2014) Li, Y., & Bryan, G. L. 2014, ApJ, 789, 153
- Lim et al. (2008) Lim, J., Ao, Y., & Dinh-V-Trung. 2008, ApJ, 672, 252
- Ma et al. (2013) Ma, C.-J., McNamara, B. R., & Nulsen, P. E. J. 2013, ApJ, 763, 63
- Magorrian et al. (1998) Magorrian, J., Tremaine, S., Richstone, D., et al. 1998, AJ, 115, 2285
- Markwardt (2009) Markwardt, C. B. 2009, in Astronomical Society of the Pacific Conference Series, Vol. 411, Astronomical Data Analysis Software and Systems XVIII, ed. D. A. Bohlender, D. Durand, & P. Dowler, 251
- McDonald et al. (2013a) McDonald, M., Benson, B., Veilleux, S., Bautz, M. W., & Reichardt, C. L. 2013a, ApJ, 765, L37
- McDonald et al. (2012) McDonald, M., Bayliss, M., Benson, B. A., et al. 2012, Nature, 488, 349
- McDonald et al. (2013b) McDonald, M., Benson, B. A., Vikhlinin, A., et al. 2013b, ApJ, 774, 23
- McDonald et al. (2014) McDonald, M., Swinbank, M., Edge, A. C., et al. 2014, ApJ, 784, 18
- McDonald et al. (2015) McDonald, M., McNamara, B. R., van Weeren, R. J., et al. 2015, ApJ, 811, 111
- McMullin et al. (2007) McMullin, J. P., Waters, B., Schiebel, D., Young, W., & Golap, K. 2007, in Astronomical Society of the Pacific Conference Series, Vol. 376, Astronomical Data Analysis Software and Systems XVI, ed. R. A. Shaw, F. Hill, & D. J. Bell, 127
- McNamara & Nulsen (2007) McNamara, B. R., & Nulsen, P. E. J. 2007, ARA&A, 45, 117
- McNamara & Nulsen (2012) —. 2012, New Journal of Physics, 14, 055023
- McNamara et al. (2016) McNamara, B. R., Russell, H. R., Nulsen, P. E. J., et al. 2016, ApJ, 830, 79
- McNamara et al. (2000) McNamara, B. R., Wise, M., Nulsen, P. E. J., et al. 2000, ApJ, 534, L135
- McNamara et al. (2014) McNamara, B. R., Russell, H. R., Nulsen, P. E. J., et al. 2014, ApJ, 785, 44
- Morganti et al. (2015) Morganti, R., Oosterloo, T., Oonk, J. B. R., Frieswijk, W., & Tadhunter, C. 2015, A&A, 580, A1
- Morganti et al. (2005) Morganti, R., Tadhunter, C. N., & Oosterloo, T. A. 2005, A&A, 444, L9
- Nesvadba et al. (2006) Nesvadba, N. P. H., Lehnert, M. D., Eisenhauer, F., et al. 2006, ApJ, 650, 693
- Nulsen (1986) Nulsen, P. E. J. 1986, MNRAS, 221, 377
- Nulsen et al. (2010) Nulsen, P. E. J., Powell, S. L., & Vikhlinin, A. 2010, ApJ, 722, 55
- Panagoulia et al. (2013) Panagoulia, E. K., Fabian, A. C., & Sanders, J. S. 2013, MNRAS, 433, 3290
- Peres et al. (1998) Peres, C. B., Fabian, A. C., Edge, A. C., et al. 1998, MNRAS, 298, 416
- Pizzolato & Soker (2005) Pizzolato, F., & Soker, N. 2005, ApJ, 632, 821
- Rafferty et al. (2006) Rafferty, D. A., McNamara, B. R., Nulsen, P. E. J., & Wise, M. W. 2006, ApJ, 652, 216
- Ruel et al. (2014) Ruel, J., Bazin, G., Bayliss, M., et al. 2014, ApJ, 792, 45
- Rupke & Veilleux (2011) Rupke, D. S. N., & Veilleux, S. 2011, ApJ, 729, L27
- Russell et al. (2013) Russell, H. R., McNamara, B. R., Edge, A. C., et al. 2013, MNRAS, 432, 530
- Russell et al. (2014) —. 2014, ApJ, 784, 78
- Russell et al. (2016) Russell, H. R., McNamara, B. R., Fabian, A. C., et al. 2016, MNRAS, 458, 3134
- Salomé & Combes (2003) Salomé, P., & Combes, F. 2003, A&A, 412, 657
- Salomé et al. (2011) Salomé, P., Combes, F., Revaz, Y., et al. 2011, A&A, 531, A85
- Salomé et al. (2008) Salomé, P., Revaz, Y., Combes, F., et al. 2008, A&A, 483, 793
- Salomé et al. (2006) Salomé, P., Combes, F., Edge, A. C., et al. 2006, A&A, 454, 437
- Silk & Rees (1998) Silk, J., & Rees, M. J. 1998, A&A, 331, L1
- Simionescu et al. (2008) Simionescu, A., Werner, N., Finoguenov, A., Böhringer, H., & Brüggen, M. 2008, A&A, 482, 97
- Solomon et al. (1987) Solomon, P. M., Rivolo, A. R., Barrett, J., & Yahil, A. 1987, ApJ, 319, 730
- Solomon & Vanden Bout (2005) Solomon, P. M., & Vanden Bout, P. A. 2005, ARA&A, 43, 677
- Tozzi et al. (2015) Tozzi, P., Gastaldello, F., Molendi, S., et al. 2015, A&A, 580, A6
- Tremblay et al. (2016) Tremblay, G. R., Oonk, J. B. R., Combes, F., et al. 2016, Nature, 534, 218
- Vantyghem et al. (2016) Vantyghem, A. N., McNamara, B. R., Russell, H. R., et al. 2016, ArXiv e-prints, arXiv:1610.00716
- Voigt & Fabian (2004) Voigt, L. M., & Fabian, A. C. 2004, MNRAS, 347, 1130
- Voit et al. (2016) Voit, G. M., Meece, G., Li, Y., et al. 2016, ArXiv e-prints, arXiv:1607.02212
- Williamson et al. (2011) Williamson, R., Benson, B. A., High, F. W., et al. 2011, ApJ, 738, 139
- Young et al. (2011) Young, L. M., Bureau, M., Davis, T. A., et al. 2011, MNRAS, 414, 940