Rotational tumbling of Escherichia coli aggregates under shear
Abstract
Growing living cultures of Escherichia coli bacteria were investigated using real-time in situ rheology and rheo-imaging measurements. In the early stages of growth (lag phase), and when subjected to a constant stationary shear, the viscosity slowly increases with the cell’s population. As the bacteria reach the exponential phase of growth, the viscosity increases rapidly, with sudden and temporary abrupt decreases and recoveries. At a certain stage, corresponding grossly to the late phase of growth, when the population stabilizes, the viscosity also keeps its maximum constant value, with drops and recoveries, for a long period of time. This complex rheological behaviour, which was observed to be shear strain dependent, is a consequence of two coupled effects: the cell density continuous increase and its changing interacting properties. Particular attention was given to the late phase of growth of E. coli populations under shear. Rheo-imaging measurements revealed, near the static plate, a rotational motion of E. coli aggregates, collectively tumbling and flowing in the shear direction. To explain this behaviour, we introduce a simple theoretical model, in which the individual cells are transported by the flow, but remain rigidly attached to the other cells of the aggregate.
I Introduction
The rheology of Escherichia coli suspensions and biofilms has been the focus of numerous research studies in recent years Elgeti et al. (2015); Karimi et al. (2015); Mazza (2016). These systems present a complex non-Newtonian rheological behaviour, which depend not only on the “passive” physical properties of the bacteria, but also on their intrinsic “activity”. This “activity” may be in part associated with the individual swimming motion and propulsion apparatus of each E. coli cell, beautifully described in Gachelin et al. (2013), but also with the emergence of a collective behaviour, usually related to cell density, but not exclusively. The processes of bacterial chemotaxis and aggregation are driven by the availability of nutrients, their own secretion of chemoattractants, which prevent the dispersion of the population Saragosti et al. (2011), the presence of oxygen López et al. (2015) and other external factors, as the boundary confinement Gachelin et al. (2013), the substrate surface roughness, or the external mechanical solicitation Gachelin et al. (2013); López et al. (2015).
In some interesting situations, in diluted and in semi-diluted regimes, the “active” viscosity can be lower than the viscosity of the suspending fluid at low shear rates. The collective coordinated motion of the bacteria seems to create a “superfluid” Gachelin et al. (2014); López et al. (2015). In other situations, E. coli bacteria form biofilms – self-organized, integrated communities composed of bacterial cells embedded in a matrix of self-produced extracellular polymeric substances (EPS) –, which adhere to surfaces, and are capable of withstanding chemical and mechanical stresses. Biofilms may evolve into complex configurations such as granules, ripples, or streamers, which influence the mechanical response of the culture Karimi et al. (2015).
Several experimental setups have been used to study the rheology of bacterial suspensions and biofilms Karimi et al. (2015). Some use (macroscopic) conventional rheometry, such as stress-strain, creep and small amplitude oscillatory shear tests, others use microfluidic devices, which allow access to the internal structure of the cell clusters. Often, the performed studies are time-window confined and do not refer to a regular culture cell growth process.
In this work we study the rheology of E. coli cultures during growth, in situ, when subjected to a stationary shear flow. We have found three distinct rheological behaviours, corresponding to the three distinct phases of growth, the lag, exponential and late phases. In order to understand these different viscoelastic behaviours, we used rheo-imaging to assess the cell’s organization and patterning in each phase of growth, while the shear flow was being applied. Particular attention is addressed to the late phase of growth where the highest density of cells is attained and a surprising rotational tumbling motion of cell’s aggregates, not previously reported in the literature, is observed. An attempt to quantitatively describe this behaviour is proposed, considering a theoretical model based on simple rigid body mechanics.
This article is organised as follows: in Section II we describe the bacteria culture considered in this study, and the various experimental techniques used to characterise them: bacteria propagation, optical density measurements, rheology and rheo-imaging characterisation. In Section III we analyse the rheological behaviour under steady-state shear flow. From the real-time rheo-imaging it is possible to obtain crucial information on bacteria self-aggregation patterns and intrinsic motion. In Section IV we describe the theoretical model proposed to describe the rotational tumbling motion observed in this E. coli culture at high cell density stage, and we present our conclusions in Section V.
II Experimental / Methods
II.1 Bacteria strain and growth conditions
Escherichia coli DH5 (Invitrogen,USA) was used. Cultures were grown at 37 ∘C with aeration in LB (NZYtech,Portugal). Over-night grown cultures were used to re-inoculate fresh medium at an initial of 0.005, for rheological characterisation. To monitor bacterial growth, we measured the optical density (620 nm) at discrete time intervals, resorting to a spectrophotometer Ultrospec 2100 pro. In parallel, we also determined the population colony forming units (cfus/ml), which provides an estimation of the viable cells, by plating serial dilutions of the bacterial cultures on LA (NZYtech,Portugal). The plates were incubated for 48 h at 37 ∘C, and the colonies were counted. Growth of E. coli cultures in culture medium was monitored by measuring the optical density () at discrete time intervals, in parallel with population’s colony-forming units (cfus/ml).
II.2 Rheology
Rheological measurements were performed in a controlled stress rotational rheometer Bohlin Gemini HR. A steel plate/plate geometry, with diameter 40 mm and 2000 m gap (to ensure a good signal), was used for the measurements of the viscosity growth curve, at constant shear rate of 10 s-1, at 37 ∘C (to allow optimal bacterial growth). A solvent trap was used in all measurements to avoid evaporation.
II.3 Rheo-Imaging
Real-time image acquisition was performed during steady-state shear flow measurements in a ThermoHaake RheoScope equipment, which combines the principles of a conventional controlled stress rheometer with an optical microscope. A constant shear rate of 10 s-1 was imposed using a cone/plate geometry with 70 mm diameter and an angle of 1∘, at 37 ∘C. The cone had a mirror surface and the plate a cover glass, to allow optical microscopic observations (20x) during shear (schematic details are enclosed in Fig. 1), at an intermediate radius plate fixed position. A sequence of one photo image per min was extracted from the video. In these tests, the growth of an E. coli culture was followed by starting measurements already at the exponential phase (approximately at an =2.5). Video image acquisition was performed during 150 min. At the end of these measurements two videos with a higher frame rate acquisition (1 frame/s) were recorded, each with a duration of 3 min, under the same rheological conditions (supplementary material S1).
III Results and Discussion
From the optical density and population’s forming units measurements, it was possible to identify three different growth phases: lag phase, exponential phase and late phase. In the first stage of growth, corresponding to the lag phase, bacteria are adapting to the new environmental growth conditions. Secondly, the exponential phase of bacterial growth starts with the concentration of bacteria in the medium increasing exponentially. The last stage, late phase, occurs when the bacteria population starts to stabilize.
The general viscosity growth curve, in Figure 1, suggests a really complex and rich rheological behaviour, showing three distinct phases, consistent with the time intervals previously defined for the lag, exponential and late phases.
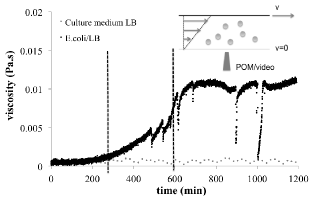
.
In the first 300 minutes of growth, corresponding to the lag phase, bacteria are adapting to the new environmental growth conditions, with a characteristic slow division rate. Accordingly, the viscosity shows a slow and constant increase with time. In the exponential phase (300 - 600 min), where the strongly increases, the viscosity presents a dramatic increase by a factor of 30 with respect to its initial value. The viscosity increase in this period is not monotonic, but exhibits several drops and recoveries. At 600 min, it is known that the cfus/ml starts to stabilize, most probably due to nutrient depletion and accumulation of secondary metabolites which inhibit cell division. This corresponds to the beginning of the late phase. At approximately this time point, the viscosity increase slows down, reaching an intermittent plateau of maximum viscosity, with several drops and recoveries.
Comparable results were obtained for S. aureus - strain COL culture Portela et al. (2013); Patrício et al. (2014): In this case, we also observed in the viscosity growth curve three distinct regimes, corresponding to the lag, exponential and late phases. The lag phase with a slow viscosity increase, the exponential phase with a dramatic viscosity increase, exhibiting also several sudden drops and recoveries, and a late phase, in which the viscosity decreases. However, in contrast with the E. coli results, the viscosity decrease of S. aureus at the late phase was abrupt, recovering almost its initial value in a very short period (approximately 100 minutes). The S. aureus bacteria have a spherical shape with 1 m diameter, they are not self-motile, and they form small clusters of 5-15 cells. As the cell density increases, the bacteria aggregates start to establish new contacts and form frequently a web of cellular structures Franco et al. (2015). This may explain the initial viscosity increase observed in the lag and exponential phases. The viscosity drops and recoveries at the exponential phase may also be associated with the formation and disruption of the web cellular structures during shear. It is known that in the late phase the bacteria diminish substantially the production of adhesins Voyich et al. (2005). Without being able to adhere, the bacteria sediment in the static plate (as observed with rheo-imaging Franco et al. (2015)), justifying the abrupt viscosity decrease at this phase of growth.
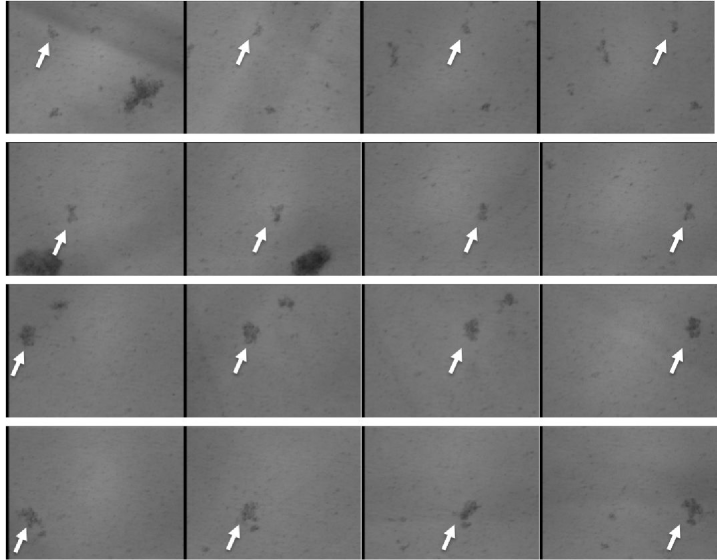
In the present case of an E. coli culture, the viscosity increase observed in the lag and exponential phases seems also naturally related to the cell density increase. In the late phase, however, the viscosity remains approximately constant (although with sudden drops and recoveries) and we do not observe bacteria sedimentation. Instead, rheo-imaging measurements of growing E. coli populations under shear, in the late phase, revealed a collective rotational motion, associated with the translational motion in the shear direction, near the static plate (this collective motion was not identified for the small S. aureus clusters). Different size aggregates were observed at this stage of growth, where most of the bacteria are moving together and bacteria deposition rarely occurred. A possible understanding for the formation of this aggregates follows. As the individual cells contact with the plate, they adhere, creating a thin cell layer. These thin cell planar aggregates frequently detach from the plate, and start to move collectively, sometimes curling themselves in a cylindrical hollow shape, rotating around the direction that is perpendicular to the plane of the flow (the vorticity direction), and moving with the fluid with a constant linear velocity. The aggregates’ movement and its interaction with the transient thin layers may justify the viscosity drops and recoveries during the exponential and late phases. As we do not observe cell deposition, the bacteria density in the bulk remains approximately constant at the late phase, justifying the viscosity plateau.
From the recorded videos, it was possible to characterise quantitatively the rotational and translational motion of the aggregates over a convenient statistical sample. Four examples are included in Figure 2 and the average value of the angular velocity of the aggregates was estimated to be rad/s. The error associated to this estimation is mainly due to the acquisition frame rate, which is 1 frame/s.
In spite of the well-known E. coli intrinsic motility, we do not observe an explicit individual motion of the cells within each aggregate. Instead, they seem to keep their relative positions, suggesting they are connected by adhesive factors Karimi et al. (2015). The role of the E. coli intrinsic motility is surely an important ingredient to understand the rheological behavior of the colonies. In particular, we do not observe a significant E. coli sedimentation, during the late phase of growth, as occurred in S. aureus, a non-motile bacteria. The relation between motility and sedimentation should be further investigated in future studies.
IV Theoretical model
Rheo-imaging measurements showed us unequivocally the existence of aggregates with a rotational tumbling motion, not previously reported in the literature. The observed motion resembles the well-known tumbling motion of an ellipsoidal particle immersed in a viscous fluid, described by Jeffery Jeffery (1922). In our experiments, however, the rotational motion does not correspond to a single body, but to a whole aggregate of cells, which seem strongly interconnected. In order to physically describe this motion, and in a first approximation, we modelled the cells as individual particles with the same mass, connected by rigid links or filaments, and thus forming a global rigid body. Due to the small size of the cells, inertial effects are neglected. Moreover, despite the large number of cells and their links, in this approximation the flow stays unperturbed. Under a simple shear, the fluid velocity field is given by:
| (1) |
where is the constant shear rate. The position and velocity of each cell are
| (2) |
and . The drag force on each cell may be written:
| (3) |
where is the drag coefficient, which we take to be approximately constant, independent of the cell, and consequently, of its individual orientation.
In this simplified model, the cell’s aggregate behaves as a rigid body. Neglecting inertial terms, the equations of motion are
| (4) | |||
| (5) |
where , and is the aggregate’s center of mass.
The first equation gives the motion of the center of mass, which has a constant velocity:
| (6) |
The second equation gives the rotational motion of the aggregate, with angular velocity :
| (7) |
If the vorticity direction coincides with one of the principal directions of the moment of inertia,
| (8) |
and the aggregate rotates only in the plane of the flow, . The second equation of motion becomes:
| (9) |
where the second order moments are defined by
| (10) |
The second order moments define a 2D tensor which has principal moments and , associated with the principal directions and , and related to through the rotation . Thus, we may write
| (11) | |||
| (12) |
The principal moments of the rigid aggregate are constant throughout the motion. Its use explicits the dependence of the rotational angle . The second equation of motion may now be written:
| (13) |
Interestingly, this equation corresponds to the classical Jeffery equation Jeffery (1922) for the motion of an ellipsoidal particle immersed in a viscous fluid, obtained by first solving Stoke’s equations for the fluid around the particle (a non trivial calculation). In Jeffery equation, the second moments are replaced by equivalent expressions involving the lengths of the ellipsoidal axes. Instead, our simplified model does not specify the geometry of the rigid aggregate, but the fluid stays unperturbed.
If we define the relative difference between the principal second order moments (so ), Eq. (13) may be simplified to
| (14) |
This equation may be integrated (it was firstly found by Jeffery). If we rewrite Eq. 14,
| (15) |
Omitting a constant, we have the solution:
| (16) |
We have periodic solutions, with a periodicity that may be obtained directly from the previous integral expression:
| (17) |
Thus, the absolute value of the mean angular velocity of the aggregate (rotating clockwise) is
| (18) |
and should be always smaller than half the shear rate.
In our experimental results, the distribution of bacteria in the projected plane of the rotation is approximately circular, meaning and small. In this limit, we have the explicit approximate solution:
| (19) |
If we had a very asymmetric collection of bacteria, with , for . In this case, the aggregate would be oriented most of the time along the axis with smaller second order moments. Eventually, the aggregate would acquire larger and larger absolute angular velocities, reaching for , and slowing down again. The motion is periodic, but with larger and larger periodicities as .
In our experimental results, we have a small number of frames per aggregate’s complete revolution. It is thus difficult to have a precise idea about its second order moments. The measured mean angular velocity presents a large error ( rad/s), and is roughly of the shear rate ( 1/s). This would correspond to a fairly asymmetric aggregate (in the rotational plane, which is perpendicular to the plane of the images, and leading to a large value of ), not suggested by the pictures (see Fig. 2). We are currently planning new optical images, in more precise experiments. From the theoretical point of view, we could think of more developed models, using for instance chemioattractive interactions (a la Keller-Segel type Keller and Segel (1971); Saragosti et al. (2010)), or active brownian forces, expressing the cell’s collective interaction, added to the equation of motion of each individual cell Saragosti et al. (2011). Nevertheless, from our images, we have the impression that the motion of the aggregates resembles the motion of a rigid body. Without other accurate measurements, we think this model seems to retain the fundamental aspects of our results.
V Conclusions
In this study, real-time and in situ rheo-imaging rheology was applied to the animal commensal bacteria E. coli during cell growth. As the density of bacteria in the medium increases, cells may rearrange themselves in different aggregates, capable of strongly influencing their environment, and leading to three different physical rheological responses, corresponding to the three distinct phases of growth, the lag, exponential and late phases.
In the lag phase, bacteria are adapting to the new environmental growth conditions, with a characteristic slow division rate. Accordingly, the viscosity shows a slow and constant increase with time. In the exponential phase the viscosity presents a dramatic increase, but exhibits several drops and recoveries. In the late phase of growth, the viscosity increase slows down, reaching an intermittent plateau of maximum viscosity, with several drops and recoveries. In this phase, the highest bacteria density is attained – bacteria still grow and divide, but at a lower rate. Big and irregular bacteria aggregates are observed, which keep moving in suspension. No significant sedimentation is observed. The aggregates present translational motion in the shear flow direction, and rotational motion in the vorticity direction. The aggregates become larger in time, due to the incorporation of smaller aggregates. Due to the rotational motion, the aggregates become elongated along the rotational axis. Apparently, the size of the aggregates does not influence the rotational motion, since almost all aggregates rotate with the same angular velocity, which is related with the applied shear rate. In spite of the well-known E. coli intrinsic motility, the proposed model based on rigid-body motion seems to offer a sufficient physical description to the rotational motion of the E. coli aggregates.
Acknowledgements
This work was also supported by FEDER through the COMPETE 2020, and FCT projects UID/CTM/50025/2013, PTDC/FIS-NAN/ 0117/2014 (awarded to PLA) and ESCMID grant 2015 (awarded to RGS) and by the “Unidade de Ciências Biomoleculares Aplicadas- UCIBIO” which is financed by national funds from FCT/MEC (UID/Multi/ 04378/2013) and co-financed by the ERDF under the PT2020 Partnership Agreement (POCI-01-0145-FEDER-007728 ).
References
- Elgeti et al. (2015) J. Elgeti, R. G. Winkler, and G. Gompper, Rep. Prog. Phys. 78, 056601 (2015).
- Karimi et al. (2015) A. Karimi, D. Karig, A. Kumar, and A. Ardekani, Lab on a Chip 15, 23 (2015).
- Mazza (2016) M. G. Mazza, Journal of Physics D: Applied Physics 49, 203001 (2016).
- Gachelin et al. (2013) J. Gachelin, G. Miño, H. Berthet, A. Lindner, A. Rousselet, and É. Clément, Phys. Rev. Lett. 110, 268103 (2013).
- Saragosti et al. (2011) J. Saragosti, V. Calvez, N. Bournaveas, B. Perthame, A. Buguin, and P. Silberzan, Proc. Natl. Acad. Sci. USA 108, 16235 (2011).
- López et al. (2015) H. M. López, J. Gachelin, C. Douarche, H. Auradou, and E. Clément, Phys. Rev. Lett. 115, 028301 (2015).
- Gachelin et al. (2014) J. Gachelin, A. Rousselet, A. Lindner, and E. Clement, New J. Phys. 16, 025003 (2014).
- Portela et al. (2013) R. Portela, P. L. Almeida, P. Patricio, T. Cidade, R. G. Sobral, and C. R. Leal, Phys. Rev. E 87, 030701 (2013).
- Patrício et al. (2014) P. Patrício, P. Almeida, R. Portela, R. Sobral, I. Grilo, T. Cidade, and C. Leal, Phys. Rev. E 90, 022720 (2014).
- Franco et al. (2015) J. M. Franco, P. Patrício, P. L. Almeida, R. Portela, R. G. Sobral, and C. R. Leal, Proceedings of IBEREO2015 , 118 (2015).
- Voyich et al. (2005) J. Voyich, K. Braughton, D. Sturdevant, A. Whitney, B. Said-Salim, S. Porcella, D. Long, D. Dorward, D. Gardner, B. Kreiswirth, J. Musser, and F. DeLeo, J. Immunol. 175, 3907 (2005).
- Jeffery (1922) G. B. Jeffery, in Proc. R. Soc. A, Vol. 102 (The Royal Society, 1922) pp. 161–179.
- Keller and Segel (1971) E. F. Keller and L. A. Segel, J. Theor. Biol. 30, 225 (1971).
- Saragosti et al. (2010) J. Saragosti, V. Calvez, N. Bournaveas, A. Buguin, P. Silberzan, and B. Perthame, PLoS Comput. Biol. 6, e1000890 (2010).