Mechanical, elastic and thermodynamic properties of crystalline lithium silicides
Abstract
We investigate crystalline thermodynamic stable lithium silicides phases (LixSiy) with density functional theory (DFT) and a force-field method based on modified embedded atoms (MEAM) and compare our results with experimental data. This work presents a fast and accurate framework to calculate thermodynamic properties of crystal structures with large unit cells with MEAM based on molecular dynamics (MD). Mechanical properties like the bulk modulus and the elastic constants are evaluated in addition to thermodynamic properties including the phonon density of states, the vibrational free energy and the isochoric/isobaric specific heat capacity for Li, Li12Si7, Li7Si3, Li13Si4, Li15Si4, Li21Si5, Li17Si4, Li22Si5 and Si. For a selected phase (Li13Si4) we study the effect of a temperature dependent phonon density of states and its effect on the isobaric heat capacity.
keywords:
lithium silicides , heat capacity , density functional theory , molecular dynamicsPACS:
65.40.-b , 31.15.E , 63.20.-e1 Introduction
The rapid growth of new technologies (e.g. portable devices like smart-phones and tablets, electro-mobility or hybrid-cars etc.) demands new and efficient energy storage systems. The leading graphite anode material is limited due to a low Li storage capacity 372 mAh g-1 [1].
The development of a new improved energy storage system requires a material which has a higher specific energy density, current density and charge/discharge cycling stability. To address these challenges a thorough scientific understanding of these materials is required.
Lithium silicides (LixSiy) are discussed as a new kind of lithium ion battery materials due to their high lithium storage capacity ( 4200 mAh g-1 for Li22Si5) [2].
Several experimental and ab-initio investigations were carried out in the last years to determine the specific heat capacity and related properties to construct the phase diagram of LixSiy [3, 4, 5, 6].
On the one hand experiments need highly accurate sample preparation and measurements and with that an appropriate time span for the evaluation of thermodynamic data.
On the other hand some of the LixSiy phases have large unit cells with hundreds of atoms, resulting in a high computational effort to describe such systems theoretically.
Cui et al. [5] started to create LixSiy modified embedded atom potentials and calculated elastic and dynamic properties of LixSiy from amorphous phases. In this work we focus on the crystalline structures
of the thermodynamically stable LixSiy phases and calculate elastic properties like the bulk modulus and elastic constants as well as thermodynamic properties like the vibrational free energy and phonon density of states in the framework of density functional theory and the force-field method of modified embedded atoms. We show how to overcome the limit of the quasi-(harmonic) approximation and present a temperature dependent phonon density of states calculated from molecular dynamics simulations. All our computational results are compared to available experimental data [4].
2 Theory - Computational methods
One important physical property for characterizing lithium ion batteries is the so-called specific storage capacity . For lithium silicides LixSiy the specific storage capacity can be calculated using
| (1) |
where C mol-1 is the Faraday constant and g mol-1 is the molar mass of silicon.
| crystal structure | Li mass content [%] | [mAh g-1] |
| Si | 0 | 0 |
| LiSi | 19.8 | 954 |
| Li12Si7 | 29.8 | 1636 |
| Li7Si3 | 36.6 | 2227 |
| Li13Si4 | 44.5 | 3102 |
| Li15Si4 | 48.1 | 3579 |
| Li21Si5 | 50.9 | 4009 |
| Li17Si4 | 51.2 | 4056 |
| Li22Si5 | 52.1 | 4200 |
| Li | 100 | — |
The understanding of thermodynamic material properties can be based on three pillars: experiment, atomistic simulations, and so-called CALPHAD modelling [7]. Experimental methods (XRD, neutron-scattering, differential scanning calorimetry etc.) can deliver structural information about battery materials,
but often even neutron-scattering is not able to determine lithium position in crystal structures accurately.
Many physical properties (e.g. phonon densities, free energies, heat capacities etc.) depend on the crystal structure. Atomistic electronic structure methods can often clarify structural uncertainties with the help of energy surface calculations, relaxation methods, or molecular dynamics. Computational methods can also be employed to calculate thermodynamic data from an experiment independent point of view [6].
This data is useful to get insight in complex physical behavior like
diffusion effects [6] or phase transitions [8]. Additionally, theory at these levels can provide thermodynamic data for structures which are not accessible by experiments (e.g metastable phases).
The CALPHAD method can be based on input from both experiment as well as atomistic calculations to model phase diagrams for binary, ternary or even more complex systems.
In this work we concentrate on computational aspects of thermodynamics (also called computational thermodynamics).
Important physical properties are calculated from structural input quantities without any fit to experimental data.
The field of applicable ab-initio theories ranges from highly accurate quantum chemistry methods (e.g. Hartree Fock, configuration interaction, coupled cluster methods etc.) to more approximate methods (e.g density functional theory, force-field methods, phase field methods etc.)
often used in materials research.
All computational methods are based on approximations and therefore all of these methods have their own limits.
State-of-the-art computational thermodynamics is based on DFT, which is limited by the large computational cost. The advantage of this method is the obtained accuracy for total energies and forces.
Thermodynamics based on molecular dynamics is limited by the given accuracy of the used force-field approximation. The advantage of such methods is that configuration changes, diffusion effects or very large volume expansions or contractions can be calculated in an appropriate computational time. Additionally, force-field methods offer the opportunity for long time molecular dynamics and thus reliable statistics.
In this work we show a pathway to combine the advantages of both methods to get a deeper understanding of
the thermodynamics of lithium silicides.
As mentioned before we concentrate on the crystalline structures of LixSiy. In this respect density functional theory (DFT) [9] calculations are very accurate and deliver a good description of the electronic structures of such systems.
The framework of DFT is used to calculate the ground state electron density of a system. From this quantity one can determine the total energy at = 0 K. Additionally, the forces between atoms can be evaluated using the Hellmann-Feynman theorem [9, 10] and even the stress tensor can be determined [11, 12].
One of the most important concepts is the Born-Oppenheimer approximation, which is implicitly assumed. This approximation states that electronic degrees of freedom vary much faster than nuclear ones, i.e. electrons follow the motion of the nuclei almost instantaneously.
This fact allows the separation of electron and nuclear dynamics, while the nuclear motion can be treated classically. Using this concept enables the calculation of solid state (and other) properties with DFT by only solving the electronic problem.
In contrast to the force-field method the computational effort of DFT highly depends on the number of atoms in the unit cell. Some of the LixSiy phases have crystal structures with many atoms (see TAB. 2) and ab-initio thermodynamics becomes very expensive. For that reason we additionally used the force-field based molecular dynamics method to calculate thermodynamic properties for all known phases of the LixSiy system. We used the so-called modified embedded atom method (MEAM), in which the total energy of a system of atoms can be written in this formalism [13, 14] as
| (2) |
where the energy of the -th atom is defined as
| (3) |
The embedding energy is a function of the background electron density at the site of atom whereas the pair potential between atoms and depends on the distance . The embedding energy is the energy which is needed to insert an atom at a site where the background electron density equals . A detailed description of the method itself can be found in Gullet et al. [13].
3 Elastic and thermodynamic properties
Hook’s law connects the stresses (stress tensor) and strains (strain tensor) inside a material by the following linear relationship
| (4) |
where are elastic constants of the material. This linear relation holds in the limit of infinitesimal deformation. The bulk modulus is an important material property. A general expression for the bulk modulus depending on the elastic constants was given by Voigt [15]
| (5) |
Another possibility for the numerical determination of the bulk modulus is given by the energy-volume relation of the system
| (6) |
where the volume dependent energy can be calculated using an equation of state (EOS), like the Birch-Murnaghan EOS [16].
Lattice dynamics is a broad field and the most commonly used methods are based on the harmonic and the quasi-harmonic approximation (QHA).
The harmonic approximation (HA) in the field of DFT is used for example to calculate IR- and RAMAN spectra for molecular systems while
the framework of the quasi-harmonic approximation is generally used to calculate thermodynamic properties of bulk systems. There are two common methods in DFT, the direct method (also called frozen phonon method) and the density functional perturbation theory (DFPT, also called linear response).
Both methods allow to calculate the dynamical matrix.
This dynamical matrix can be used to calculate the phonon dispersion relation or the phonon density of states (PDOS).
In contrast to DFPT in which only unit cells are used the direct method is based on supercells.
Thus, the direct method is computationally more demanding than DFPT. However, it is possible to extend the supercell approach to include anharmonic effects [17],
while DFPT is restricted to harmonic effects. For large unit cells as in the case of LixSiy phases both of these methods become
computationally demanding. In the field of classical molecular dynamics there are two methods to calculate the phonon density of states as well.
Both methods are based on the fluctuation dissipation theorem. The first one uses the velocity autocorrelation function to calculate the vibrational density of states (VDOS, also called PDOS or power spectra) from the velocities v of the atoms (during a long MD run) with
| (7) |
The isochoric heat capacity can be calculated from this vibrational/phonon density of states PDOS using
| (8) | ||||
| (9) |
The second method is based on the fluctuations/displacements of atoms during a molecular dynamics simulation [18, 19, 20]. During the MD run the displacements of the atoms are recorded. Afterwards Green’s function coefficients are evaluated in real space, which are given by the ensemble average of the scalar product of the atomic displacements [18]. From these Green’s function coefficients the force constants, the dynamical matrix, and with that PDOS can be calculated. The linear thermal expansion coefficient can be determined according to
| (10) |
For the evaluation of this expression it is necessary to perform a set of molecular dynamics simulation with NPT ensembles for different temperatures and fixed pressures . From a specific MD run the mean volume and for all MD runs the global volume minimum can be calculated. This leads to following expression of the linear thermal expansion coefficient
| (11) |
with indicating a specific MD run. The reduced volume is given by
| (12) |
With the knowledge of the bulk modulus , the linear thermal expansion coefficient and the isochoric heat capacity we can calculate the isobaric heat capacity by using
| (13) |
with being the mole number. Sometimes the characteristics of structural changes in huge simulation cells during MD simulations are difficult to analyze. In these cases the so called radial pair distribution function (RPDF) can deliver information on changes in the coordination sphere of specified atoms at different temperatures. The radial pair distribution function is the average number of atoms in a shell around an atom at . For each atom = 1, …, the number of atoms in the shell with the radius () are counted [21]
| (14) |
where is the average density and the pair distribution function (PDF) is given by
| (15) |
Normalizing to the shell volume leads to the following expression for the RPDF,
| (16) | ||||
| (17) |
where is the probability to find an atom in a volume at a distance and is the probability
to find an atom in a volume if the atoms where uniformly distributed [22].
Besides the standard harmonic and quasi-harmonic approximations, newer developments and methods for an explicit inclusion of anharmonicity in ab-initio thermodynamics have been proposed by the group of Neugebauer, e.g. the upsampled thermodynamic integration using Langevin dynamics (UP-TILD) [23] approach. In this context a set of different molecular dynamics runs is used to construct a force-field, which reproduces the right temperature dependence.
Furthermore, to mention some other important approaches here: there is one by the group of Monserrat et al. [24], the stochastic self-consistent harmonic approximation by Errea et al. [25], and the temperature dependent effective potential (TDEP) method by Hellman et al. [26] to include high-temperature anharmonicity.
In the TDEP method, ab-initio molecular dynamics are used to fit the temperature dependent effective potential. All these approaches have in common that
they try to represent the high-temperature anharmonicity by inclusion of the phonon-phonon coupling.
Our MEAM based MD approach for the calculation does not include phonon-phonon coupling directly. In principle, however, the performed MEAM MD runs are fully anharmonic, thus higher order anharmonic effects may be projected onto the harmonic force constants. Further investigations to include the phonon-phonon coupling directly within our method are planned for future work.
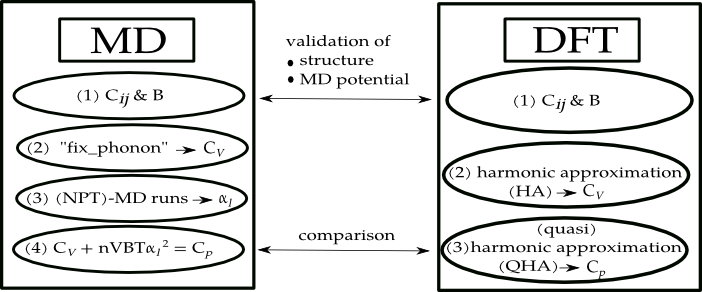
The following chapters are structured according to the procedure steps of our MD method (see FIG. 1). First we will give a short summary of the codes and numerical parameters which we used in our calculations (see Section 4). Then we discuss the first step of our MD method and present the elastic properties of the lithium silicides (see Section 5.1). Within this step we show that the used MEAM potential is valid for the description of the lithium silicides crystal structures. In Section 5.2 we will present values for different lithium silicides calculated within our MD method and compare them with DFT and experiment. Additionally, we analyzed computational time aspects of the method in Section 6.
4 Computational details
The electronic structure calculations based on density functional theory were performed using the projector augmented
wave (PAW) method [27] implemented in the QUANTUM ESPRESSO (QE) [28] code. The PAW potentials were created by means of the
atompaw code [29] with an exchange-correlation functional according to Perdew and Wang [30]. For lithium, the 1s, 2s
and 2p states are projectors and thus no core states were used. The PAW sphere radii were set to 2.2 . For silicon the 3s and
3p projectors were used; 1s2s2p are core states and the PAW sphere radii were set to 1.5 .
The kinetic energy cutoff was adjusted for each LixSiy structure in the fashion to obtain a convergence better than
2 meV atom-1. For specific cutoff values per phase see supplementary material TAB. A1. In addition, adjusted Monkhorst-Pack grids for the Brillouin zone integration for each phase (see supplementary material TAB. A1) were used to provide the same
k-point grid density in each direction. The self-consistency of total energy was set to 10-8 Ry.
The phonon wave numbers are obtained from a fully relaxed unit cell. The variable cell optimization was carried
out with convergence thresholds in respect to forces of 10-8 Ry and pressures on the unit cell below 0.1 kbar.
The ab-initio elastic constants are calculated utilizing the ElaStic code [31] with QE.
The vibrational wave numbers have been calculated using perturbation theory [32] with a factor of two smaller q grid compared with the
k grid. For comparison, the same fully relaxed cell with the same convergence thresholds has been used for the finite
displacement method. The PHONOPY code [33] was used to create 2x2x2 supercells with finite displacements and the
forces were then calculated with QE. A 3x3x3 supercell has been tested. A difference in the
free energy up to 3.6 meV at 1000 K and a difference in the heat capacity up to 0.16 JK-1mol-1 atom-1 at 70 K has been found. Since
the computational time for the 3x3x3 supercell is 30 times higher than for the 2x2x2 supercell and the difference are
small enough, the 2x2x2 supercell has been used in further calculations.
All force-field molecular dynamics calculations were performed in the LAMMPS code [34] by using
MEAM [13]. As MEAM potential, we used the LixSiy optimized MEAM derived by Cui et al. [5].
All calculation using these parameters are denoted with M1. Only for pure silicon we also used the Si MEAM potential from the work of
Cui et al. [5], which describes the Si-Si bond better than the LixSiy MEAM potential.
We denoted these parameters for the bulk silicon MEAM calculations with M2.
Starting from structural input from the ICSD, we used the PWTOOLS toolkit [35] and the latgen code [36] to convert
the cif file to LAMMPS structural input format. Also for the LAMMPS calculations we tested several supercell sizes for each calculated structure. The final supercell sizes are listed in supplementary material TAB. A2.
We used the ‘fix_phonon‘ [19, 20] option to calculate the phonon density of states within the LAMMPS code.
Each of these MD runs was carried out for 13 ns. For the calculation of the linear expansion coefficient we performed, depending on the actual structure, 15-20 NPT MD runs (see TAB. 6). The bulk modulus was calculated with the LAMMPS included ELASTIC module.
This module has been adjusted to calculate (see Eq. (5)). For the calculation of (see Eq. (6)) we performed
with the LAMMPS code a set of thermostatic calculations with a conjugated gradient scheme and evaluated these data with the Birch-Murnaghan equation of state [16].
5 Results
Lithium silicides consist of small alkali-metal lithium atoms and bigger half-metal silicon atoms. The silicon atoms are not always isolated from each other. In fact, in some phases they tend to build rigid Si-Si clusters (e.g. dimers, rings etc.).
There is an ongoing discussion whether or not lithium silicides can be classified with the well known Zintl concept [37] (see Refs. Nesper and von Schnering [38], Nesper [39] and Chevrier et al. [3]). Zintl phases consist of one alkaline/alkaline earth metal and one element of the 3rd or 5th period.
With that, Zintl phases show both ionic and covalent bonding parts.
These conceptional aspects are important in respect to our goal to describe
the class of lithium silicides with only one force-field.
If some LixSiy phases may follow the Zintl concept and some may not, one
force-field may not be sufficient to treat all LixSiy phases.
The structural parameters for each phase are given in TAB. 2.
It should be noted that we transformed all phases in an orthogonal setup, which was necessary for the LAMMPS calculations.
The Li21Si5, the Li22Si5 phase, and the Li17Si4 phase show a very similar lithium content (see TAB. 2)
and their lattice parameters are only slightly different. These structures are very hard to distinguish with experimental methods (e.g. X-ray diffraction or
neutron-scattering). In case of Li13Si4 there exist diverse structural settings,
but we will exclusively focus on the structure found by Schnering et al. [40] labeled for further investigations with Li13Si4 ICSD and the structure found by the evolution algorithm EVO [41] by Gruber et al. [6] labeled with Li13Si4 EVO.
In our simulations we can use the given structures and we are able to explicitly calculate each of these phases. This achievement enables us to provide
further information regarding the stability of these phases.
| crystal structure | SG | |||||
|---|---|---|---|---|---|---|
| [%] | [Å] | [Å] | [Å] | |||
| Si (Ref. [42]) | 227 | 0 | 5.43 | 5.43 | 5.43 | 1 (8) |
| Li12Si7 (Ref. [43]) | 62 | 29.8 | 8.60 | 19.76 | 14.34 | 22 (152) |
| Li7Si3 (Ref. [40], a) | 1 | 36.6 | 7.42 | 4.29 | 17.69 | 40 |
| Li13Si4 EVO (Ref. [6], a) | 55 | 44.5 | 7.75 | 14.56 | 4.34 | 9 (34) |
| Li13Si4 ICSD (Ref. [44]) | 55 | 44.5 | 7.99 | 15.21 | 4.43 | 9 (34) |
| Li15Si4 (Ref. [45]) | 220 | 48.1 | 10.60 | 10.60 | 10.60 | 3 (76) |
| Li21Si5 (Ref. [38]) | 216 | 50.9 | 18.71 | 18.71 | 18.71 | 16 (416) |
| Li17Si4 (Ref. [38], b) | 216 | 51.2 | 18.71 | 18.71 | 18.71 | 17 (420) |
| Li22Si5 (Ref. [46]) | 216 | 52.1 | 18.75 | 18.75 | 18.75 | 20 (432) |
| Li (Ref. [47]) | 229 | 100 | 3.51 | 3.51 | 3.51 | 1 (2) |
a … Original cell is transformed in an orthogonal setting and values given for DFT optimized structure
b … Same cell as Li21Si5 with one additional Wykoff Li position
We have calculated the specific storage capacity for all LixSiy crystal structures (see TAB. 1). With increasing lithium content, also increases from 1636 to 4200 mAh g-1. In accordance with this observation, the phases with similar Li to Si ratio (Li21Si5, Li22Si5 and Li17Si4) only slightly differ in the respective absolute value.
5.1 Results I - elastic properties
For our MD method it is necessary to validate the force-fields which should be used for the computation of the isobaric heat capacity.
The elastic constants describe the interplay of the resulting forces acting on different atoms by applying external deformation of the systems.
The right elastic behavior is the key property for any phonon calculation. We calculate the elastic properties for LixSiy phases with MEAM MD
and compared them to our DFT results (see TAB. 3).
In our MEAM MD calculations the energy volume relation was obtained using different structurally relaxed volumes.
The geometry optimization was performed with a conjugate gradient (cg) minimizer.
We calculated the total energy for different volumes for each phase and used the resulting to calculate with a Birch-Murnaghan equation of state.
All phases besides the pure silicon are calculated with the same M1 MEAM potential. For silicon we used the M2 MEAM potential, because it describes the Si-Si bond better.
One remarkable result is that the obtained elastic constants of the crystalline LixSiy phases are
in good agreement with those calculated by Cui et al. [5] for the amorphous phases.
In conclusion, this potential allows the description of the LixSiy system with amorphous and crystalline structures.
Generally, the DFT and M1/M2 values deliver similar values for each elastic property and the trends within the elastic constants are the same.
The M1 calculations for the EVO Li13Si4 (M1 a, Ref. [6]) and ICSD Li13Si4 (M1 b, Ref. [44]) structures (see TAB. 3)
give the same magnitude and only slightly differ in the total value.
Our DFT and M1 calculations show a similarity of the Li21Si5 and the Li22Si5 phase in all elastic properties,
whereas the Li17Si4 phase differs more from these stoichiometrically similar phases.
In summary, the used MEAM potential M1 is able to describe the elastic properties of the LixSiy phases properly and is thus suitable to be used for our proposed MD method.
Furthermore, we evaluated the radial pair distribution function from low temperature MD runs and compared our initial MD structures with the experimental ones (see supplementary material FIG. A1), where we achieved a good agreement. Thus our initial MD structures are valid for all further investigations. The final structure from the performed MD run is in good agreement with the averaged structure from each MD run, thus we can conclude that our MD runs are long enough (see supplementary material FIG. A1).
| Li | Li12Si7 | Li7Si3 | Li13Si4 | Li15Si4 | Li21Si5 | Li17Si4 | Li22Si5 | Si | ||||||||||||||||||
|---|---|---|---|---|---|---|---|---|---|---|---|---|---|---|---|---|---|---|---|---|---|---|---|---|---|---|
| M1 | DFT | M1 | DFT | Ref [5] | M1 | M1 | M1 | DFT | Ref [5] | M1 | DFT | Ref [5] | M1 | DFT | M1 | DFT | M1 | DFT | Ref [5] | M2 | DFT | |||||
| 11.8 | 15.0 | 60.6 | 39.8 | 30.4 | 43.3 | 42.2 | 35.8 | 37.8 | 33.5 | 36.0 | 34.4 | 40.4 | 35.2 | 35.8 | 34.3 | 94.9 | 94.3 | |||||||||
| 12.8 | 15.3 | 55.8 | 40.5 | 47.7 | 43.3 | 40.7 | 36.7 | 37.9 | 33.9 | 36.4 | 34.9 | 36.6 | 35.5 | 35.8 | 35.1 | 95.3 | 96.2 | |||||||||
| 16.4 | 16.3 | 87.3 | 100.3 | 87.0 | 92.0 | 99.3 | 84.7 | 75.2 | 87.6 | 75.0 | 74.0 | 47.7 | 50.3 | 48.0 | 47.0 | 56.5 | 65.5 | 64.8 | 60.4 | 51.6 | 55.0 | 52.0 | 46.0 | 122.9 | 161.3 | |
| 16.4 | 16.3 | 79.5 | 106.5 | 78.0 | 97.0 | 99.3 | 72.7 | 69.9 | 80.4 | 70.0 | 61.0 | 47.7 | 50.3 | 48.0 | 47.0 | 56.5 | 65.5 | 66.2 | 60.4 | 51.6 | 55.0 | 52.0 | 46.0 | 122.9 | 161.3 | |
| 16.4 | 16.3 | 86.9 | 101.5 | 85.0 | 90.0 | 92.3 | 78.5 | 74.1 | 95.2 | 74.0 | 77.0 | 47.7 | 50.3 | 48.0 | 47.0 | 56.5 | 65.5 | 67.6 | 60.4 | 51.6 | 55.0 | 52.0 | 46.0 | 122.9 | 161.3 | |
| 11.0 | 14.8 | 44.0 | 5.7 | 45.0 | 5.0 | 36.9 | 24.7 | 21.7 | 18.6 | 22.0 | 17.0 | 32.9 | 25.7 | 33.0 | 21.0 | 26.3 | 19.7 | 23.3 | 23.1 | 27.9 | 25.1 | 28.0 | 23.0 | 81.4 | 63.6 | |
| 11.0 | 14.8 | 40.6 | 13.5 | 42.0 | 11.0 | 16.1 | 22.5 | 23.7 | 7.2 | 24.0 | 11.0 | 32.9 | 25.7 | 33.0 | 21.0 | 26.3 | 19.7 | 21.1 | 23.1 | 27.9 | 25.1 | 28.0 | 23.0 | 81.4 | 63.6 | |
| 11.0 | 14.8 | 39.7 | 8.7 | 39.0 | 8.0 | 16.1 | 29.7 | 28.0 | 7.6 | 28.0 | 10.0 | 32.9 | 25.7 | 33.0 | 21.0 | 26.3 | 19.7 | 20.9 | 23.1 | 27.9 | 25.1 | 28.0 | 23.0 | 81.4 | 63.6 | |
| 11.1 | 14.5 | 17.1 | 31.2 | 17.0 | 28.0 | 21.5 | 20.8 | 20.3 | 25.5 | 20.0 | 23.0 | 22.7 | 34.4 | 23.0 | 28.0 | 21.7 | 33.0 | 17.6 | 38.0 | 29.6 | 41.7 | 30.0 | 35.0 | 81.3 | 76.7 | |
| 11.1 | 14.5 | 18.8 | 32.0 | 20.0 | 26.0 | 21.5 | 18.1 | 13.6 | 28.0 | 14.0 | 24.0 | 22.7 | 34.4 | 23.0 | 28.0 | 21.7 | 33.0 | 17.5 | 38.0 | 29.6 | 41.7 | 30.0 | 35.0 | 81.3 | 76.7 | |
| 11.1 | 14.5 | 12.4 | 27.1 | 15.0 | 24.0 | 31.2 | 16.7 | 13.6 | 32.1 | 14.0 | 28.0 | 22.7 | 34.4 | 23.0 | 28.0 | 21.7 | 33.0 | 18.9 | 38.0 | 29.6 | 41.7 | 30.0 | 35.0 | 81.3 | 76.7 | |
5.2 Results II - specific heat capacities
5.2.1 Specific heat of lithium and silicon
The experimental reference data for the isobaric heat capacity was obtained by Thomas et al. [4]. Initial calculations were carried out on the pure Li and Si systems to ensure that the MD results agree with the ones obtained by DFT and with the experimental data. This comparison is the first evaluation of the MEAM potentials for the calculation of thermodynamic properties within our MD approach.
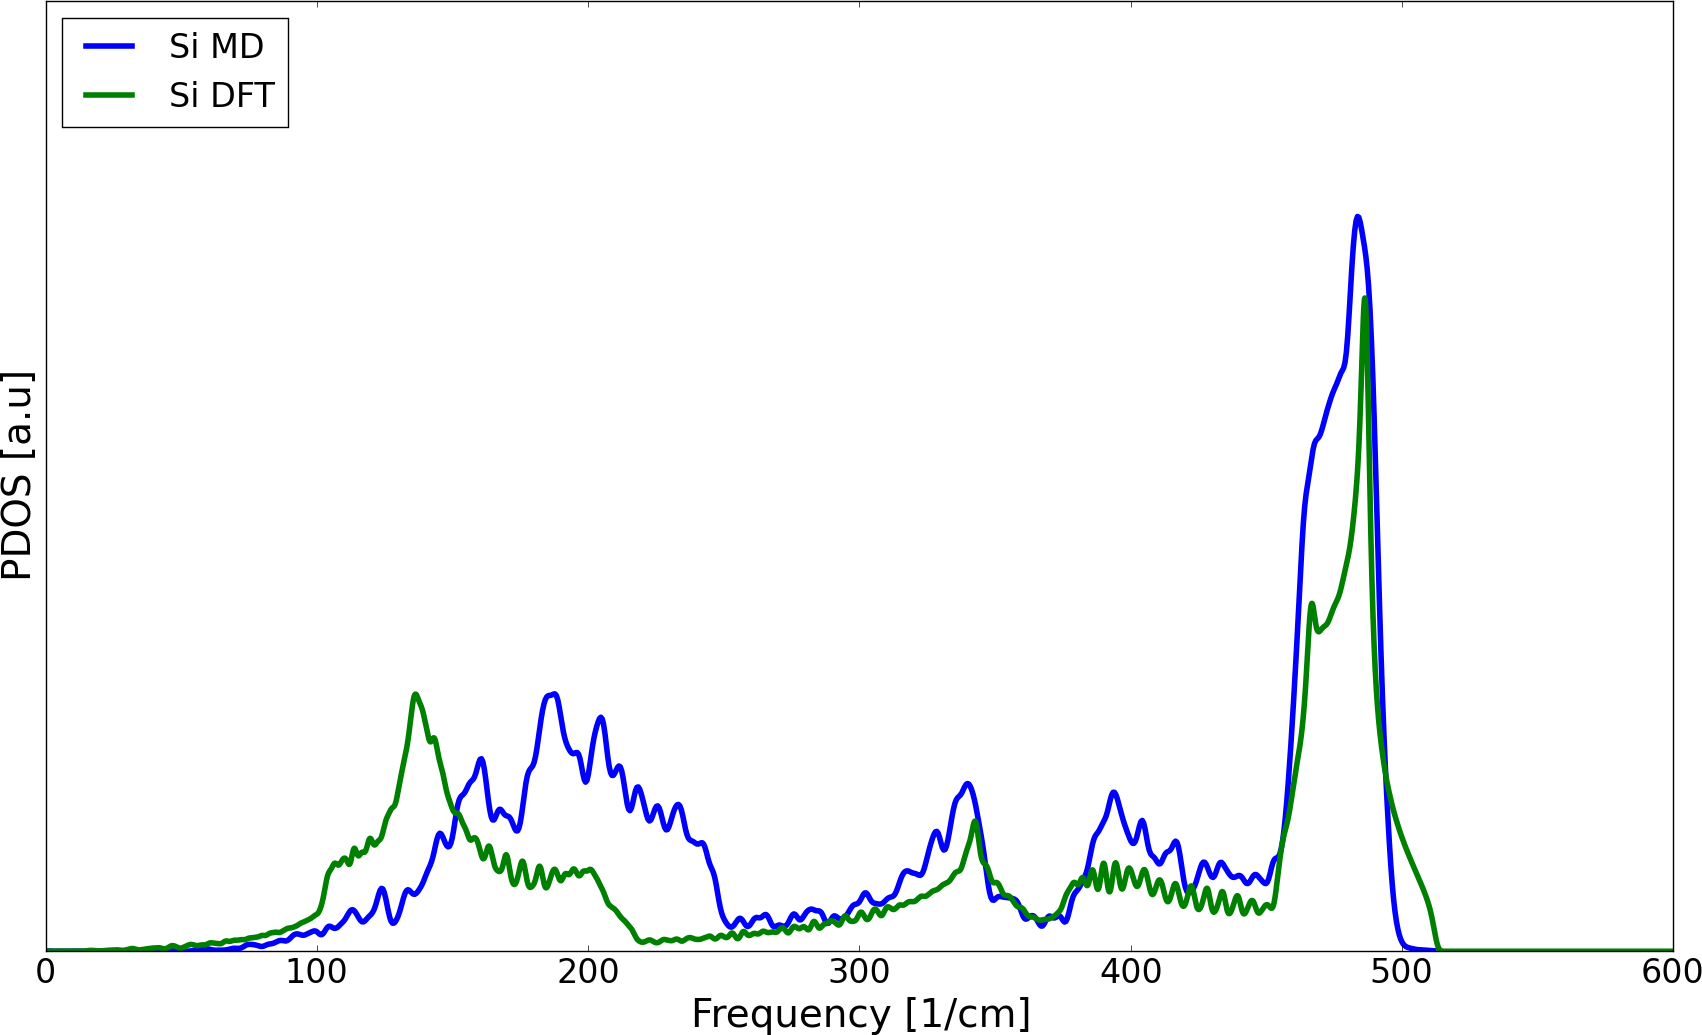
One core property for a good description of the heat capacities is the phonon density of states. We calculated the PDOS for pure silicon with DFT using QUANTUM ESPRESSO and from MD using LAMMPS with the ”fix_phonon” option. The results of these calculations are visualized in FIG. 2. The resulting DFT and MD PDOS are in good agreement, because the main features appear in both density of states. Based on this result we continued to use DFT (in the framework of the quasi-harmonic approximation) and our MD method to calculate the isobaric heat capacity for silicon and lithium.
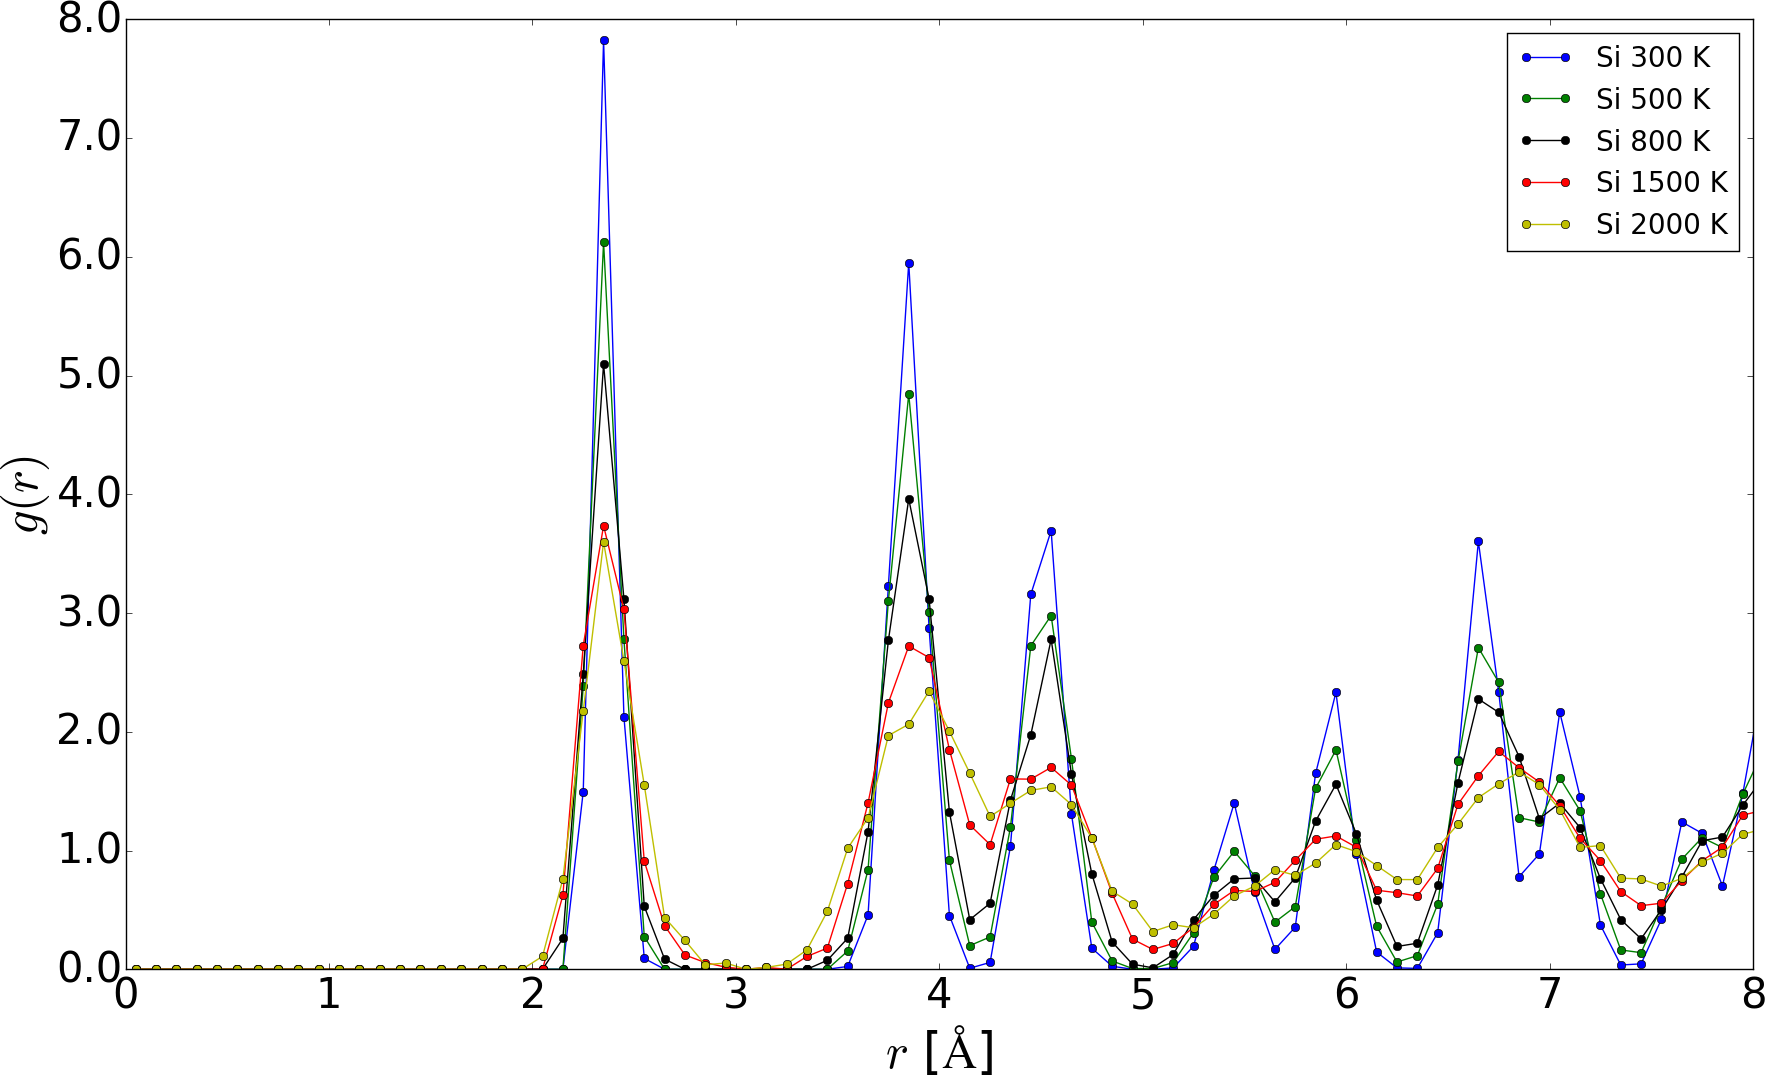
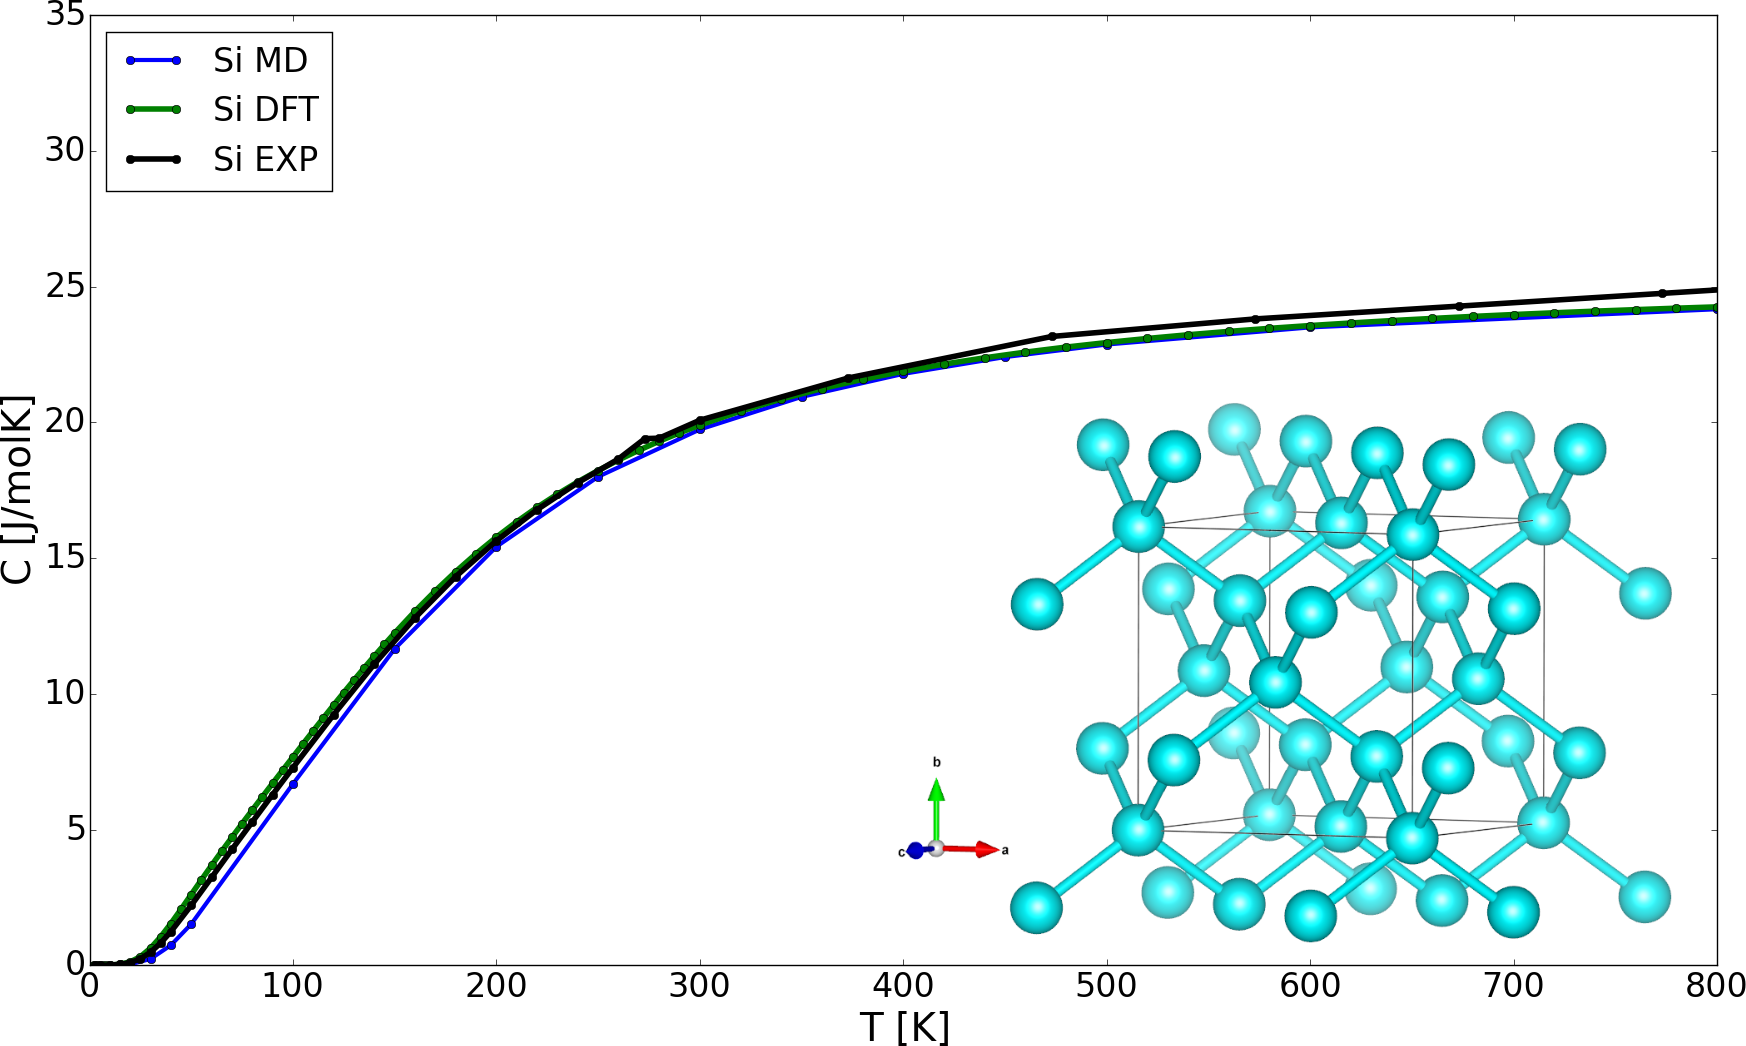
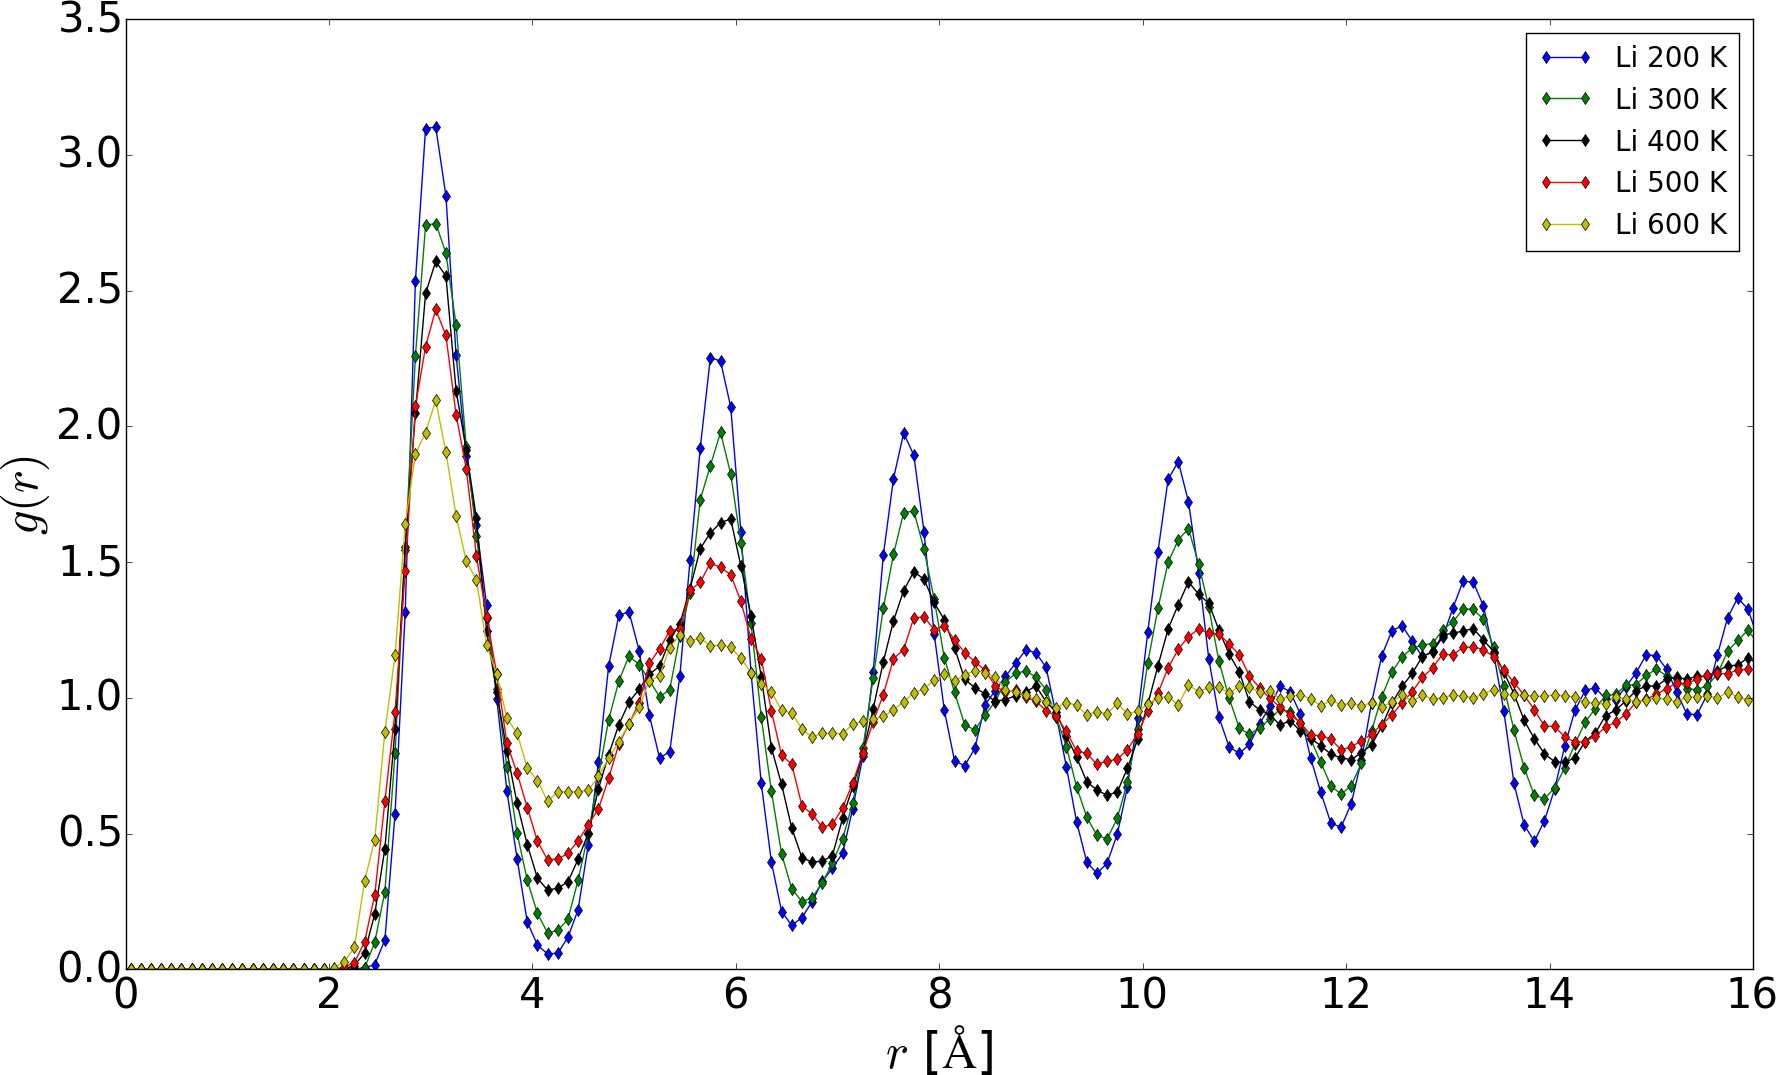
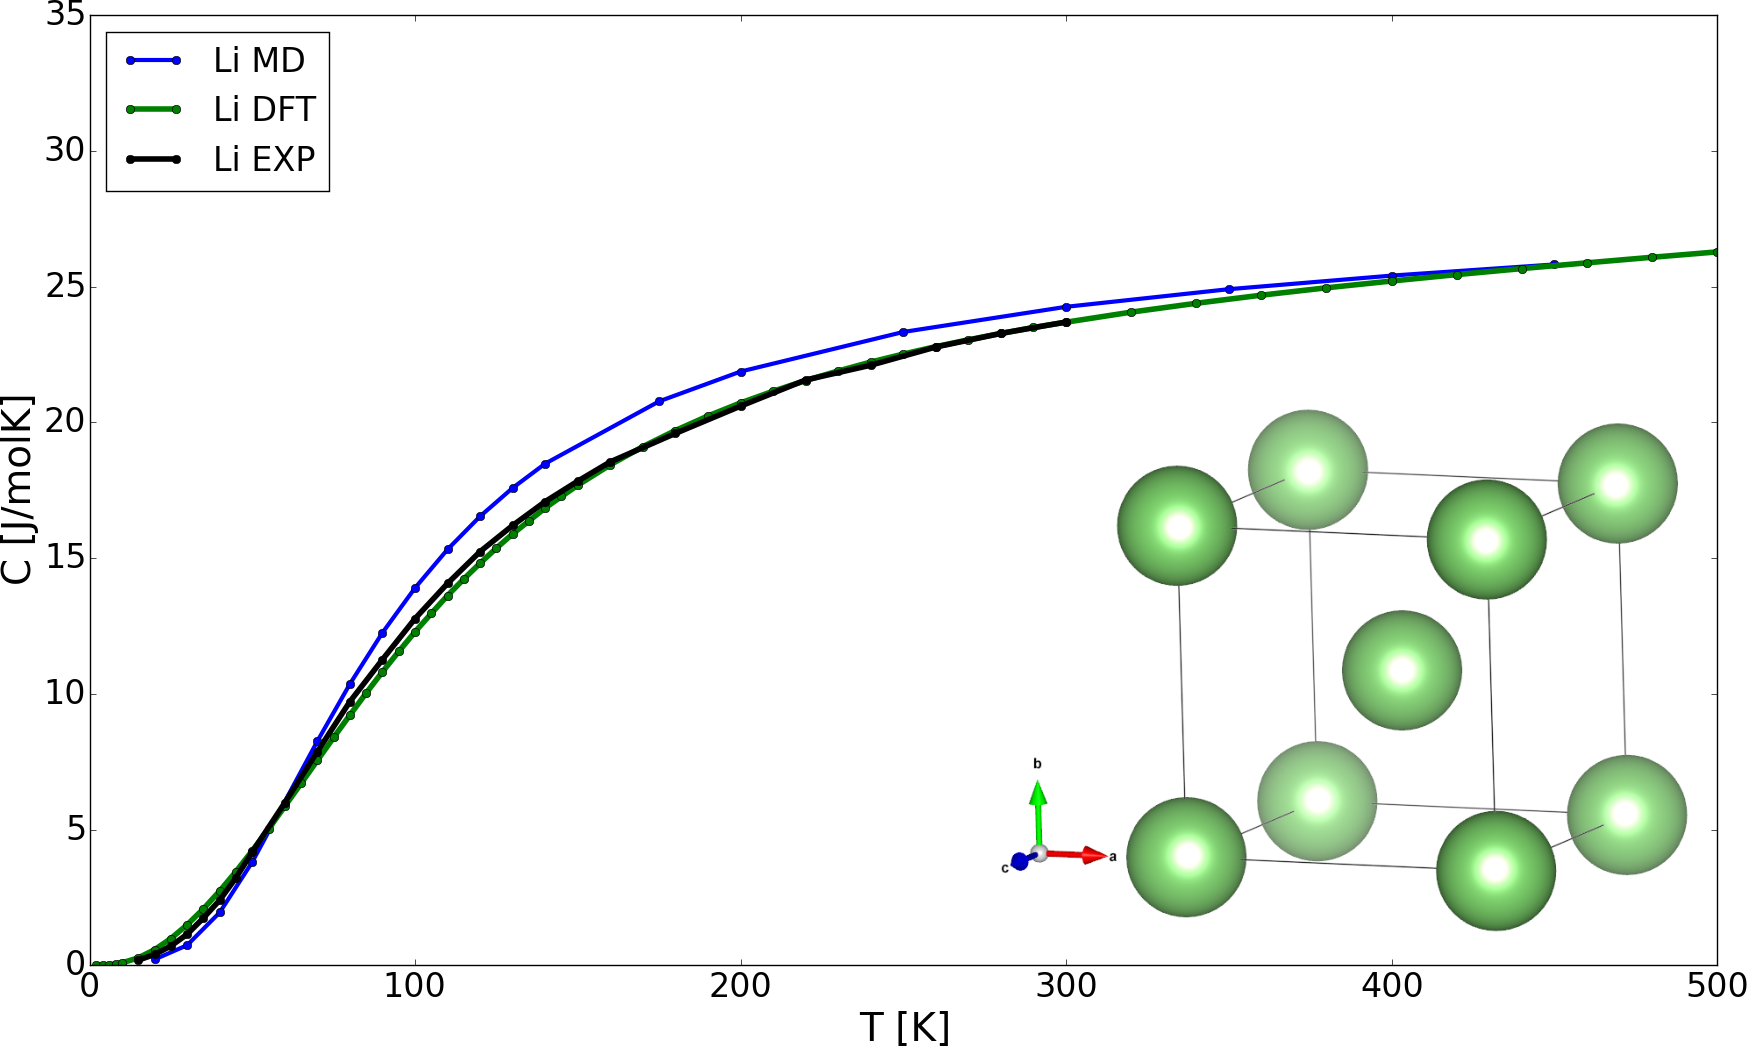
In FIG. 3 (b) and 4 (b) the isobaric heat capacities for pure silicon and lithium are plotted versus temperature. In the case of silicon (see FIG. 3 (b)), the values of our MD calculations agree with the DFT and experimental values over a wide range of temperatures. FIG. 3 (a) shows the RPDF of pure Si. The crystallinity of this system can be clearly seen, even at rather high temperatures. This indicates that the Si itself is thermally very stable. However, from 1500 K on the features at larger distances smear out, indicating a decrease in crystallinity at such temperatures. It should be noted here that the isobaric specific heat capacity for lithium differs in the temperature region from 100 to 200 K slightly from the DFT values, which could lead to small systematic errors for the LixSiy phases in those temperature regions due to the given MEAM potential. However, there is a general agreement of our MD results with those obtained by DFT and the experiment for pure lithium in the entire temperature range. As can be seen in FIG. 4 (a), the crystallinity of lithium is preserved up to a temperature of ca. 500 K. Clearly at higher temperatures ( K) the RPDF shows liquid behavior and the crystalline features become absent, indicating a melting process appearing at around 500 K. Based on these preliminary results our MD approach should allow to calculate the specific heat capacity for the LixSiy phases.
5.2.2 Specific heat capacity of lithium silicides
In general all our calculated ab-initio isobaric heat capacity curves for the LixSiy phases are in good agreement with experimental curves
over the entire temperature range. Only for Li12Si7 and Li13Si4 the DFT values differ from the experimental values in the
high temperature region, which indicates that for these phases high-temperature effects may play a role. As already mentioned earlier these
effects cannot be described by the quasi-harmonic approximation and therefore cannot be treated within this framework. For these phases
our proposed MD method seems to give a better description of the high-temperature limit.
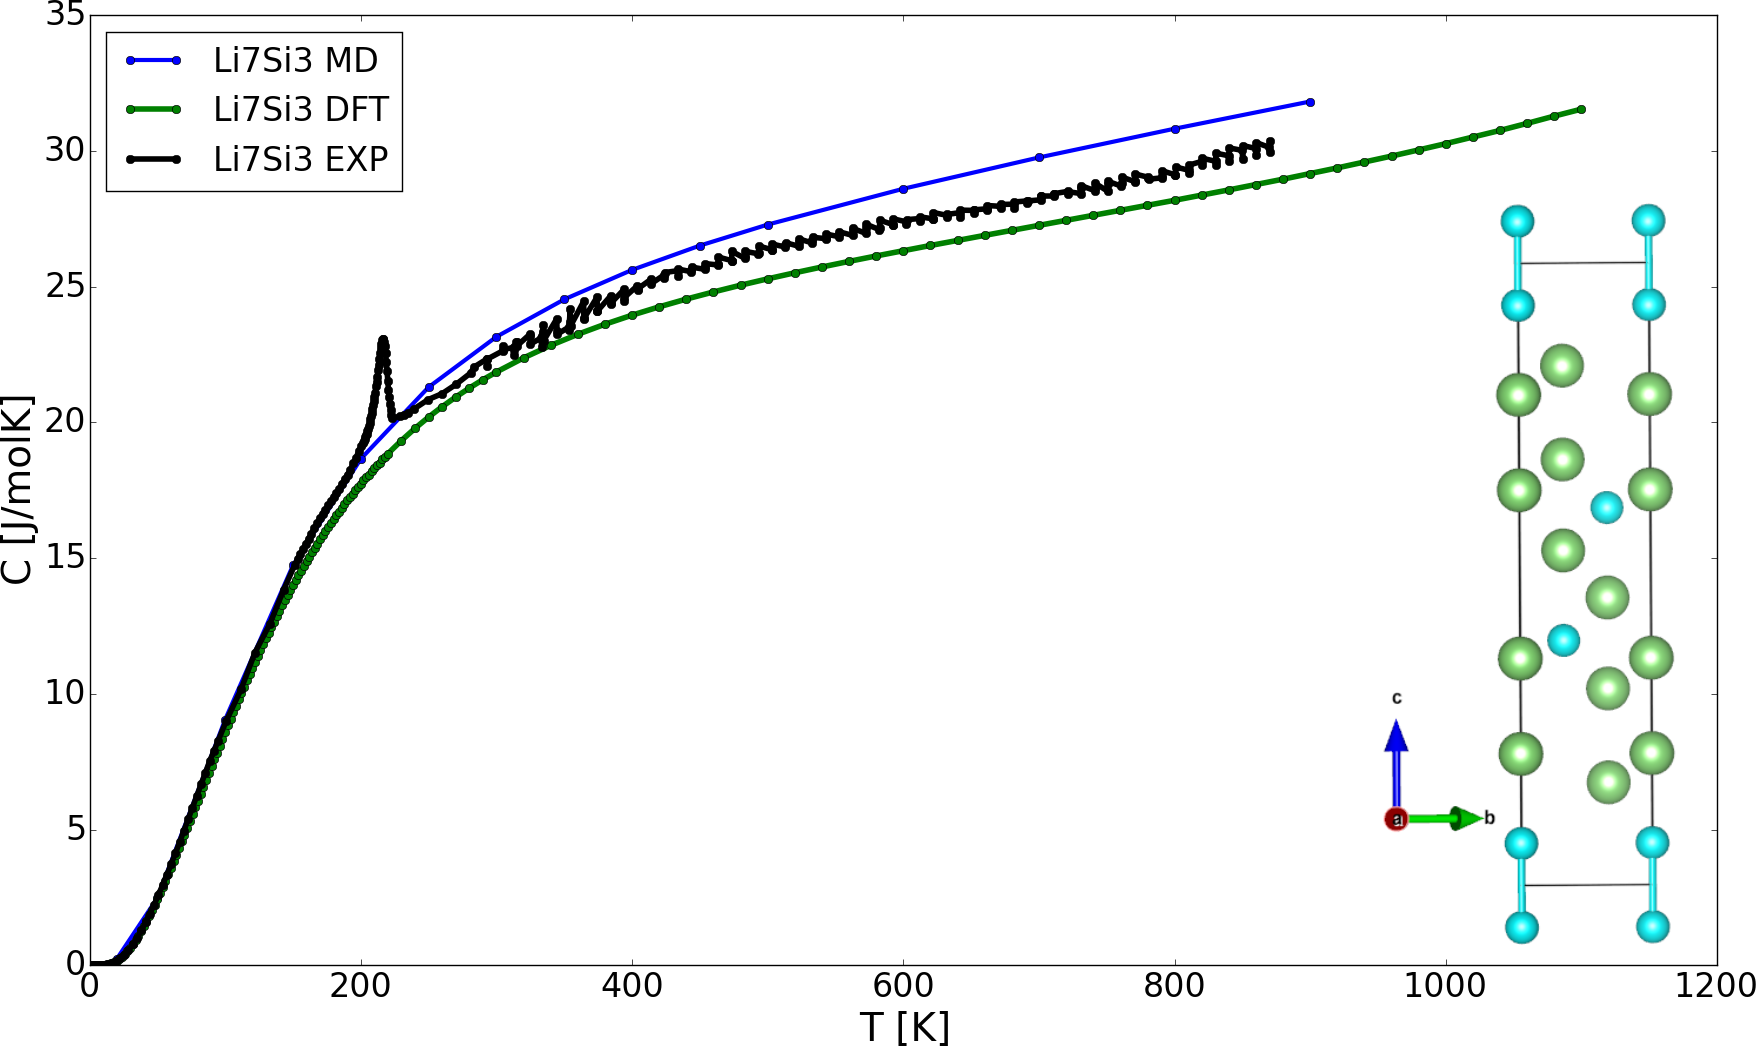
For Li7Si3, as seen in FIG. 5 (b), the heat capacity calculated with the MEAM potentials is in good agreement with experimental and DFT results.
There is a slight overestimation at higher temperatures, but the trend is preserved for both methods. A possible explanation could be that silicon forms stable dimers [3] in Li7Si3, which show local order even at higher temperatures.
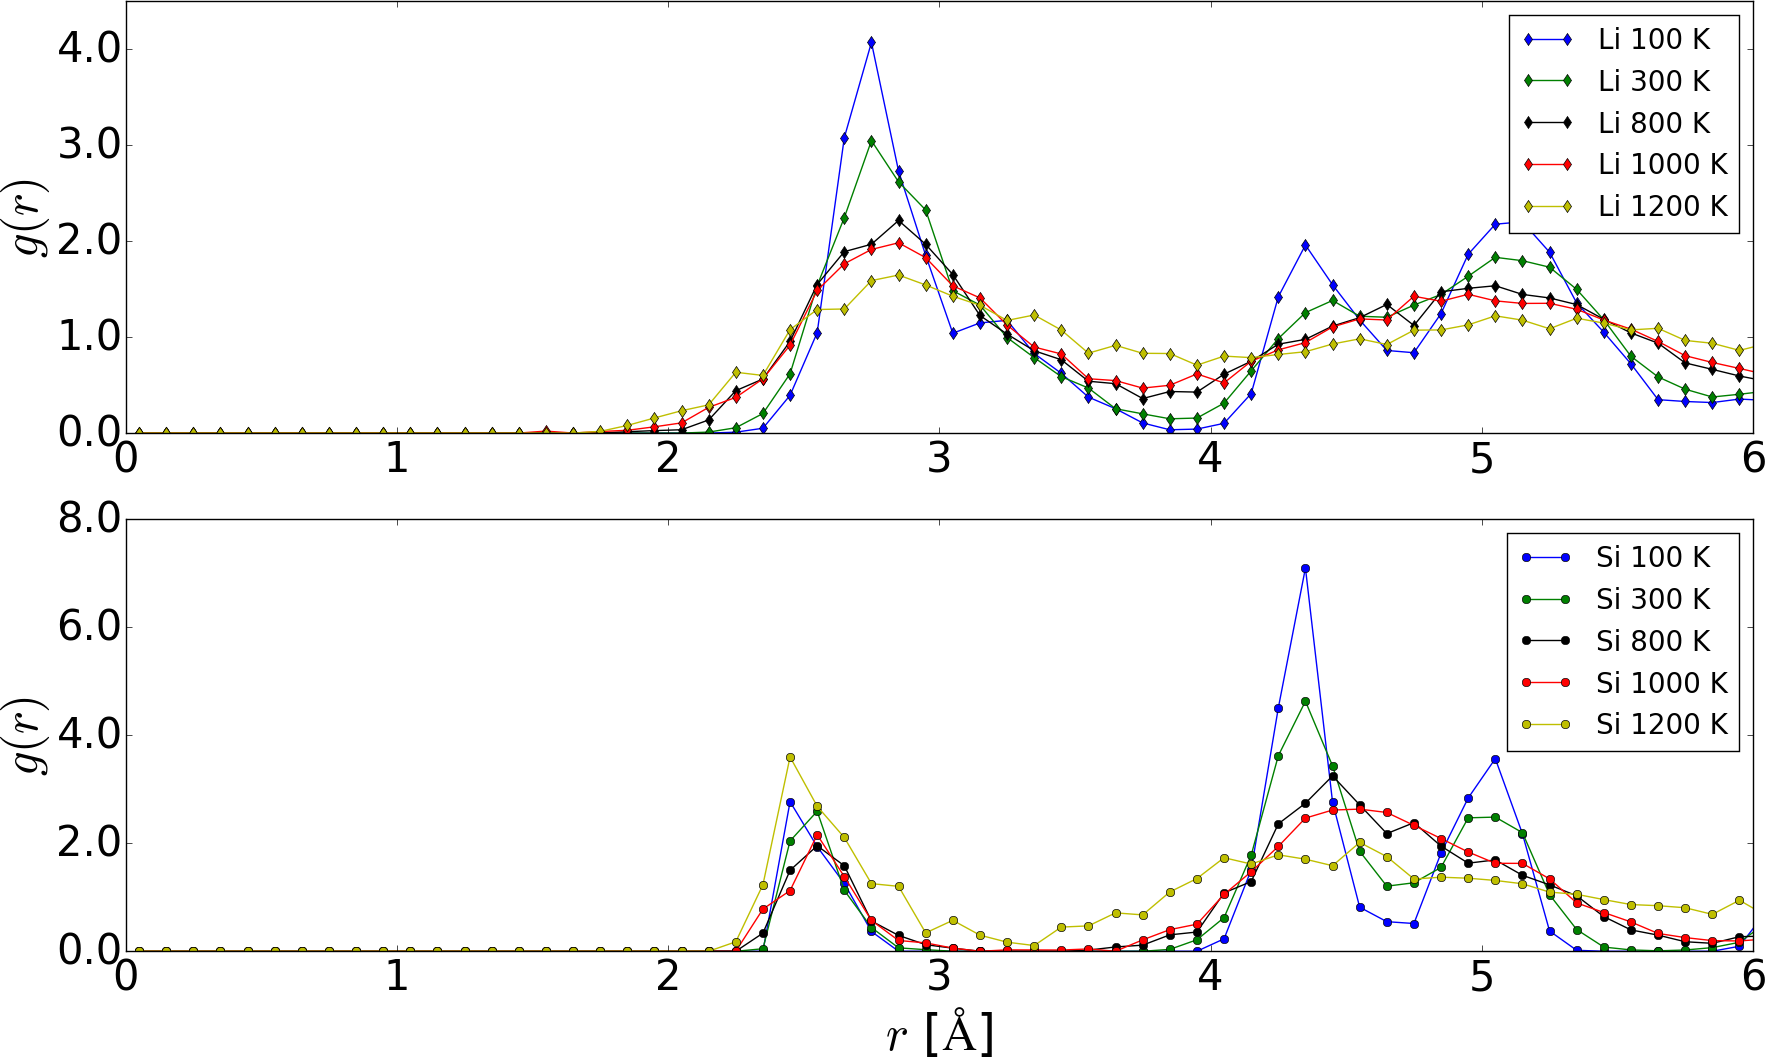
In FIG. 5 (a) the RPDF of Li and Si within Li7Si3 is displayed. For lithium a very similar trend as in pure lithium is observed, that is the ’double peak’ at approximately 4-5 Å, which smears out at higher temperatures. The general features for low distances are preserved as well. At 1000 K the RPDF for Li shows liquid features, while the crystalline ones are reduced. This fact indicates a melting process at this temperature. For Si, the RPDF is fairly constant over the investigated temperature range, indicating the high stability of the Si structure within the phase.
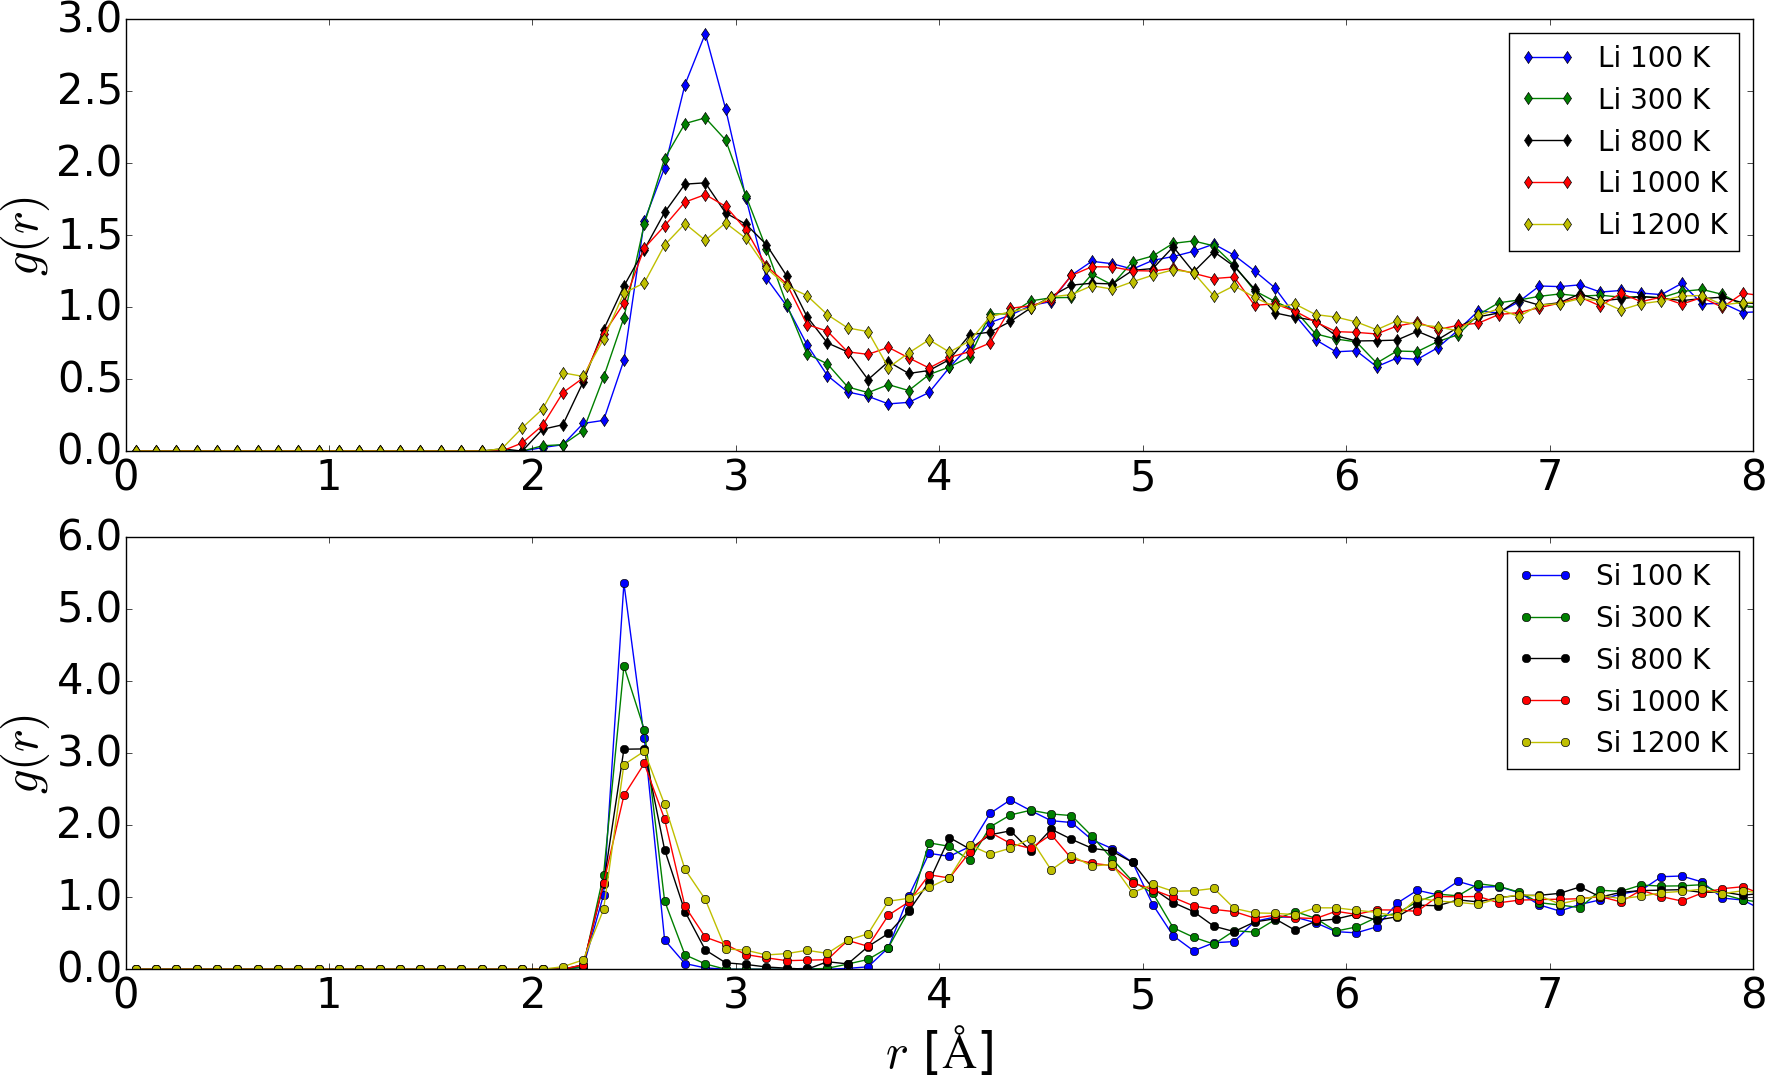
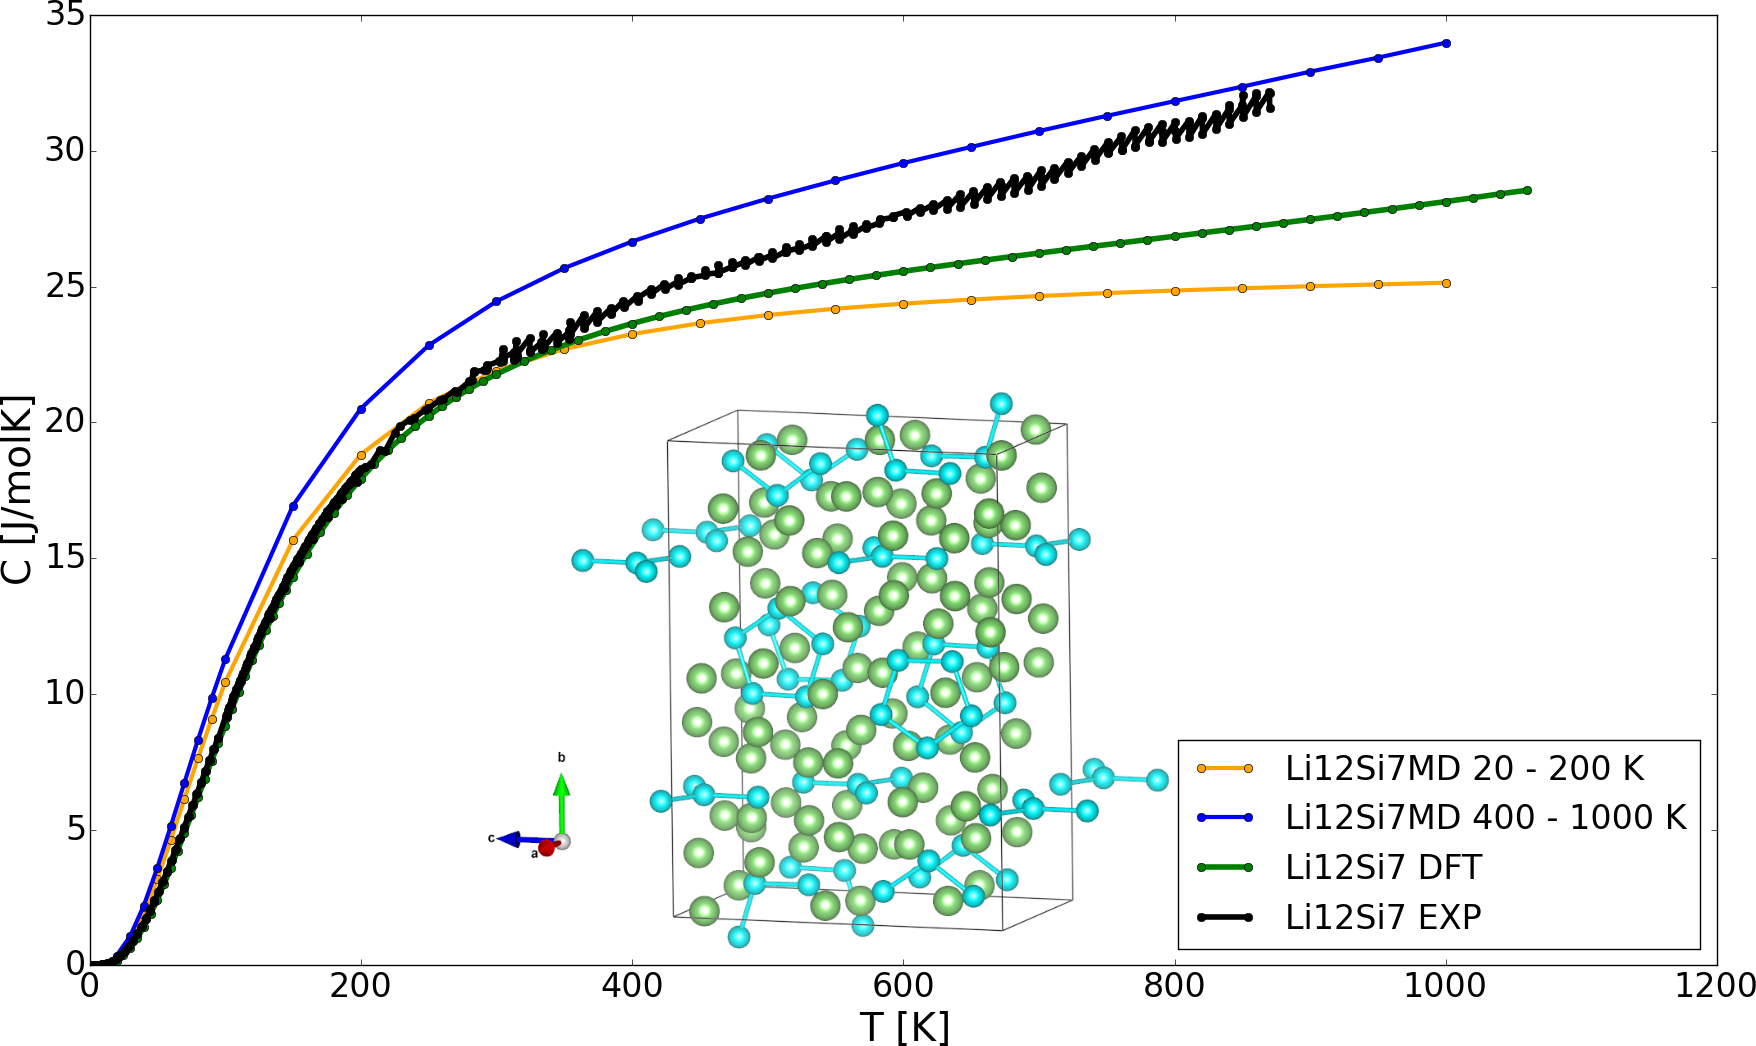
For Li12Si7 in FIG. 6 (b) we observed two different dependencies, one occurring at lower temperatures (up to approximately 400 K) leading to a specific and one occurring at higher temperatures, which results in a different (see TAB. 4).
Based on the Li RPDF (see FIG. 6 (a)), which indicates structural changes at temperatures K we separated two temperature regions on from 20 - 200 K leading to and another from 400 - 1000 K leading to .
This difference may be caused by anharmonic contributions or diffusion effects which take place at higher temperatures, giving rise to a different expansion behavior. The two distinguishable values of lead to different values, see Eq. (13). It is not possible to describe phase transitions with the standard quasi-harmonic approximation, which delivers a possible explanation why the DFT data are in good agreement with experiments in the low temperature region but not in the high temperature region. In the Li12Si7 phase the silicon atoms form Si5 rings with a lithium atom inside. These Si5 rings are stacked between two Li5 rings. Concerning this situation, it is not necessary to break a bond to disturb the structure, as the Li5 rings can slide between the Si5 and the crystalline structure may transform into another one or becomes amorphous.
FIG. 6 (a) displays the RPDF of Li and Si within Li12Si7. For lithium a somewhat different behavior in comparison to pure Li is found, as there is only one peak at a distance of 4-5 Å. Starting from ca. 1000 K, the features in the RPDF become more liquid-like. The shape and position of Si peaks are largely temperature independent up to high temperatures, showing again high stability of the Si structures.
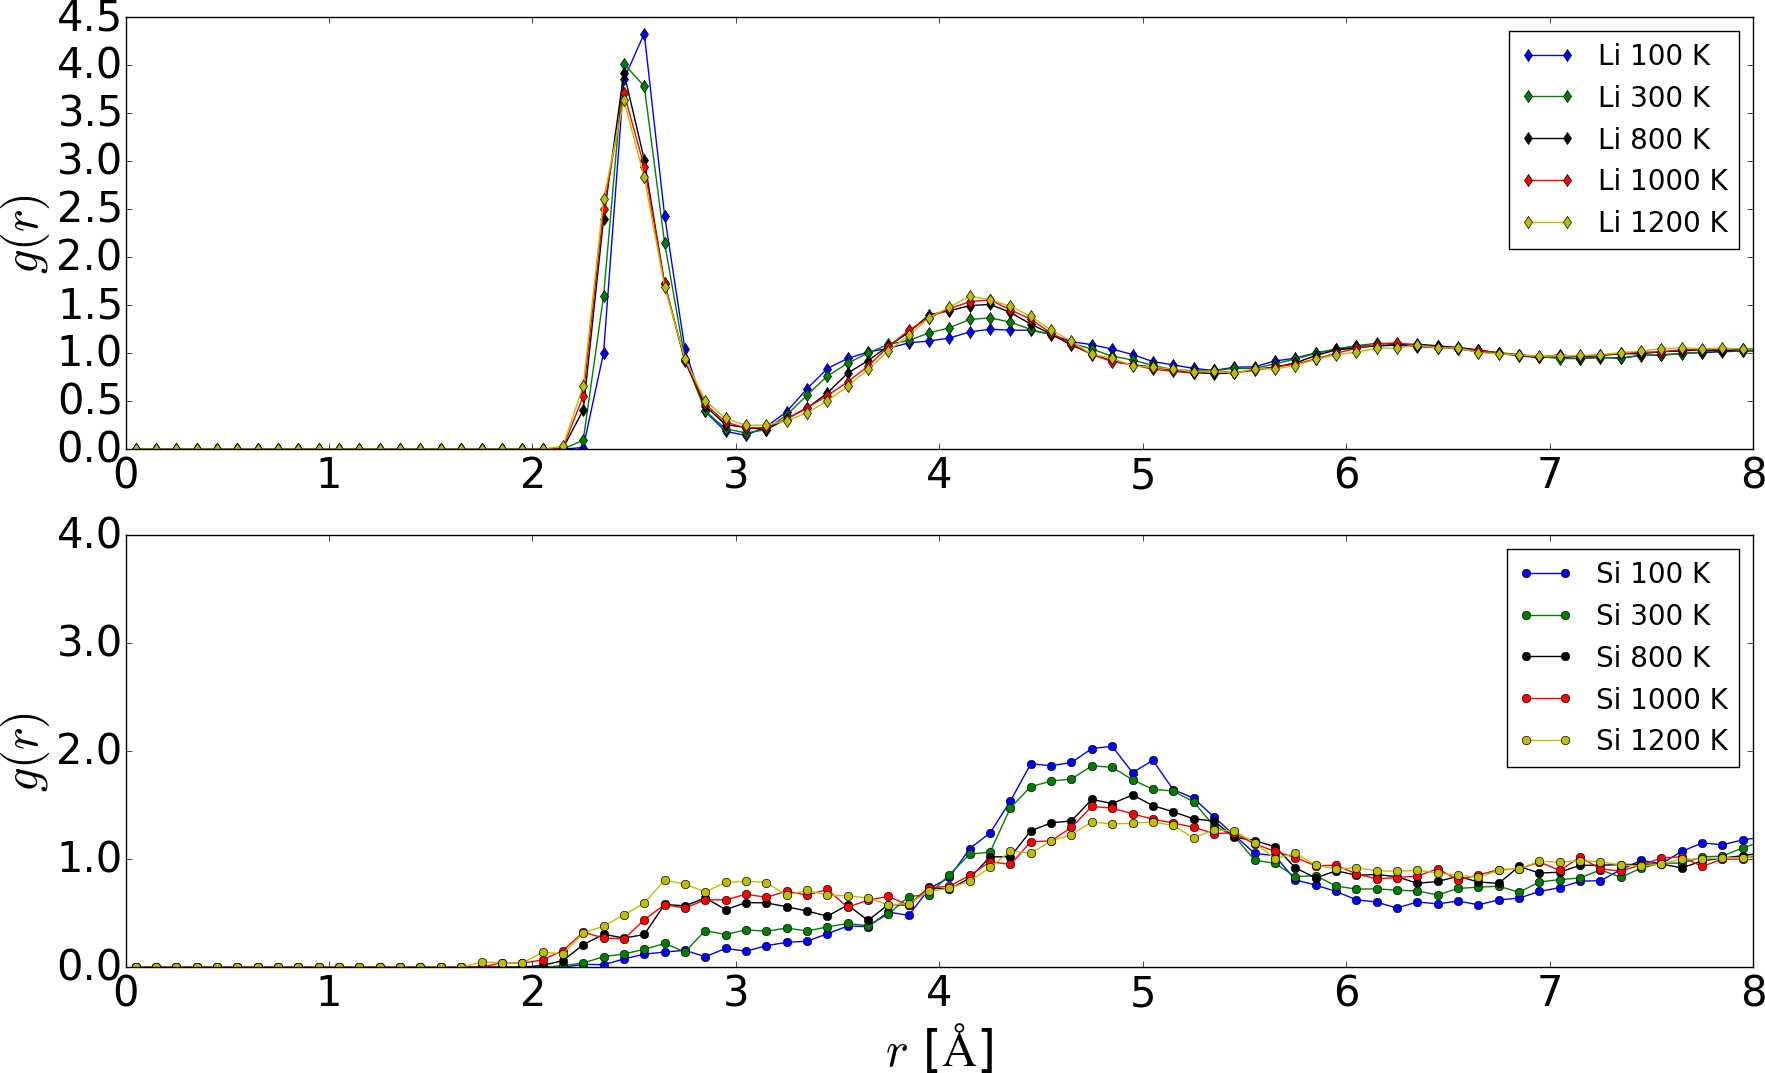
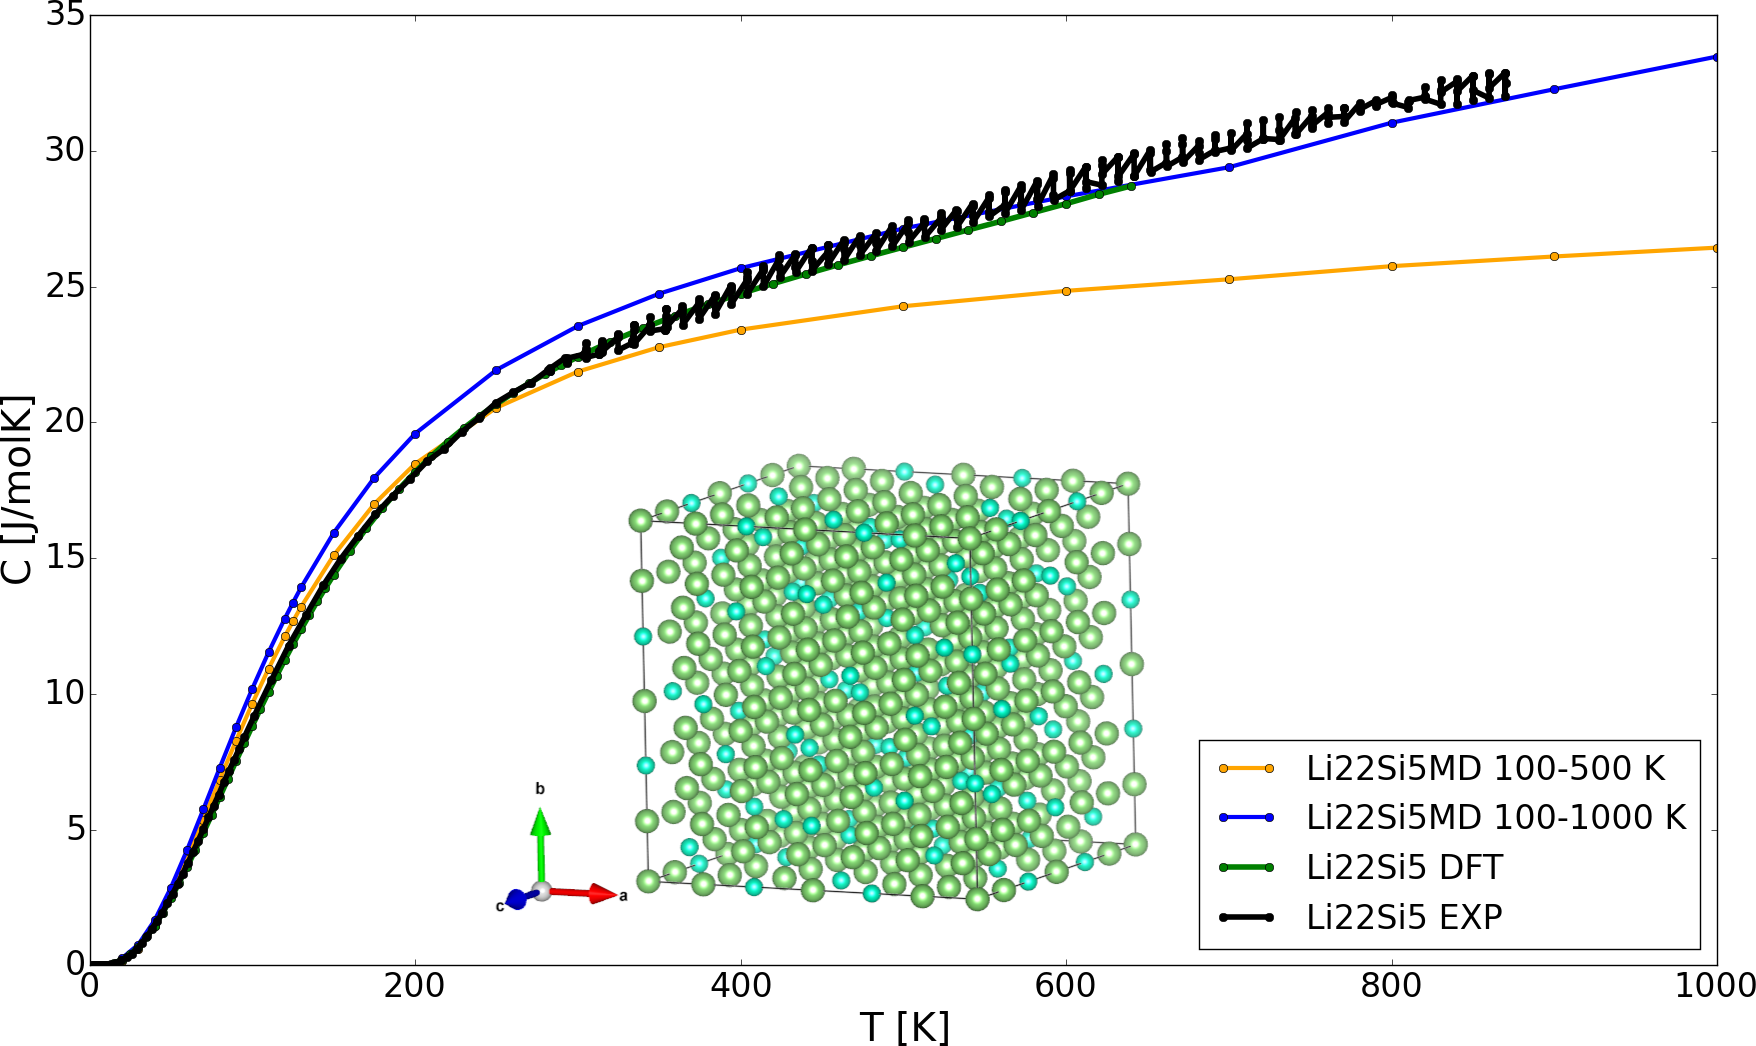
For Li22Si5 in FIG. 7 (b) a similar behavior like for Li12Si7 has been found.
Again, there are two different values describing the resulting heat capacity at different temperature regimes.
One major difference is that the Li RPDF (see FIG. 7 (a)) indicates no structural changes at higher temperatures, thus both linear values were evaluated with the same starting temperature K until 500 K for and until 1000 K for .
Here, the agreement of the two different plots to the other values is more obvious.
FIG. 7 (a) displays the RPDF of Li and Si within Li22Si5.
The Li RPDF is somewhat different from those of the other phases.
In detail, the initial sharp peak around 2.5 Å looks crystalline, while no other crystalline features are present for the Li22Si5 structure.
Thus the Li atoms prefer a specific Li-Li distance, which is constant over the investigated temperature range.
In addition, the following features have characteristics of a liquid (declining sinusoidal-like behavior). This indicates that even at low temperatures a permanent Li diffusion in the phase takes place.
Experimental crystal structure determination methods like XRD or neutron scattering are therefore only able to measure snapshots of the structure at a specific time, at which the diffusive Li atoms are quasi-frozen for the moment of the measurement.
In addition, the liquid-like behavior will make it very difficult to distinguish between Li22Si5, Li21Si5, and Li17Si4 as all of them have a high and very similar Li content.
For Si on the other hand there is a very broad peak at around 5 Å at low temperatures, indicating that the Si atoms within this phase are only ordered to a certain degree. Once the temperature is increased, the peak strongly smears out, thus the Si atoms become disordered. This is obvious, as within this phase Si is not present in clusters, but only as single atoms.
These atoms are surrounded by a large amount of diffusive Li. With that, the Si atoms cannot form any ordered structures and stay as single atoms.
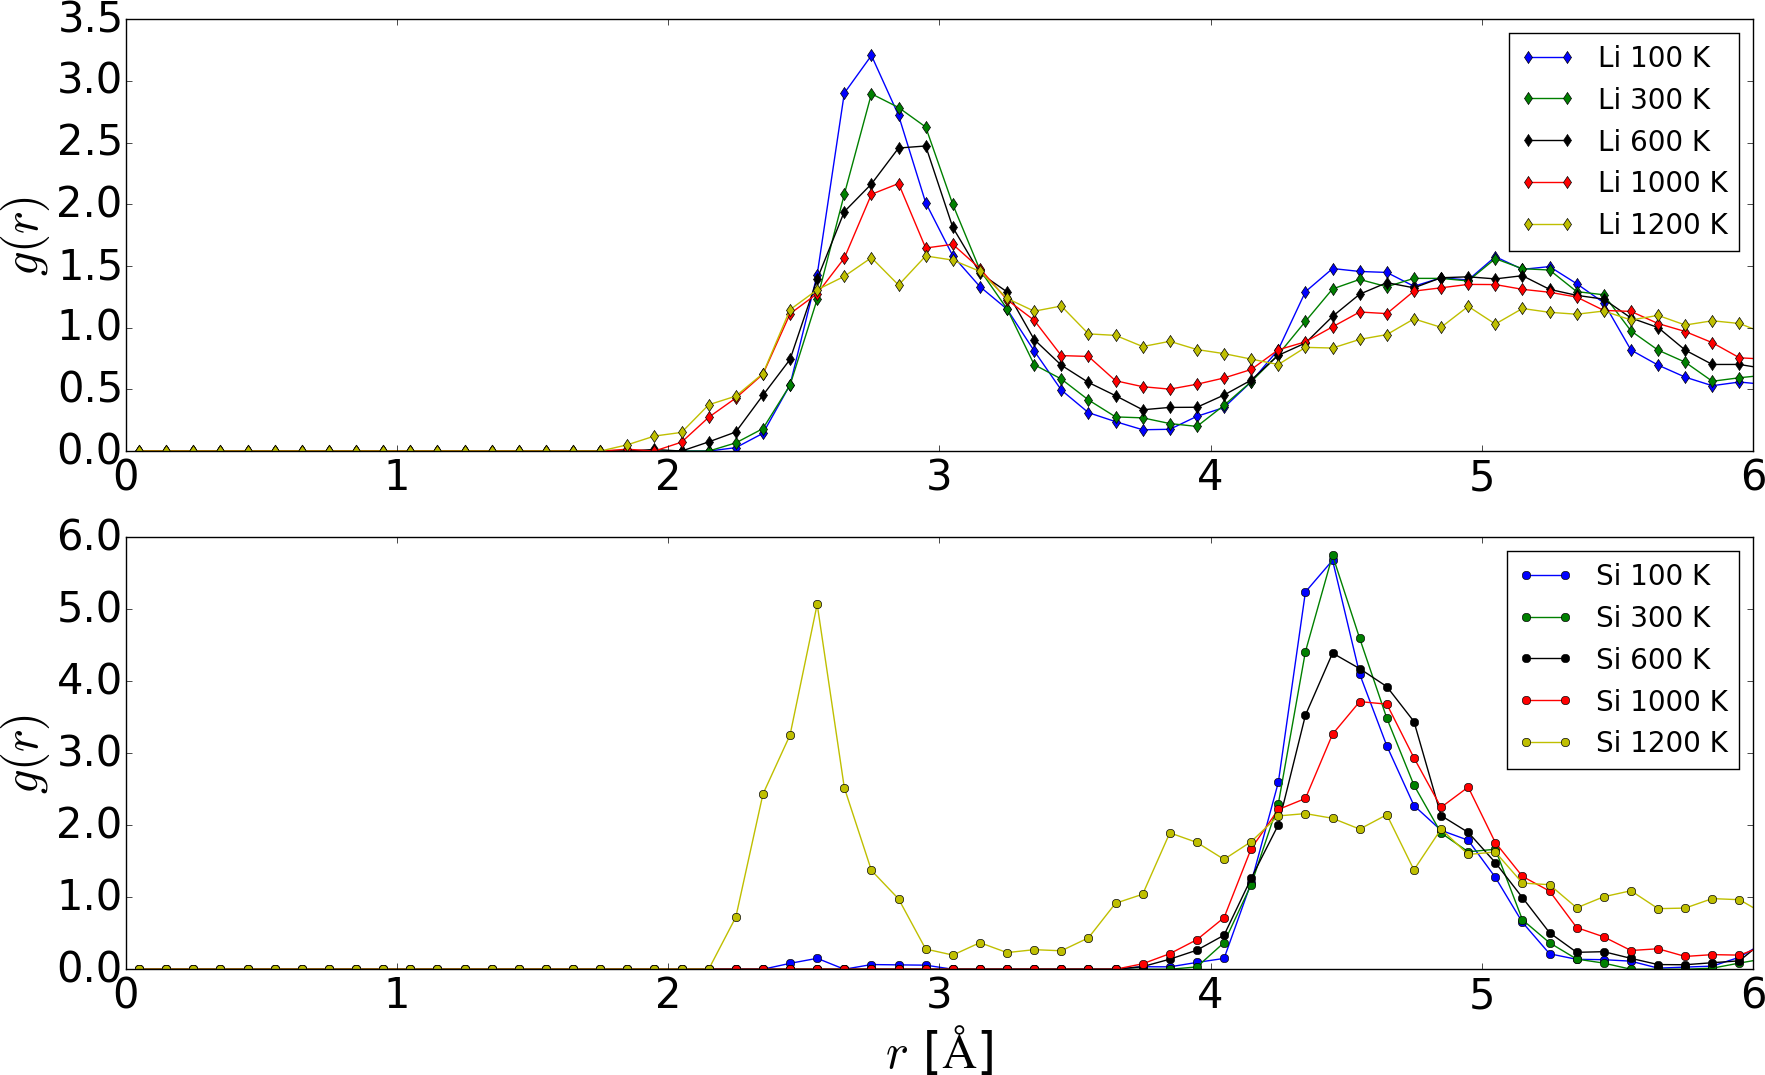
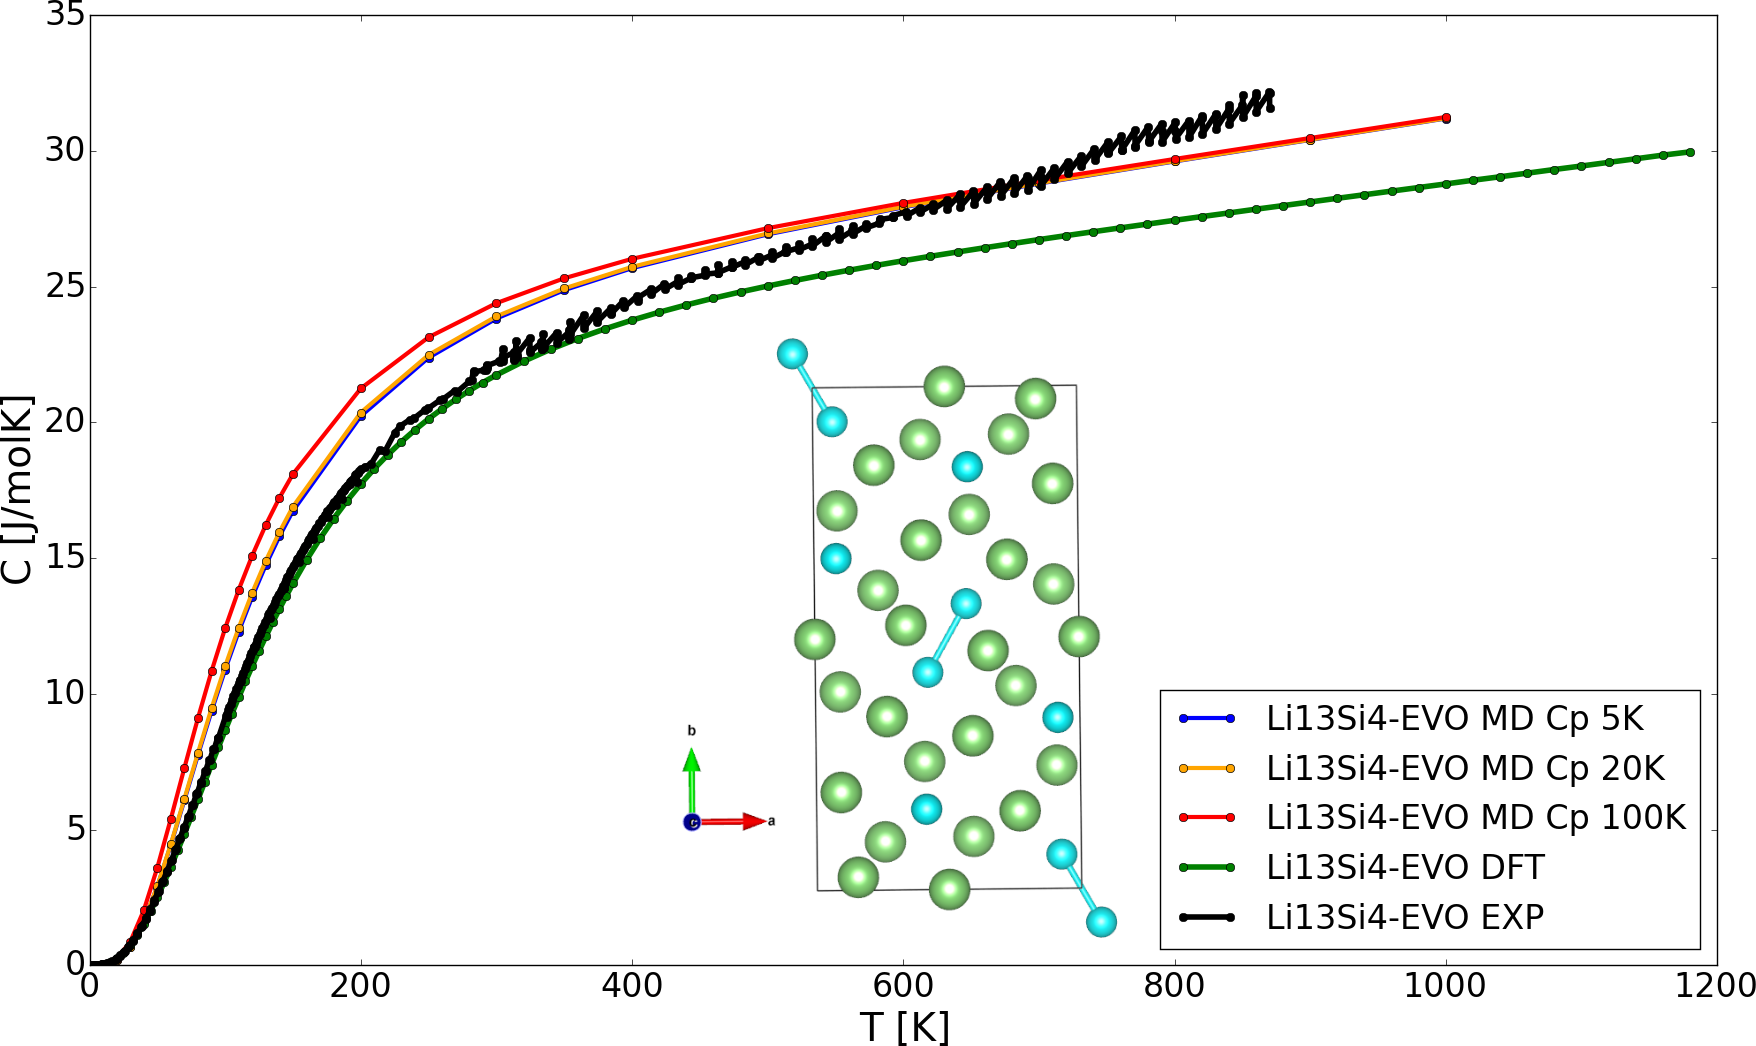
For Li13Si4 in FIG. 8 (b) a temperature dependent PDOS was calculated (5 K, 20 K, 100 K). Here the agreement with experiment and DFT results for a low temperature PDOS is better. This might be caused by suppressed diffusion processes [6] within the phase at low temperature, which are certainly more important for higher temperatures. Thus the description of the systems becomes better at low temperatures because we ”freeze out” the diffusion process. In FIG. 8 (a) the RPDF of Li and Si within Li13Si4 is shown. The first peak for Li shows similarities to Li12Si7 and Li7Si3. However, in contrast to Li7Si3 and in correspondance to Li12Si7, there is a single, broad second peak at around 4.5 Å. The RPDF for Si indicates that initially more single atoms than single dimers are present, which can be seen from the broad peak at approximately 4.5 Å and from the crystal structure itself. However, at a temperature of 1200 K, this peak is strongly smeared out and an additional peak at about 2.5 Å appears, again resembling the features seen in all other phases. At this temperature the first nearest neighbors peak in the Si RPDF increases significantly, which indicates structural changes concerning the Si atoms with increasing temperature.
| LixSiy | [52] | ||
|---|---|---|---|
| [ K-1] | [ K-1] | [ K-1] | |
| Si | 5.6 | 5.6 | 2.6–3 |
| Li12Si7 | 4.4 | 18.7 | — |
| (20-200 K) | (400-1000 K) | ||
| Li7Si3 | 26.5 | 26.5 | — |
| Li13Si4 | 58.6 | 58.6 | — |
| Li22Si5 | 33.9 | 72.6 | — |
| (100-500 K) | (100-1000 K) | ||
| Li | 54.7 | 54.7 | 56 |
As one can see, the isobaric heat capacity in low temperature region (0 - 400 K) calculated with DFT in the framework of the quasi-harmonic approximation is in excellent agreement with experimental data. In the high temperature region (400 - 1200 K) anharmonic effects become important and the quasi-harmonic approximation is not able to produce the right thermal expansion. Using our proposed MD method calculation of the isobaric heat capacity we are able to deliver improved results in the high temperature region (400 - 1200 K) in respect to the reference experiment. There are slight deviations in the low temperature region compared to the experiment or the DFT results. The use of both theoretical methods enables us to give a good description of the isobaric heat capacity for the LixSiy crystal structures over the entire temperature region.
6 Computational time analysis
DFT in the framework of the quasi-harmonic approximation is able to determine quite accurate and reasonable isochoric heat capacity values, but at which cost? This computational framework is expensive, in respect to computational time (see TAB. 5). Systems with a relative small number of atoms in their unit cell (e.g. Li, Si) can be treated within this framework. In contrast, a large number of atoms (e.g. lithium silicides) leads to a dramatically increased computational time (see TAB. 5). For example, the computational time to calculate the isochoric heat capacity for the lithium rich Li22Si5 phase is over 500000 CPUh. Our proposed MD method is based on force-fields. For the same Li22Si5 phase, we only need about 61 CPUh to get access to reasonable values for the isobaric heat capacity. Given these numbers our method is more than 4 orders of magnitude faster than ab-initio computational thermodynamics (see TAB. 6). In summary, our MD method based computational thermodynamics allows to describe complex structures with many atoms per unit cell in reasonable computational time.
| System | |||||||
|---|---|---|---|---|---|---|---|
| [CPUh] | [CPUh] | [CPUh] | |||||
| Li | 0.1 | 3 | 3 | 3 | 5 | 2 | 91.5 |
| Li12Si7 | 0.2 | 216 | 2 | 288 | 5 | 120 | 345816 |
| Li7Si3 | 0.1 | 16 | 5 | 12 | 5 | 20 | 6008 |
| Li13Si4 | 0.2 | 60 | 9 | 72 | 5 | 36 | 116700 |
| Li22Si5 | 4 | 24 | 7 | 300 | 5 | 48 | 504480 |
| Si | 0.1 | 4 | 0.1 | 2 | 5 | 2 | 4 |
| System | |||||||
|---|---|---|---|---|---|---|---|
| [CPUh] | [CPUh] | [CPUh] | [CPUh] | ||||
| Li | 0 | 27 | 40 | 0.12 | 8 | 200 | 11.24 |
| Li12Si7 | 0.26 | 35 | 22 | 0.17 | 9.77 | 22 | 15.98 |
| Li7Si3 | 0 | 15 | 22 | 0.14 | 11.69 | 22 | 13.79 |
| Li13Si4 | 0.02 | 29 | 16 | 0.24 | 24.01 | 100 | 31.00 |
| Li22Si5 | 0.06 | 26 | 40 | 0.57 | 46.56 | 100 | 61.44 |
| Si | 0.05 | 24 | 1 | 0.03 | 3.7 | 1 | 4.47 |
7 Conclusion
Within this contribution we showed for a complex material class like lithium silicides it is possible to calculate with comparable accuracy to density functional theory mechanical properties such as elastic constants and bulk moduli with one MEAM force-field (see TAB. 3).
Based on the fact that both methods deliver suitable elastic constants we were also able to calculate thermodynamic properties based on a phonon density of states with DFT as well as MEAM.
Our proposed MD method for the calculation of the isobaric heat capacity turns out to be numerically fast and accurate compared
to experimental or ab-initio data (cp. TAB. 5 and TAB. 6).
For Li12Si7 and Li22Si5, we identified with this method two extended temperature ranges with almost constant but different linear expansion coefficients for both structures. One of this expansion coefficients describes the low temperature region, whereas the other one describes the high temperature region.
Furthermore, we present temperature dependent phonon density of states, which in case of Li13Si4
show a better agreement between our MD method and the obtained ab-initio data by freezing out the diffusion process using a low temperature phonon density of states.
In general the ab-initio thermodynamic calculations are in excellent agreement with experimental data in the low temperature region (0 - 400 K), while the MD method based thermodynamic data can deliver
a faster description in good agreement with experimental data especially in the high temperature limit ( K). Other groups showed that an explicit treatment of anharmonic effects is necessary to overcome the limitations
of the quasi-harmonic approximation [24, 25, 26]. Our MD method based computational thermodynamics is
able to describe the high temperature limit better by using a temperature dependent phonon DOS (see FIG. 8). Additionally, we are able to evaluate linear expansion coefficients by performing a set of NPT-ensemble MD runs (see FIG. 6 and FIG. 7).
The essential advantage of our MD method is that it is capable to describe the structure change due to the effect of temperature (e.g. see radial distribution function (RPDF) FIG. 4 (a) and FIG. 6 (a)).
Thus, our method allows to describe diffusion effects as well as the melting behavior of the treated system.
Based on these essentials of our method, we could observe that Li atoms in the Li22Si5 phase show amorphous/liquid-like behavior (e.g. RPDF FIG. 7 (a)).
If this materials behavior is correct it may also explains why it is difficult to distinguish between Li22Si5, Li21Si5 and Li17Si4 experimentally, as all of them have a high and very similar Li content.
8 Acknowledgements
The authors thank the Deutsche Forschungsgemeinschaft DFG (WeNDeLIB - SPP 1473) and the ’Support the Best’ program within the Excellence Initiative of the TU Dresden for financial support as well as the ZIH in Dresden for computational time and support. Furthermore, we especially thank Daniel Thomas for the excellent experimental isobaric heat capacity data, which we used as experimental reference. Additionally, we want to thank the institute of theoretical physics and the institute of physical chemistry for fruitful discussions and an excellent cooperation.
References
- Holzapfel et al. [2006] M. Holzapfel, H. Buqa, L. J. Hardwick, M. Hahn, A. Würsig, W. Scheifele, P. Novák, R. Kötz, C. Veit, F.-M. Petrat, Nano silicon for lithium-ion batteries, Electrochimica Acta 52 (3) (2006) 973–8.
- Wang et al. [2012] C.-M. Wang, X. Li, Z. Wang, W. Xu, J. Liu, F. Gao, L. Kovarik, J.-G. Zhang, J. Howe, D. J. Burton, Z. Liu, X. Xiao, S. Thevuthasan, D. R. Baer, In Situ TEM Investigation of Congruent Phase Transition and Structural Evolution of Nanostructured Silicon/Carbon Anode for Lithium Ion Batteries, Nano Letters 12 (3) (2012) 1624–32.
- Chevrier et al. [2010] V. Chevrier, J. Zwanziger, J. Dahn, First principles study of Li–Si crystalline phases: Charge transfer, electronic structure, and lattice vibrations, Journal of Alloys and Compounds 496 (1) (2010) 25–36.
- Thomas et al. [2013] D. Thomas, M. Abdel-Hafiez, T. Gruber, R. Hüttl, J. Seidel, A. U. Wolter, B. Büchner, J. Kortus, F. Mertens, The heat capacity and entropy of lithium silicides over the temperature range from (2 to 873) K, The Journal of Chemical Thermodynamics 64 (2013) 205–25.
- Cui et al. [2012] Z. Cui, F. Gao, Z. Cui, J. Qu, A second nearest-neighbor embedded atom method interatomic potential for Li–Si alloys, Journal of Power Sources 207 (2012) 150–9.
- Gruber et al. [2016] T. Gruber, S. Bahmann, J. Kortus, Metastable structure of , Physical Review B 93 (2016) 144104.
- Kroupa [2013] A. Kroupa, Modelling of phase diagrams and thermodynamic properties using Calphad method – Development of thermodynamic databases, Computational Materials Science 66 (2013) 3 – 13.
- Schmerler and Kortus [2014] S. Schmerler, J. Kortus, Ab initio study of AlN: Anisotropic thermal expansion, phase diagram, and high-temperature rocksalt to wurtzite phase transition, Physical Review B 89 (2014) 064109.
- Martin [2004] R. M. Martin, Electronic structure: basic theory and practical methods, Cambridge university press, 2004.
- Baroni et al. [2001] S. Baroni, S. de Gironcoli, A. Dal Corso, P. Giannozzi, Phonons and related crystal properties from density-functional perturbation theory, Reviews of Modern Physics 73 (2001) 515–62.
- Nielsen and Martin [1983] O. H. Nielsen, R. M. Martin, First-Principles Calculation of Stress, Physical Review Letters 50 (1983) 697–700.
- Nielsen and Martin [1985] O. H. Nielsen, R. M. Martin, Quantum-mechanical theory of stress and force, Physical Review B 32 (1985) 3780–91.
- Gullet et al. [2003] P. Gullet, G. Wagner, A. Slepoy, Numerical tools for atomistic simulations, SANDIA Report 8782 (2003) 2003.
- Groh and Alam [2015] S. Groh, M. Alam, Fracture behavior of lithium single crystal in the framework of (semi-)empirical force field derived from first-principles, Modelling and Simulation in Materials Science and Engineering 23 (4) (2015) 045008.
- Hill [1952] R. Hill, The Elastic Behaviour of a Crystalline Aggregate, Proceedings of the Physical Society. Section A 65 (5) (1952) 349.
- Birch [1978] F. Birch, Finite strain isotherm and velocities for single-crystal and polycrystalline NaCl at high pressures and 300°K, Journal of Geophysical Research: Solid Earth 83 (B3) (1978) 1257–68.
- Souvatzis et al. [2009] P. Souvatzis, T. Björkman, O. Eriksson, P. Andersson, M. I. Katsnelson, S. P. Rudin, Dynamical stabilization of the body centered cubic phase in lanthanum and thorium by phonon–phonon interaction, Journal of Physics: Condensed Matter 21 (17) (2009) 175402.
- Campañá and Müser [2006] C. Campañá, M. H. Müser, Practical Green’s function approach to the simulation of elastic semi-infinite solids, Physical Review B 74 (2006) 075420.
- Kong [2011] L. T. Kong, Phonon dispersion measured directly from molecular dynamics simulations, Computer Physics Communications 182 (2011) 2201–7.
- Kong and Lewis [2008] L. Kong, L. J. Lewis, Surface diffusion coefficients: Substrate dynamics matters, Physical Review B 77 (2008) 165422.
- Svergun et al. [2013] D. Svergun, M. Koch, P. Timmins, R. May, Small Angle X-Ray and Neutron Scattering from Solutions of Biological Macromolecules, EBSCO ebook academic collection, OUP Oxford, ISBN 9780199639533, 2013.
- Awasthi and University [2007] N. Awasthi, D. University, Phase Stability of Iron-carbon Nanocarbides and Implications for the Growth of Carbon Nanotubes, Duke University, ISBN 9780549708278, 2007.
- Duff et al. [2015] A. I. Duff, T. Davey, D. Korbmacher, A. Glensk, B. Grabowski, J. Neugebauer, M. W. Finnis, Improved method of calculating ab initio high-temperature thermodynamic properties with application to ZrC, Physical Review B 91 (2015) 214311.
- Monserrat et al. [2013] B. Monserrat, N. D. Drummond, R. J. Needs, Anharmonic vibrational properties in periodic systems: energy, electron-phonon coupling, and stress, Physical Review B 87 (2013) 144302.
- Errea et al. [2014] I. Errea, M. Calandra, F. Mauri, Anharmonic free energies and phonon dispersions from the stochastic self-consistent harmonic approximation: Application to platinum and palladium hydrides, Physical Review B 89 (2014) 064302.
- Hellman et al. [2013] O. Hellman, P. Steneteg, I. A. Abrikosov, S. I. Simak, Temperature dependent effective potential method for accurate free energy calculations of solids, Physical Review B 87 (2013) 104111.
- Blöchl [1994] P. E. Blöchl, Projector augmented-wave method, Physical Review B 50 (1994) 17953–79.
- Giannozzi et al. [2009] P. Giannozzi, S. Baroni, N. Bonini, M. Calandra, R. Car, C. Cavazzoni, D. Ceresoli, G. L. Chiarotti, M. Cococcioni, I. Dabo, A. D. Corso, S. de Gironcoli, S. Fabris, G. Fratesi, R. Gebauer, U. Gerstmann, C. Gougoussis, A. Kokalj, M. Lazzeri, L. Martin-Samos, N. Marzari, F. Mauri, R. Mazzarello, S. Paolini, A. Pasquarello, L. Paulatto, C. Sbraccia, S. Scandolo, G. Sclauzero, A. P. Seitsonen, A. Smogunov, P. Umari, R. M. Wentzcovitch, QUANTUM ESPRESSO: a modular and open-source software project for quantum simulations of materials, Journal of Physics: Condensed Matter 21 (39) (2009) 395502.
- Holzwarth et al. [2001] N. Holzwarth, A. Tackett, G. Matthews, A Projector Augmented Wave (PAW) code for electronic structure calculations, Part I: atompaw for generating atom-centered functions, Computer Physics Communications 135 (3) (2001) 329 –47.
- Perdew and Wang [1992] J. P. Perdew, Y. Wang, Accurate and simple analytic representation of the electron-gas correlation energy, Physical Review B 45 (1992) 13244–9.
- Golesorkhtabar et al. [2013] R. Golesorkhtabar, P. Pavone, J. Spitaler, P. Puschnig, C. Draxl, ElaStic: A tool for calculating second-order elastic constants from first principles, Computer Physics Communications 184 (8) (2013) 1861 –73.
- Giannozzi et al. [1991] P. Giannozzi, S. de Gironcoli, P. Pavone, S. Baroni, Ab initio calculation of phonon dispersions in semiconductors, Physical Review B 43 (1991) 7231–42.
- Togo and Tanaka [2015] A. Togo, I. Tanaka, First principles phonon calculations in materials science, Scripta Materialia 108 (2015) 1–5.
- Plimpton [1995] S. Plimpton, Fast Parallel Algorithms for Short-Range Molecular Dynamics, Journal of Computational Physics 117 (1) (1995) 1–19.
- pwt [0 05] Code: pwtools, https://github.com/elcorto/pwtools, Accessed: 2016-10-05.
- lat [0 05] Code: latgen, https://gitlab.com/vanceeasleaf/latgen, Accessed: 2016-10-05.
- Zintl [1939] E. Zintl, Intermetallische Verbindungen, Angewandte Chemie 52 (1) (1939) 1–6.
- Nesper and von Schnering [1987] R. Nesper, H. G. von Schnering, Li21Si5, a Zintl phase as well as a Hume-Rothery phase, Journal of Solid State Chemistry 70 (1) (1987) 48–57.
- Nesper [1990] R. Nesper, Structure and chemical bonding in Zintl-phases containing lithium, Progress in Solid State Chemistry 20 (1) (1990) 1–45.
- Schnering et al. [1980] H.-G. Schnering, R. Nesper, J. Curda, K.-F. Tebbe, Structure and properties of Li14Si6/Li/2.33/Si/, the violet phase in the lithium-silicon system, Zeitschrift für Metallkunde 71 (1980) 357–63.
- Bahmann and Kortus [2013] S. Bahmann, J. Kortus, EVO - Evolutionary algorithm for crystal structure prediction, Computer Physics Communications 184 (6) (2013) 1618 –25.
- Mayer et al. [2001] H. Mayer, K. Knorr, D. Többens, N. Stüßer, G. Lampert, E9: The New High-Resolution Neutron Powder Diffractometer at the Berlin Neutron Scattering Center, in: European Powder Diffraction EPDIC 7, vol. 378 of Materials Science Forum, Trans Tech Publications, 288–93, 2001.
- Nesper et al. [1986] R. Nesper, H. G. von Schnering, J. Curda, Li12Si7, eine Verbindung mit trigonal-planaren Si4-Clustern und isometrischen Si5-Ringen, Chemische Berichte 119 (12) (1986) 3576–90.
- Frank et al. [1975] U. Frank, W. Müller, H. Schäfer, Zur Kenntnis der Phase Li13Si4/On the Phase Li13Si4, Zeitschrift für Naturforschung B 30 (1-2) (1975) 10–3.
- Kubota et al. [2007] Y. Kubota, M. C. S. Escaño, H. Nakanishi, H. Kasai, Crystal and electronic structure of Li15Si4, Journal of Applied Physics 102 (5) (2007) 053704.
- Gladyesh et al. [1964] E. Gladyesh, G. Oleksiv, P. Kripyake, New examples of structural type Li22Pb5, Soviet Physics Crystallography, USSR 9 (3) (1964) 269.
- Nadler and Kempier [1959] M. R. Nadler, C. Kempier, Crystallographic data 186. lithium, Analytical Chemistry 31 (12) (1959) 2109–.
- Flubacher et al. [1959] P. Flubacher, A. J. Leadbetter, J. A. Morrison, The heat capacity of pure silicon and germanium and properties of their vibrational frequency spectra, Philosophical Magazine 4 (39) (1959) 273–94.
- Shanks et al. [1963] H. R. Shanks, P. D. Maycock, P. H. Sidles, G. C. Danielson, Thermal Conductivity of Silicon from 300 to 1400∘ K, Physical Review 130 (1963) 1743–8.
- Douglas et al. [1955] T. B. Douglas, L. F. Epstein, J. L. Dever, W. H. Howland, Lithium: Heat Content from 0 to 900∘, Triple Point and Heat of Fusion, and Thermodynamic Properties of the Solid and Liquid, Journal of the American Chemical Society 77 (8) (1955) 2144–50.
- Simon and Swain [1935] F. Simon, R. C. Swain, Specific heats at low temperatures, Zeitschrift für physikalische Chemie Abteilung B 28 (1935) 189.
- Krishnan et al. [2013] R. S. Krishnan, R. Srinivasan, S. Devanarayanan, Thermal Expansion of Crystals: International Series in The Science of The Solid State, vol. 22, Elsevier, 2013.