Flares, wind and nebulae: the 2015 December mini-outburst of V404 Cygni
Abstract
After more than 26 years in quiescence, the black hole transient V404 Cyg went into a luminous outburst in June 2015, and additional activity was detected in late December of the same year. Here, we present an optical spectroscopic follow-up of the December mini-outburst, together with X-ray, optical and radio monitoring that spanned more than a month. Strong flares with gradually increasing intensity are detected in the three spectral ranges during the days following the Swift trigger. Our optical spectra reveal the presence of a fast outflowing wind, as implied by the detection of a P-Cyg profile (He i–5876 Å) with a terminal velocity of 2500 . Nebular-like spectra – with an H equivalent width of Å – are also observed. All these features are similar to those seen during the main June 2015 outburst. Thus, the fast optical wind simultaneous with the radio jet is most likely present in every V404 Cyg outburst. Finally, we report on the detection of a strong radio flare in late January 2016, when X-ray and optical monitoring had stopped due to Sun constraints.
keywords:
accretion, accretion discs, stars: black holes, stars: individual: V404 Cygni, stars: jets, X-rays: binaries1 Introduction
V404 Cygni is a transient low mass X-ray binary harbouring a M⊙ black hole and a K-type evolved donor in a 6.5 d orbital period, one of the longest of its class (Casares et al. 1992; Casares & Jonker 2014; Corral-Santana et al. 2016). It was discovered as an X-ray source by Ginga during the peak of its 1989 outburst, when it displayed extreme X-ray behaviour in both the spectral and time domains (e.g. Kitamoto et al. 1989; Życki et al. 1999). Photographic archives show that the system also went into outburst in 1938 and 1956 (Richter 1989; Wagner et al. 1991). More recently, the Swift mission detected renewed activity on Jun 15, 2015 (Barthelmy et al., 2015a), which was the start of a luminous but brief outburst ( weeks of strong activity) characterized by extreme phenomenology at high-energies (Rodriguez et al., 2015; Siegert et al., 2016; Motta et al., 2016a), optical (Gandhi et al., 2016; Kimura et al., 2016) and radio bands (Mooley et al., 2015). Optical spectroscopy performed with the Gran Telescopio Canarias (GTC) 10.4m telescope revealed the presence of an outflowing outer disc wind of low-ionisation/neutral material, detected as P-Cyg profiles in hydrogen (Balmer) and He i emission lines (Muñoz-Darias et al., 2016, hereafter MD16). The wind has a terminal velocity in the range 2000-3000 and was observed simultaneously with the radio-jet, which is a distinctive feature of hard and intermediate black hole X-ray states (Fender, 2001; Fender & Muñoz-Darias, 2016). The wind is witnessed along the full active phase of the outburst, from X-ray fluxes as low as 10-3 that of the outburst peak. Subsequently, an optically thin phase of the wind was observed following a sharp drop in flux by a factor . This so-called nebular phase lasted a few days and is characterized by broad emission lines – equivalent width (EW) up to 2000 Å (H) – and large Balmer decrements (6). Six months after the June 2015 outburst (hereafter, June outburst), new activity was reported in V404 Cyg on Dec 23, 2015 (MJD 57379, hereafter taken as time zero; Barthelmy et al., 2015b; Lipunov et al., 2015; Motta et al., 2015; Hardy et al., 2016). However, the Fermi Gamma-ray Burst Monitor (Jenke et al., 2015) and INTEGRAL observations of the Cygnus region show that the source was active by Dec 21, but it was not detected on Dec 13–15, 2015 (Malyshev et al., 2015). In this letter, we present a 30-day X-ray, optical and radio monitoring campaign of V404 Cyg during Dec 2015–Jan 2016. We report on the observation of several intervals of flaring activity and the spectroscopic detection of an optical wind outflow similar to that observed during the June outburst.
2 Observations
Optical photometric observations were conducted with the 0.5m robotic telescope, pt5m, situated at the Observatorio del Roque de los Muchachos (ORM) on La Palma, Spain (Hardy et al., 2015). Photometry spanned over days (Fig 1) was obtained in the V filter using 60 s, and later 120 s, exposures. The images were reduced in the standard manner using the ULTRACAM pipeline reduction software with variable-sized aperture photometry. Magnitudes were calibrated using the nearby comparison star USNO-B1.0 1238-0435227 (; Udalski & Kaluzny 1991).
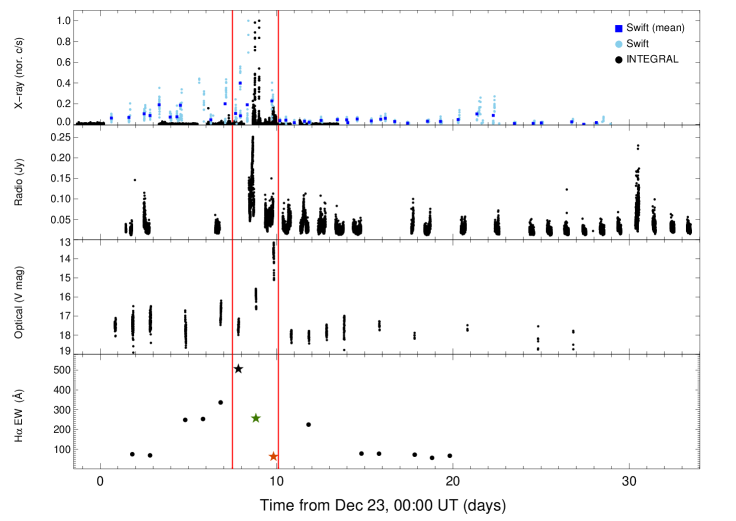
Optical spectroscopy was carried out over 14 different nights in the interval from 24 Dec 2015 to 11 Jan 2016 using the 10.4m GTC telescope (10 epochs) and the 4.2m William Herschel Telescope (WHT; 4 epochs) both located at the ORM. GTC observations were performed with the Optical System for Imaging and low/intermediate-Resolution Integrated Spectroscopy (OSIRIS) (Cepa et al., 2000) using grism R1000B, which covers the spectral range 3630 – 7500 Å with a resolving power of . The first three WHT observations (Dec 28, 29 and Jan 3) were performed using the Intermediate dispersion Spectrograph and Imaging System (ISIS) with the R300B and R600R grisms in the blue and red arms, respectively. The WHT observation of Jan 9, 2016 was carried out using the auxiliary-port camera (ACAM), which provides across the range 3500 – 9400 Å. Between 1 and 3 spectra were obtained every observing date, which were subsequently combined into one spectrum per epoch. Spectra were bias- and flat field-corrected using iraf routines. Due to the extremely limited object visibility, all the observations were taken at high airmass () and with the slit positioned at the parallactic angle. Given these limitations, a reliable (absolute) flux calibration was not always possible. Indeed, a flux calibration was only performed for the highest signal-to-noise GTC spectra using the spectro-photometric standard G158-100. This is useful to constrain the Balmer decrement during the brightest epochs (marked by the solid, vertical lines in Fig. 1) . On the other hand, for every observation we computed the ionisation ratio (), defined as the flux ratio between the nearby He ii–4686 Å and H emission lines, which is roughly independent of flux calibration issues (see MD16).
2.1 X-ray and radio monitoring
Following the same procedure as MD16, to which we refer the reader for further details on the X-ray analysis (methods section), we report on both INTEGRAL (20–250 keV; see Kuulkers et al. 2016) and Swift (0.5 – 10 keV) monitoring spanning 6 and 30 days, respectively (Fig. 1). Data from the Swift mission, including 41 different pointings, are presented at two different time resolutions, 100 s and ks (i.e. full observations). INTEGRAL observations started d after the Swift trigger and are shown in 64 s time steps. The peak count-rate in the 20–250 keV band was roughly a factor of 4 lower than that of the June outburst. Serendipitous INTEGRAL data obtained d prior to the Swift trigger are also included in Fig. 1 (see Malyshev et al., 2015).
Radio observations were performed with the Arcminute Microkelvin Imager Large Array (AMI-LA) radio telescope, operating as part of the University of Oxford 4-PI-SKY transients programme. These were made using the new digital correlator with 4096 channels across the 13–18 GHz frequency band. Observations started on 2015 December 24.69. We processed the data (RFI excision and calibration) with a fully-automated pipeline, AMIREDUCE (e.g., Davies et al., 2009) and prepared images at a center frequency of 14 GHz.
Light curves were extracted in time steps of 40 s and using six channels across the 5 GHz bandwidth via vector-averaging of the UV data. V404 Cyg was observed for up to 12 hours per day for 30 days (Fig. 1). Many flaring episodes were detected during the campaign, reaching a maximum flux density of Jy at 16 GHz, a factor of 14 lower than the brightest flare during the June outburst (MD16; see Fender et al. [in prep]).
3 Results
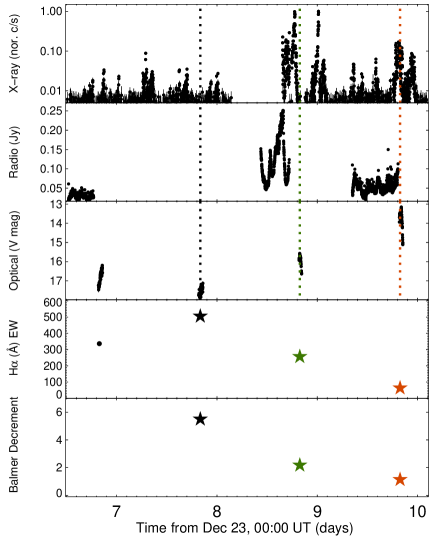
Our multi-wavelength coverage shows the presence of multiple flaring episodes during the d following the Swift trigger (top three panels in Fig. 1). In X-rays, we detect increasing flaring activity up to day 10, being particularly intense on days 8–10 (see Fig. 2). After this period, activity drops and only smaller flares on day are witnessed. Radio and optical observations are consistent with the X-ray picture, but a radio flare of comparable strength to that associated with the main X-ray episode (day 8) is detected on day 30, once optical and X-ray monitoring had already stopped due to Sun constraints. Additional optical spectroscopy taken by this team once the object was again visible shows V404 Cyg in quiescence by late April 2016.
The system reached V during the brightest flare (i.e. mags fainter than the peak of the June outburst), while fluxes only slightly above the quiescence level () are measured outside the main activity period. Indeed, beyond day , both optical and X-ray fluxes are mostly consistent with quiescence (see also Motta
et al., 2016b) and the spectra present double-peaked emission lines and companion star absorption features. The radio flux is always well above the mJy quiescence level, but we note that radio emission can be observed for many days after a jet ejection episode (e.g. Fender et al. 2007). Nevertheless, it is important to bear in mind that the system can show significant multiwavelength flaring activity even during true quiescence (Zurita
et al., 2003; Hynes
et al., 2004; Hynes et al., 2009).
The spectroscopic follow-up reveals dramatic changes in correspondence with the multi-wavelength variability of the source. The H EW is a reliable tracer – independent of any flux calibration issue – of the condition of the system. EWs > 200 Å are observed between days 5–12, when the largest flares occur. During the June outburst, these large values are only measured either during strong wind (P-Cyg) phases at low or along the final nebular phase (MD16). On the other hand, the H EW is in the range 55–80 Å outside the above interval, which is comparable with the lowest values observed during the June outburst. Nevertheless, these are substantially larger than the 10–30 Å observed in quiescence (Casares, 2015).
The large H EW observed on days 5, 6 and 7 (see bottom panel in Fig. 1) might suggest the presence of wind outflows at that stage of the outburst, probably in response to the increasing activity of the system. During days 8 to 10 we have solid evidence for this to be the case as both P-Cyg profiles and nebular-like spectra are witnessed (Figs. 1, 2 and 3).
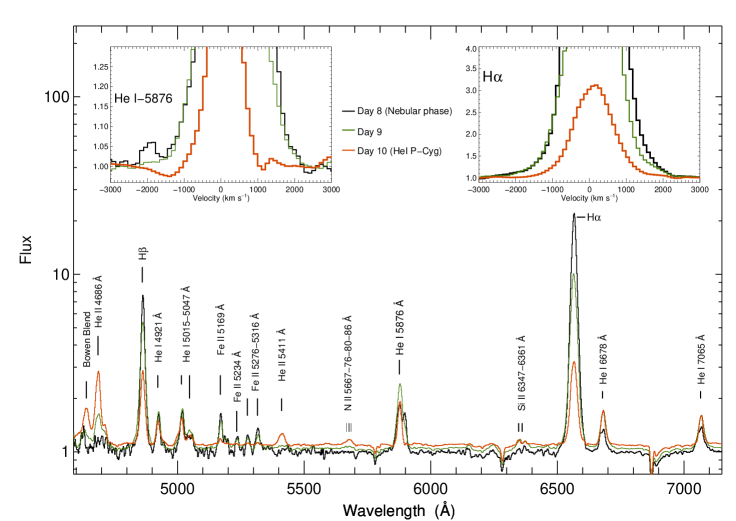
On day 8, at low optical flux and following the detection of weak X-ray flares, a forest of Fe ii emission lines become apparent in the spectrum. Also, the H EW reaches Å and sits on wings extending up to km s-1 (Fig. 3). This EW value exceeds any previous V404 Cyg measurement (e.g. Casares et al., 1991; Casares, 2015) with the remarkable exception of the nebular phase peak of the June outburst (EW Å; MD16). Indeed, it rivals the second largest value observed in June 2015. Similarly, on day 9, the H wings kept reaching the same velocity ( km s-1) even if the EW decreased by a factor of 2. Finally, on day 10, we observed the system during a small X-ray/optical flare (Fig. 2) and a weak (but obvious in our high signal-to-noise GTC spectra) P-Cyg profile is present in He i–5876 Å (Fig. 3). This shows a terminal velocity of and it is observed at , a value which is also associated with weak profiles during the June outburst. Besides this night (day-10), is measured owing to the weakness/absence of He ii-4686 (i.e. low ionisation state of the outer disc). We note that He i–5876 Å also shows the deepest P-Cyg profiles during the June outburst.
The combination of good observing conditions and source brightness allowed us to properly flux calibrate both the H and H regions during the day 8–10 period, and to determine the Balmer decrement, which decreases from on day 8 (nebular phase) to on day 10 (Fig. 2). This behaviour is similar to that of the June outburst. Finally, we have computed the H line centroid velocity offset. Given the null systemic velocity and small velocity swing of the BH in V404 Cyg ( ; Casares &
Charles 1994) any significant positive velocity offset could, in principle, be related to absorptions in the blue part of the profile and/or extra emission in the red wing, as observed during the June outburst (MD16). The three observations within the aforementioned interval (days 8–10) show offsets in the range 80–120 , while values are measured in the remaining observations.
4 discussion
We have presented X-ray, optical and radio light-curves covering the December 2015 outburst of V404 Cyg. With respect to the main (June) 2015 outburst, this accretion event was fainter by a factor of 4, 6 and 14 in the X-ray, optical and radio bands, respectively. However, we note that, in particular for the X-ray regime, absorption issues might be at work (e.g. Motta et al. 2016a) and a very detailed spectral study would be necessary to accurately measure the actual flux difference. Fainter sequels to bright outbursts are not unknown in black hole transients, probably the best cases being GRO J0422+32 and XTE J1550-564, with significantly fainter events d after the main outburst (e.g. Castro-Tirado et al., 1997; Dunn et al., 2010). Here, the mini-outburst occurred only d after the main but equally short ( weeks) outburst. As noted in MD16, this time-scale might be consistent with the viscous time-scale to re-fill the innermost part of the disc. Interestingly, although the optical and X-ray fluxes are consistent with quiescence only d after the Swift trigger, the system remained radio loud and displayed a second flare on day 30. It rivals in intensity the December event, showing that the latter was not unique. Indeed, since monitoring had stopped by late January due to Sun constraints, more activity in the following weeks cannot be ruled out.
Besides the differing brightness, the evolution of the two 2015 episodes is remarkably similar, with multi-wavelength flux and flaring activity increasing on a time scale of 10 d from the Swift trigger, followed by a dramatic flux drop on a shorter interval (1–2 days). Similarly, the spectroscopic data shows that an optical wind, akin to that observed in June, was also present in some phases of the December event. This strongly suggests that this kind of outflow is not exclusive to bright outbursts [2015 (MD16) and 1989 (Casares et al., 1991)], but is most likely a feature present in every V404 Cyg eruption, regardless of its brightness and duration. Likewise, the wind is, also in this case, simultaneous with the radio-jet, which is at odds with the usual evolution of the highly-ionised X-ray wind observed in several black hole and neutron star binaries (e.g. Neilsen & Lee 2009; Ponti et al. 2012, 2014; Ponti et al. 2015). However, after MD16, there is growing evidence of X-ray wind and radio-jet coexisting at least at some particular phases (Homan et al. 2016; Kalemci et al. 2016). It is probably too early to address the question of whether or not X-ray and optical winds are different signatures of the same process. In the particular case of V404 Cyg, we note that the optical wind and jet coexist during the whole June 2015 episode (i.e. from X-ray fluxes as low as times the outburst peak), and the X-ray wind is detected in the only observation performed by Chandra (King et al., 2015).
The two wind phases – optically thick (P-Cyg profile) and optically thin (nebular) – are most conspicuously observed during days 8 to 10 (vertical lines in Fig. 1). In Fig. 2 it becomes evident that while the day-8 spectrum (nebular phase) was obtained during a quiet epoch following a series of flares, day-9 was taken in between two large X-ray flares at higher optical flux, and day-10 during the peak of an X-ray/optical/radio flare (Fig. 2). Only in this latest case was a P-Cyg profile observed. We note that this is the only spectrum taken during a flare at , the remaining spectra corresponding to fainter epochs (15). On the other hand, the June outburst nebular phase was only visible once the accretion dropped after days of activity, whilst here it is detected in the middle of the outburst before the strongest flares. This is most likely a result of the low flux level (roughly consistent with optical quiescence) reached by the system outside the main flares, in contrast to the higher activity always sustained in June. We conclude that the chronology of the different wind phases observed in December is affected by the particular short-term activity occurring at the time when the spectrum was taken.
Our data only show wind signatures from day 5 at the earliest, when the flare intensity increases (e.g. Swift data in Fig. 1), whereas the June observations are consistent with the continuous presence of the wind. This raises the question of what is the low luminosity boundary necessary to produce the wind, since our December data can be interpreted as wind being launched solely during the flares, after which the optically thin phase is observed. The thermal wind scenario (Begelman et al., 1983) is consistent with the June 2015 observations (MD16), and can be extended – given the similar observables – to the data presented here. If this is the dominant wind-launching mechanism, the sustained higher activity implied by the lowest optical fluxes [ in June (Kimura et al., 2016) vs. in December] might be a determining factor.
5 Conclusions
We have presented an optical spectroscopic follow-up, together with X-ray, optical and radio monitoring of the 2015 December mini-outburst of V404 Cyg. Despite this event being significantly fainter, the observed phenomenology resembles that of the June 2015 main outburst, including gradually brighter flares during the first 10 days of the outburst, followed by a much faster intensity drop. Likewise, we find solid evidence for the presence of an optical accretion disc wind in the form of P-Cyg profiles and nebular-like spectra. New spectroscopic observations of other black hole transients and detailed modelling of the very rich June 2015 data should be able to shed more light on the properties and impact of this type of wind on accreting black holes.
Acknowledgements
TMD, DMS and JC acknowledge support by the Spanish MINECO under grant AYA2013-42627. JC ackowledges support by the Leverhulme Trust (VP2-2015-04). We are thankful to the GTC and WHT teams that carried out the ToO observations. The AMI telescope gratefully acknowledges support from the European Research Council under grant ERC-2012- StG-307215 LODESTONE, the UK Science and Technology Facilities Council (STFC) and the University of Cambridge. KM research is supported by the Oxford Centre for Astrophysical Surveys, which is funded by the Hintze Family Charitable Foundation. GP acknowledges support by the German BMWI/DLR (FKZ 50 OR 1408 and FKZ 50 OR 1604) and the Max Planck Society. TB, RWW, VSD, SPL and PG acknowledge support by the UK STFC grants ST/J001236/1, ST/M001350/1 and ST/J003697/2.
References
- Barthelmy et al. (2015a) Barthelmy S. D., D’Ai A., D’Avanzo P., Krimm H. A., Lien A. Y., Marshall F. E., Maselli A., Siegel M. H., 2015a, GRB Coordinates Network, 17929
- Barthelmy et al. (2015b) Barthelmy S. D., Page K. L., Palmer D. M., 2015b, GRB Coordinates Network, 18716
- Begelman et al. (1983) Begelman M. C., McKee C. F., Shields G. A., 1983, ApJ, 271, 70
- Casares (2015) Casares J., 2015, ApJ, 808, 80
- Casares & Charles (1994) Casares J., Charles P. A., 1994, MNRAS, 271, L5
- Casares & Jonker (2014) Casares J., Jonker P. G., 2014, Space Sci. Rev., 183, 223
- Casares et al. (1991) Casares J., Charles P. A., Jones D. H. P., Rutten R. G. M., Callanan P. J., 1991, MNRAS, 250, 712
- Casares et al. (1992) Casares J., Charles P. A., Naylor T., 1992, Nature, 355, 614
- Castro-Tirado et al. (1997) Castro-Tirado A. J., Ortiz J. L., Gallego J., 1997, A&A, 322, 507
- Cepa et al. (2000) Cepa J., et al., 2000, in Iye M., Moorwood A. F., eds, SPIE Conference Series Vol. 4008, Optical and IR Telescope Instrumentation and Detectors. pp 623–631
- Corral-Santana et al. (2016) Corral-Santana J. M., Casares J., Muñoz-Darias T., Bauer F. E., Martínez-Pais I. G., Russell D. M., 2016, A&A, 587, A61
- Davies et al. (2009) Davies M. L., et al., 2009, MNRAS, 400, 984
- Dunn et al. (2010) Dunn R. J. H., Fender R. P., Körding E. G., Belloni T., Cabanac C., 2010, MNRAS, 403, 61
- Fender (2001) Fender R. P., 2001, MNRAS, 322, 31
- Fender & Muñoz-Darias (2016) Fender R., Muñoz-Darias T., 2016, in Haardt F., et al. eds, Lecture Notes in Physics Vol. 905, Berlin Springer Verlag. p. 65 (arXiv:1505.03526), doi:10.1007/978-3-319-19416-5_3
- Fender et al. (2007) Fender R. P., Dahlem M., Homan J., Corbel S., Sault R., Belloni T. M., 2007, MNRAS, 380, L25
- Gandhi et al. (2016) Gandhi P., et al., 2016, MNRAS, 459, 554
- Hardy et al. (2015) Hardy L. K., Butterley T., Dhillon V. S., Littlefair S. P., Wilson R. W., 2015, MNRAS, 454, 4316
- Hardy et al. (2016) Hardy L., Gandhi P., Dhillon V., Littlefair S., Butterley T., Wilson R., 2016, The Astronomer’s Telegram, 8501
- Homan et al. (2016) Homan J., Neilsen J., Allen J. L., Chakrabarty D., Fender R., Fridriksson J. K., Remillard R. A., Schulz N., 2016, preprint, (arXiv:1606.07954)
- Hynes et al. (2004) Hynes R. I., et al., 2004, ApJ, 611, L125
- Hynes et al. (2009) Hynes R. I., Bradley C. K., Rupen M., Gallo E., Fender R. P., Casares J., Zurita C., 2009, MNRAS, 399, 2239
- Jenke et al. (2015) Jenke P., WIlson-Hodge C. A., Connaughton V., 2015, The Astronomer’s Telegram, 8457
- Kalemci et al. (2016) Kalemci E., Begelman M. C., Maccarone T. J., Dinçer T., Russell T. D., Bailyn C., Tomsick J. A., 2016, MNRAS, 463, 615
- Kimura et al. (2016) Kimura M., et al., 2016, Nature, 529, 54
- King et al. (2015) King A. L., Miller J. M., Raymond J., Reynolds M. T., Morningstar W., 2015, ApJ, 813, L37
- Kitamoto et al. (1989) Kitamoto S., Tsunemi H., Miyamoto S., Yamashita K., Mizobuchi S., 1989, Nature, 342, 518
- Kuulkers et al. (2016) Kuulkers E., amp Ferrigno C., 2016, The Astronomer’s Telegram, 8512
- Lipunov et al. (2015) Lipunov V., et al., 2015, The Astronomer’s Telegram, 8453
- Malyshev et al. (2015) Malyshev D., Savchenko V., Ferrigno C., Bozzo E., Kuulkers E., 2015, The Astronomer’s Telegram, 8458
- Mooley et al. (2015) Mooley K., Fender R., Anderson G., Staley T., Kuulkers E., Rumsey C., 2015, The Astronomer’s Telegram, 7658
- Motta et al. (2015) Motta S. E., et al., 2015, The Astronomer’s Telegram, 8462
- Motta et al. (2016a) Motta S. E., Kajava J. J. E., Sánchez-Fernández C., Giustini M., Kuulkers E., 2016a, preprint, (arXiv:1607.02255)
- Motta et al. (2016b) Motta S. E., et al., 2016b, The Astronomer’s Telegram, 8510
- Muñoz-Darias et al. (2016) Muñoz-Darias T., et al., 2016, Nature, 534, 75
- Neilsen & Lee (2009) Neilsen J., Lee J. C., 2009, Nature, 458, 481
- Ponti et al. (2012) Ponti G., Fender R. P., Begelman M. C., Dunn R. J. H., Neilsen J., Coriat M., 2012, MNRAS, 422, L11
- Ponti et al. (2014) Ponti G., Muñoz-Darias T., Fender R. P., 2014, MNRAS, 444, 1829
- Ponti et al. (2015) Ponti G., et al., 2015, MNRAS, 446, 1536
- Richter (1989) Richter G. A., 1989, Information Bulletin on Variable Stars, 3362
- Rodriguez et al. (2015) Rodriguez J., et al., 2015, A&A, 581, L9
- Siegert et al. (2016) Siegert T., et al., 2016, Nature, 531, 341
- Udalski & Kaluzny (1991) Udalski A., Kaluzny J., 1991, PASP, 103, 198
- Wagner et al. (1991) Wagner R. M., Bertram R., Starrfield S. G., Howell S. B., Kreidl T. J., Bus S. J., Cassatella A., Fried R., 1991, ApJ, 378, 293
- Zurita et al. (2003) Zurita C., Casares J., Shahbaz T., 2003, ApJ, 582, 369
- Życki et al. (1999) Życki P. T., Done C., Smith D. A., 1999, MNRAS, 309, 561