Characterizing elusive, faint dusty star-forming galaxies: a lensed, optically undetected ALMA galaxy at 3.3
We present the serendipitous ALMA detection of a faint submillimeter galaxy (SMG) lensed by a foreground 1 galaxy. By optimizing the source detection to deblend the system, we accurately build the full spectral energy distribution of the distant galaxy from the I814 band to radio wavelengths. It is extremely red, with a I–K colour larger than 2.5. We estimate a photometric redshift of 3.28 and determine the physical parameters. The distant galaxy turns out to be magnified by the foreground lens by a factor of 1.5, which implies an intrinsic Ks-band magnitude of 24.5, a submillimeter flux at 870m of 2.5 mJy and a SFR of , depending on the adopted tracer. These values place our source towards the faint end of the distribution of observed SMGs, and in particular among the still few faint SMGs with a fully characterized spectral energy distribution, which allows us not only to accurately estimate its redshift, but also to measure its stellar mass and other physical properties. The galaxy studied in this work is a representative of the population of faint SMGs, of which only few objects are known to date, that are undetected in optical and therefore are not typically accounted for when measuring the cosmic star formation history (SFH). This faint galaxy population thus likely represents an important and missing piece in our understanding of the cosmic SFH. Its observation and characterization is of major importance to achieve a solid picture of galaxy evolution.
Key Words.:
Galaxies: evolution, fundamental parameters, high-redshift, photometry - Submillimeter: galaxies - Cosmology: observations1 Introduction
The cosmic star formation history (SFH) is a key observable to understand galaxy evolution and constrain theoretical models. Since the seminal works of Madau et al. (1996) and Lilly et al. (1996), much effort has been made to constrain its shape (see the review of Madau & Dickinson 2014). The launch of Herschel and the advent of ALMA have allowed us to measure the cosmic SFH out to free of uncertain dust extinction corrections (e.g. Burgarella et al. 2013; Dunlop et al. 2016; Bouwens et al. 2016, but see also Bourne et al. 2016 for a recent result based on SCUBA-2). However, because of limited ALMA observations (combined with its small field of view) and confusion in the far-infrared (FIR) images, at high redshift we still mostly rely on the rest-frame UV observations, which must be corrected for dust absorption. Nevertheless, at the peak of the cosmic star formation (SF) activity, the power emitted by young stars in the IR (through dust reprocessing) is an order of magnitude higher than that emitted in the UV (Madau & Dickinson 2014; Dunlop et al. 2016). Incorrect dust corrections could result in an incorrect overall picture of the SFH of the Universe (e.g. Castellano et al. 2014).
Another serious issue affecting the measure of the cosmic SFH is whether our census is complete. In other words, are we counting all star-forming galaxies? Or are we missing a fraction of them? Observational evidence seems to point towards the latter scenario (see e.g. the two extremely red galaxies found by Caputi et al. 2014 or the HIEROs galaxies presented by Wang et al. 2016). Most of our knowledge is based on galaxies selected in the UV, optical, or near-IR (submm and mm samples are also available, but they are highly incomplete, see Casey et al. 2014 for a collection of results from the literature). However, according to Viero et al. (2013), K-detected galaxies account for only 70% of the submillimeter background (but see also Viero et al. 2015, who claimed that most of it, if not all, can be accounted for by low-mass sources). Since 95% of the submillimeter background is contributed by dusty star-forming galaxies, it is very likely that we are missing a substantial contribution to the cosmic SFH. As candidates for the missing fraction, Viero et al. (2013) indicated low-mass faint sources and dust-obscured galaxies. Identifying galaxies undetected in the optical/near-IR bands is also extremely important to address the still open issue regarding the missing mass (the observed stellar mass is lower than what is obtained by integrating the SFH at ; e.g. Santini et al. 2012, Madau & Dickinson 2014, Grazian et al. 2015).
A population of IR bright galaxies that are often undetected at optical/near-IR wavelengths are the so-called submillimeter galaxies (SMGs, e.g. Hughes et al. 1998; Chapman et al. 2005; Greve et al. 2005; Pope et al. 2006; Tacconi et al. 2008), a heterogeneous (Magnelli et al. 2012; da Cunha et al. 2015) population of massive (), strongly star-forming, heavily dust-obscured galaxies historically selected from their submm flux. They contribute substantially to the cosmic SFH at (Chapman et al. 2005; Michałowski et al. 2010a) and are responsible for almost the entire dust-obscured SF (Barger et al. 2012; Casey et al. 2013, 2014).
The brightest SMGs, making hundreds or thousands of solar masses per year, are quite rare and their overall contribution to the cosmic SFH is modest (e.g. Le Borgne et al. 2009; Béthermin et al. 2011; Swinbank et al. 2014). Typically, observed SMGs have submm fluxes higher than a few mJy (e.g. 3 mJy for the SMA survey of Barger et al. 2012 in GOODS-N, or 4.4 mJy for the LESS survey with the LABOCA camera in the ECDF, Weiß et al. 2009), although a significant fraction of them has been resolved into multiple sources by ALMA observations (ALESS survey, Hodge et al. 2013). However, the SMG population is dominated by fainter sources (see Casey et al. 2014 and references therein, Dunlop et al. 2016, Aravena et al. 2016). According to Ono et al. (2014), faint SMGs, defined as having 1.2 mm fluxes between 0.1 and 1 mJy and SFRs between 30 and 300 , contribute nearly half of the submm extragalactic background (with the other half being accounted for by even fainter sources). Moreover, their contribution to the SFH is at least as much as that of bright (4 mJy) SMGs (Yamaguchi et al. 2016). However, despite their abundance and significant levels of SF, many faint SMGs may not be included in the cosmic SFH, as they are undetected at shorter wavelengths (Hsu et al. 2016). Yamaguchi et al. (2016) estimated that the contribution of these optically undetected galaxies to the infrared SFH at can be as large as 10%. A thorough investigation of this elusive population is therefore of major importance for completing the census of star-forming galaxies and reaching a full understanding of galaxy evolution.
Faint SMGs are being detected thanks to ALMA capabilities (Ono et al. 2014; Yamaguchi et al. 2016; Dunlop et al. 2016; Fujimoto et al. 2016; Oteo et al. 2016) and to amplification of their flux through gravitational lensing effects (Chen et al. 2014; Hsu et al. 2016). Gravitational lensing has recently been revealed to be a very powerful tool to detect sources below the sensitivity limit of current instrumentation (e.g. Treu 2010; van der Wel et al. 2013; Amorín et al. 2014; Watson et al. 2015; Vanzella et al. 2016; Castellano et al. 2016).
Although faint SMGs are being observed, a full (optical-to-submm) spectral energy distribution (SED) characterization of these sources is still missing, with few exceptions (Simpson et al. 2014; da Cunha et al. 2015; Dunlop et al. 2016; Bouwens et al. 2016; Yamaguchi et al. 2016; Koprowski et al. 2016, especially in the deepest fields like the HUDF) . We present here a serendipitous ALMA detection of a lensed, optically undetected 3.3 faint SMG (demagnified flux 2.5 mJy, intrinsic SFR of ), amplified by a 1 galaxy, with full characterization of its SED. Galaxies like this one are typically not included in the census of star-forming galaxies. This work is an attempt to uncover the physical properties of this elusive, but important, class of sources by adding one representative to the still sparse population of known faint, dusty, star-forming galaxies.
The paper is organized as follows. In Sects. 2 - 4 we describe the target identification, the ALMA observations and how we measure the photometry in the optical and near-infrared (NIR) bands. In Sect. 5 we present the physical properties of the studied source. Finally, in Sect. 6 we discuss and summarize our results. In the following, we adopt the -CDM concordance cosmological model (H0 = 70 km/s/Mpc, and ) and a Chabrier (2003) IMF. All magnitudes are in the AB system.
2 Target identification
The faint SMG studied in the present work was detected serendipitously by analysing a sample of sources in the COSMOS field in detail (Scoville et al. 2007) that shows a very high dust mass compared to their stellar mass.
Stellar masses were computed by performing a standard SED fitting with Bruzual & Charlot (2003) templates assuming exponentially declining SF histories (see details in Table 1 of Santini et al. 2015, method 6aτ) on the photometry from the UltraVISTA-DR1 –selected catalogue of Muzzin et al. (2013) (30 photometric bands). Dust masses were inferred by using the Draine & Li (2007) model (with the same technique as adopted by Santini et al. 2014) to fit the MIPS 24m (Le Floc’h et al. 2009) and Herschel photometry from the PEP (Lutz et al. 2011) and HerMES (Oliver et al. 2012) surveys with PACS and SPIRE instruments, respectively (see Lutz et al. 2011, and Berta et al. 2011 for a description of PACS catalogues and Roseboom et al. 2010, and Roseboom et al. 2012 for SPIRE catalogues, both based on prior knowledge of 24m positions).
In particular, we focused our attention on a galaxy at spectroscopic redshift of =1.1458 (from the Nov. 2015 zCOSMOS release, Lilly et al. 2009), located at RA=10:01:38.48 DEC=+02:37:35.03, with log/10.3 and an apparent log/9.7, which happened to be observed by ALMA. While such high dust-to-stellar mass ratios have been observed by a previous study (Pappalardo et al. 2016), ALMA observations demonstrate that at least part of the FIR flux is associated with a different source, 2 arcsec apart from the optically detected galaxy, located at RA=10:01:38.547 DEC=+02:37:36.70, which was undetected in the Muzzin et al. (2013) catalogue and even in the recent catalogue by Laigle et al. (2016) that is based on the UltraVISTA-DR2 data release.
In the following, we refer to these two galaxies as the optically detected and the ALMA-detected source, respectively. The latter will also be referred to as SMG, using the purely observational definition of the term.
3 ALMA observations and data analysis
ALMA archival observations of this sky region were carried out as part of the Cycle 2 project 2013.1.00034.S (PI N. Scoville), split into two runs (2014 July and December). The 12 m antennae (32 and 39) were distributed in compact configuration, with baselines ranging from 150 m to 1.09 km. The spectral configuration covered a 8 GHz band centred around 343.463 GHz (Band 7). Each of the four 2 GHz spectral windows was sampled in 128 channels. The on-source integration time was 242 seconds. As bandpass calibrators, J1058+0133 and J0825+0309 were observed for the runs in July and December, respectively. The flux calibrators were Titan and J1037-295, respectively. J1010-0200 and J1008+0621 were used as phase calibrators. The phases were centred at the position of the optically detected source described in the previous section.
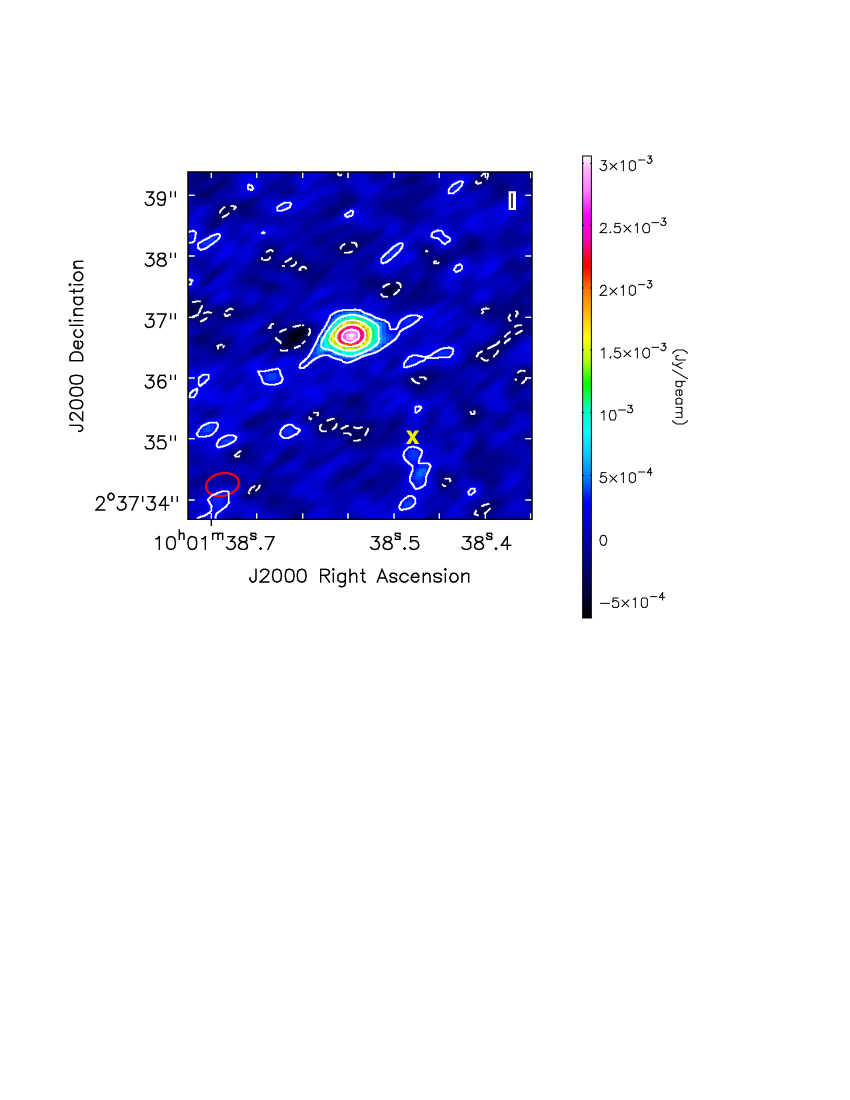
Observations were calibrated using the CASA pipeline version number 31667 (Pipeline-Cycle2-R1-B). The field was imaged using the clean task of CASA down to 0.3 mJy (2-3 the thermal noise) with mode ’mfs’ (Rau & Cornwell 2011) and weight ’briggs’, using CASA version 4.5.1. The RMS is 0.14 mJy/beam and the beam has a size of 0.540.37 arcsec and a position angle of -77.92 deg. The continuum image is shown in Fig. 1.
A very bright source, well above the 20 level, is clearly
visible 2 arcsec apart from the position of the optically detected
galaxy, at RA=10:01:38.547 DEC=+02.37.36.70. We note that the distance
between the two sources cannot be explained by ALMA astrometric
accuracy111https://help.almascience.org/index.php?/Knowledgebase/Article/
View/319/6/what-is-the-astrometric-accuracy-of-alma,
which, for our source, is of the order of a few arcsec
(see also Dunlop et al. 2016). As a further confirmation, we checked
that the astrometric uncertainty on the position derived from the maps
of the phase calibrators is lower than arcsec. Finally, the
ALMA position is consistent with the VLA position of a
radio-identified source (see Fig. 2 and
Sect. 5).
To avoid being affected by issues associated with the cleaning process, we measured the flux directly on the visibilities using the uvmodelfit task of CASA, assuming a Gaussian model. The integrated flux over the source is mJy (we added 10% of the flux in quadrature to the RMS to take the error in the calibration into account). The semimajor axes are and arcsec. Similar results are obtained when fitting a Gaussian source on the image and then deconvolving from the synthesized beam.
This source corresponds to galaxy ID=288391 of Scoville et al. (2016). However, they associated the ALMA flux with the optical galaxy (see their Table B1) and measured the flux on an aperture of up to 2.5” radius centred on the galaxy position. This explains the different flux reported by them.
4 Optical and near-infrared photometry
To measure the redshift and physical properties of the ALMA source, we extracted the photometry from the UltraVISTA-DR3 Y, J, H, Ks bands (McCracken et al. 2012), from the HST I814 band (Koekemoer et al. 2007), and from IRAC 3.6, 4.5, 5.0, 8.0m bands (Sanders et al. 2007).
As first step, we built the PSF of each image. For UltraVISTA and HST we used a sample of bright, unsaturated stars. For IRAC, the PSFs were obtained from synthetic instrument PSFs in the different channels taking into account the contribution to the final mosaic from observations at different position angles.
Secondly, for all bands we calibrated the RMS map and the background by injecting fake sources in empty areas of the images as described in Merlin et al. (2016).
We performed source detection for the ALMA-detected galaxy on the Ks band, where the faint source can be identified by visual inspection. This band provides the best compromise between source brightness and image resolution and allows us to separate the ALMA source from the close-by optically bright extended galaxy. Detection is obtained with SExtractor (Bertin & Arnouts 1996) after optimizing the relevant parameters in order to segment the area around our source in the most effective way while keeping the two sources as separated.
Since the faint source lies on the tail of the brighter close-by galaxy, the flux estimated by SExtractor may be contaminated. Therefore, we estimated the total flux in all UltraVISTA bands by adopting T-PHOT222 T-PHOT is a template-fitting photometry code developed within the ASTRODEEP project, designed to measure the photometry on low-resolution images by exploiting the prior information contained in images with higher resolution. (Merlin et al. 2015) on an area of 60x60 arcsec, thus taking into account the effect of source confusion. We adopted the I814 cutouts as high-resolution priors of the source light distribution, except for the ALMA-detected galaxy that is undetected in the I814 image (see below). For this source, we assumed a point-like object at the position detected by SExtractor on the Ks-band image. From the PSFs, we built convolution kernels between the I814 and the UltraVISTA bands. These kernels were fed to T-PHOT to extract template-fitting photometry.
We used a similar technique for the IRAC bands, where the two sources are highly blended, but used Ks-band cutouts as priors.
To measure the total HST I814 flux, we first calculated a convolution kernel by matching the I814 and the Ks-band PSFs. We then built a version of the I814 image matched to the image in Ks band, on which we ran SExtractor. We finally scaled the Ks-band total flux measured with T-PHOT according to the colour measured with SExtractor in one FWHM aperture (2 FWHM aperture for the more extended optically detected galaxy) between these two images.
We find that the ALMA source is well detected in all NIR bands, with a S/N of 10, 16, 8 and 12 in the H, Ks, IRAC CH1 and CH2 bands, respectively, 6 and 4 in Y and J, and 2–3 in CH3 and CH4, while in the I814 band we obtain a upper limit at AB26.6. The measured fluxes for both galaxies are given in Table 3.
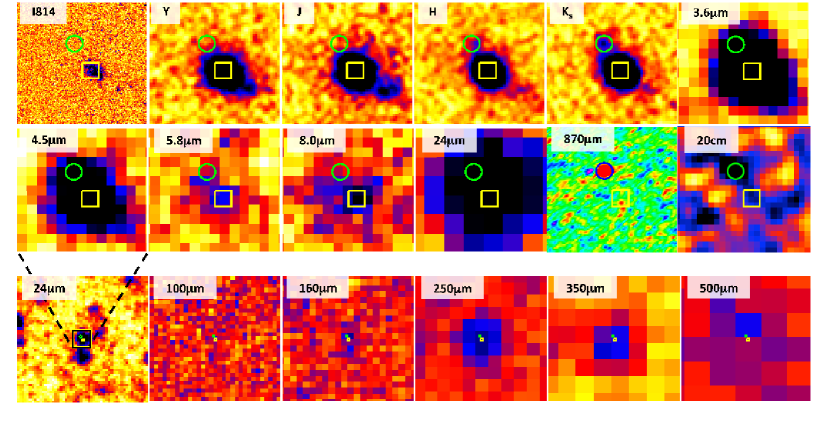
We show in Fig. 2 the postage stamps, in all available images from I814 to radio wavelengths, where the ALMA and the optical source are indicated. The ALMA-detected galaxy is not evident in a by-eye inspection on the Y and J bands, possibly because of blending with the brighter object, despite the relatively high S/N of the detection. We therefore checked the covariance index estimated by T-PHOT, that is, the ratio of the maximum covariance to the variance of the object itself. As discussed in Merlin et al. (2015), the covariance index gives an idea of the reliability of the fit, with strongly covariant objects (covariance index ) that might be affected by systematics. The covariance indexes for the Y and J bands are of the order of , indicating that the fit is reliable and the blending is not extreme and does not strongly affect the photometric uncertainty. Our detection is deeper than what is expected on the basis of the limiting aperture magnitudes of the images reported by the documentation attached to the UltraVISTA-DR3. This is possible since T-PHOT estimates the photometry by weighting the source central region more than the external (noisier) parts, at variance with an aperture photometry giving equal weight to the entire extension of the source, thus allowing for a better S/N.
| lensed source | lens | |||
|---|---|---|---|---|
| (ALMA-detected) | (optically detected) | |||
| Instrument | Filter | Central | Flux | Flux |
| [m] | [Jy] | [Jy] | ||
| ACS/HST | I814W | 0.79 | 0.085 | 3.44 0.12 |
| VIRCAM/VISTA | Y | 1.02 | 0.171 0.028 | 5.726 0.037 |
| VIRCAM/VISTA | J | 1.25 | 0.124 0.030 | 7.871 0.040 |
| VIRCAM/VISTA | H | 1.65 | 0.455 0.043 | 11.357 0.059 |
| VIRCAM/VISTA | Ks | 2.15 | 0.902 0.057 | 17.600 0.077 |
| IRAC/Spitzer | CH1 | 3.56 | 2.12 0.27 | 24.2 1.2 |
| IRAC/Spitzer | CH2 | 4.51 | 4.33 0.35 | 22.1 1.5 |
| IRAC/Spitzer | CH3 | 5.74 | 6.8 2.1 | 15.3 8.5 |
| IRAC/Spitzer | CH4 | 7.90 | 4.1 2.4 | 30 11 |
| PACS/Herschel | 100m | 101.74 | ||
| PACS/Herschela | 160m | 164.19 | ||
| SPIRE/Herschela | 250m | 251.89 | ||
| SPIRE/Herschela | 350m | 351.92 | ||
| SPIRE/Herschela | 500m | 509.81 | ||
| ALMA | Band 7 | 873.37 | – | |
| VLA | Band L | 64 11 | – | |
The photometry of the ALMA-detected source has not been corrected for magnification.
a Photometry in the 160, 250, 350 and 500 m Herschel bands has been estimated through assumptions (see text) rather than directly measured.
b The RMS value includes confusion noise.
5 Physical properties
We fit the photometry from the I814 band to IRAC with the PEGASE 2.0 templates (Fioc & Rocca-Volmerange 1997) using our own code zphot.exe (Fontana et al. 2000; Santini et al. 2015). We infer a photometric redshift of 3.28 (Fig. 3). The adoption of the Bruzual & Charlot (2003) library (see below) instead of PEGASE 2.0 gives a very similar solution (=3.25). Although the curve is somewhat broad, a value for the photometric redshift between 3 and 3.5 is also confirmed by the starburst FIR-radio SED of Yun & Carilli (2002), based on the location of the FIR peak (see below for a derivation of the FIR fluxes), while the lower and higher redshift solutions are excluded by the same template.
We note that the Y band scatters from the best fit by 2. We do not expect strong emission lines at the rest-frame wavelength corresponding to the observed Y band, unless the true redshift is inconsistent with the inferred photo-z curve. Such a discrepancy between the observed flux and the best-fit template, as well as the broadness of the curve, reflect the difficulty in measuring the photometry in these complex situations (a faint source on the tail of a bright one).

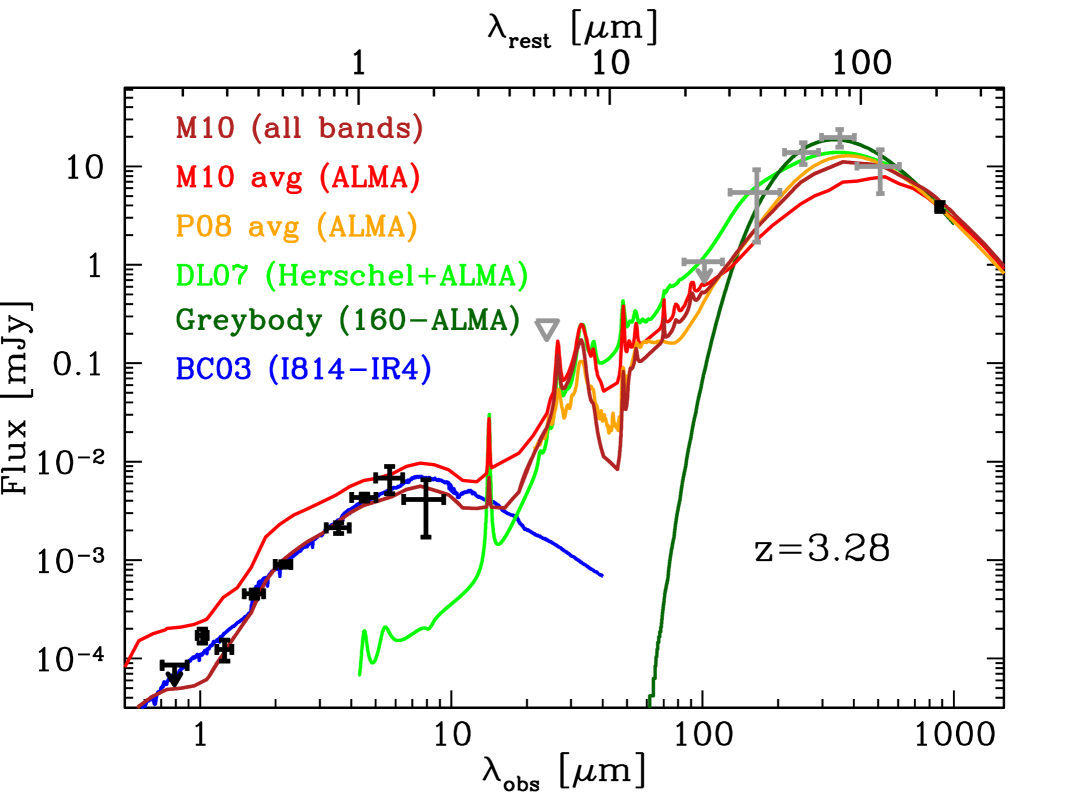
With the inferred best-fit redshift, we fit the same photometric bands with the Bruzual & Charlot (2003) library built by assuming exponentially decreasing SF histories and adopting the very same assumptions in terms of parameter grid, priors, etc. as detailed in Table 1 of Santini et al. (2015, see column named Method 6aτ), except for the metallicity that cannot be super-solar. We obtain a stellar mass of . The best fit is shown as a blue curve in Fig. 4, and the best-fit parameters are given in Table 5.
Given the proximity of the two galaxies on the line of sight, it is impossible to properly deblend the MIPS and Herschel fluxes (the FWHMs range from 5 to 36 arcsec from 24m to 500m). To fully characterize the FIR-submm SED of the ALMA-detected SMG, we started from the tentative assumption that the 24m emission ( Jy) is completely associated with the optically detected source, as the MIPS image is not deep enough to detect galaxies at . We assumed that the optical galaxy can be described by the Main Sequence template of Elbaz et al. (2011), as confirmed by its best-fit stellar mass of and SFR of (the latter has been obtained by fixing this template to the observed 24m flux and adding the unobscured component following Santini et al. 2009). We estimated the Herschel fluxes of the optically detected galaxy by normalizing the Main Sequence template of Elbaz et al. (2011) to the 24m flux and integrating on Herschel filters. By subtracting the obtained values from the Herschel photometry of the blended galaxy system and adding in quadrature an uncertainty of 35% on the model (see Elbaz et al. 2011), we estimated the Herschel fluxes of the ALMA source. We then subtracted the 24m flux predicted by fitting the Herschel+ALMA bands of the ALMA-detected galaxy with the Draine & Li (2007) templates from the total value and repeated the procedure, which converged after four iterations. The Herschel fluxes estimated for the ALMA-detected galaxy account for 51-69% of the total flux, depending on the band, while only less than 10% of the 24m is attributed to it. Since the system is undetected at 100m in the public Herschel catalogue, and this catalogue is cut at 3, we recomputed the photometry in this band with T-PHOT to infer a 1 upper limit.
We can therefore build the full I814-to-submm SED of the ALMA source and fit it with the SMG library of Michałowski et al. (2010b). The best-fit is shown as a brownish curve in Fig. 4. The inferred total (8-1000 m) IR luminosity, tracing the obscured SFR, is . Since Herschel fluxes are estimated through an indirect procedure and through assumptions that are not necessarily verified, we verified that the result is unchanged if we exclude Herschel bands from the fit. Furthermore, we fit the ALMA flux with the average SMG templates of Michałowski et al. (2010b) and of Pope et al. (2008) (red and orange curves). These provide of and , respectively. The dispersion of the above values is likely indicative of the uncertainties associated with the total IR luminosity. For this reason, we decided to adopt the mean value and standard dispersion as an estimate of the true and its error bar. We obtain .
The total SFR is computed by adding the obscured and unobscured components following the prescriptions adopted by Santini et al. (2009, see references therein), calibrated to the adopted IMF:
| (1) |
| (2) |
where is the rest-frame UV luminosity, uncorrected for extinction, derived from the optical-to-NIR SED fitting. We infer . As expected for this type of sources, the obscured component () strongly dominates the total SFR (99%). Moreover, the total SFR obtained from the UV and IR emission is higher than what is obtained by correcting the optical-to-NIR emission for dust extinction (, although with a huge uncertainty, inferred from the same fit to derive the stellar mass), confirming the necessity of measuring the dust-enshrouded SFR to achieve an unbiased view of the cosmic SFH, especially at these redshifts (see e.g. Santini et al. 2009, Dunlop et al. 2016).
In the 20 cm VLA catalogue of Bondi et al. (2008) we found a radio counterpart of our faint SMG at RA=10:01:38.558, DEC=+02:37:36.85, consistent with the ALMA position. By adopting the prescriptions of Barger et al. (2012), the radio flux of Jy translates into an SFR estimate of . According to Bell (2003), the scatter in the FIR–radio correlation, upon which the derivation is based, implies an uncertainty of a factor of 2 in the resulting SFR.
To search for an additional probe of the SFR, we looked for X-ray counterparts in the Chandra catalogue of Civano et al. (2016) but found none. Given the limiting depth of this catalogue, a non-detection implies a 0.5-10 keV flux lower than erg cm-2 s-1.
Finally, the fit with Draine & Li (2007) templates (light green curve in the figure) gives a dust mass of , while the fit with a modified blackbody (dark green curve) with emissivity index and absorption cross section per unit dust mass at 240m of 5.17 cm2/g (Li & Draine 2001; Draine & Lee 1984) gives and (the 100m band is not used in the fitting to avoid contamination from a hotter component, Magnelli et al. 2010). The dust mass agrees with what is inferred from the model of Draine & Li (2007) after considering the scaling factor of 1.5. Indeed, the attempt of reproducing the Wien side and at the same time the Rayleigh-Jeans side of the modified blackbody spectrum (instead of fitting a multi-temperature grain distribution) has the effect of overestimating the dust temperature and hence underestimating the dust mass, which is inversely proportional to the blackbody intensity (Santini et al. 2014 and references therein; Berta et al. 2016). The best-fit temperature is in very good agreement with the values and K found by da Cunha et al. (2015) on the optically bright (they defined the subsample of SMGs detected in at least four optical/NIR bands as “optically bright”; considering the different depth of the photometry used in the two works, our source would be classified as optically bright according to their criterion) and 2.7 subsamples, respectively. As done for the SFR, we also computed the dust mass from the ALMA flux only by assuming a temperature of 40K and obtained , confirming the robustness of the result independently of the Herschel photometry. The inferred values for the dust mass support the dust richness of SMGs with respect to their stellar content compared to local star-forming galaxies and ULIRGs (e.g. Santini et al. 2010; Lo Faro et al. 2013; Rowlands et al. 2014; Zavala et al. 2015).
As a sanity check, we also fit the full SED of our source with CIGALE444http://cigale.lam.fr/ (Noll et al. 2009), which provides a self-consistent estimate of the stellar mass, SFR and dust mass by accounting for the energy balance between dust absorption and re-emission. The Bayesian analysis gives , SFR and (, SFR and excluding Herschel bands), consistent with the values obtained above.
The physical properties inferred for the SMG studied in this work agree with those reported by da Cunha et al. (2015) for their sample of SMGs from the LESS survey (Weiß et al. 2009) observed by ALMA.
| lensed source | lens | |
| (ALMA-detected) | (optically detected) | |
| RA (J2000) | 150.4106125 | 150.410339 |
| DEC (J2000) | 2.6268611 | 2.626380 |
| 3.28 (phot.) | 1.1458 (spec.) | |
| [] | ||
| [/] | ||
| [/] | ||
| [/] | – | |
| [] | – | |
| – | ||
| age [Gyr] | ||
| [Gyr] | ||
| E(B-V) [mag] | ||
| 1.0 | 1.0 | |
| – |
6 Discussion and conclusions
The =3.28 SMG studied in the present work lies very close (2 arcsec) to the line of sight of a massive 1 galaxy (see Sect. 2). The flux of the background source is therefore likely to be boosted by gravitational lensing effects, a phenomenon quite common in the submillimeter (Negrello et al. 2010; Vieira et al. 2013; Weiß et al. 2013).
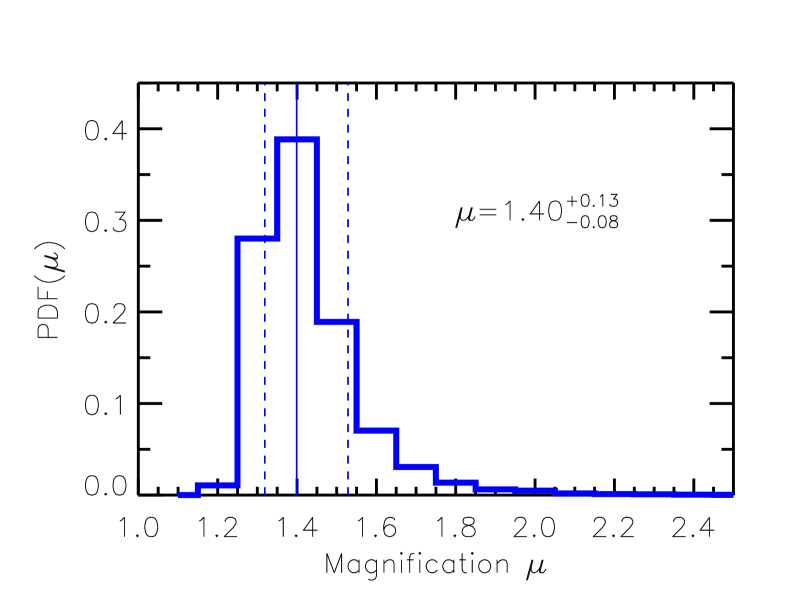
The magnification factor arising from the lens has been estimated by modelling the lens as a singular isothermal sphere (Mason et al. 2015, and references therein) where the velocity dispersion is estimated via the rest-frame K-band Tully & Fisher (1977) relation inferred by Tiley et al. (2016) at 1 and dividing the rotation velocity by (Kochanek et al. 2004). The estimated velocity dispersion for the lens is 20920 km/s. The velocity dispersion scales with the dark matter mass in the system and so is the best indicator of the strength of the gravitational lens (Turner et al. 1984; Schneider et al. 2006; Treu et al. 2010). The uncertainty in the Tully-Fisher relation gives rise to a distribution of magnification factors. The resulting distribution, shown in Fig. 5, has a median value of . However, a singular isothermal sphere may not be the best model for this lens, which seems to be elongated along the SW-to-NE direction. According to Barone-Nugent et al. (2015), a singular isothermal ellipsoid may be a more realistic parameterization. Despite more complicate calculations, they claimed that for low ellipticities (), as is the case of our source (SExtractor estimates on the I814 band), the magnification increases by when the distant source is located in the direction of the lens’ major axis. We therefore adopted a value of as an estimate of the magnification factor.
A magnification factor of 1.54 implies that the intrinsic SFR of our SMG is between 154 and 300 (depending on the chosen SFR tracer), a value consistent with that of the population of faint SMGs that are important contributors to the cosmic SFH (Ono et al. 2014). Most importantly, being undetected in optical, this galaxy is representative of the elusive dust-enshrouded star-forming population that is typically not included in the measured SFH (nor in the stellar mass density), even in a relatively well-studied and deeply observed field such as COSMOS. With an intrinsic Ks-band magnitude of 24.5 and submm flux 2.5 mJy, this source is a factor of 2 fainter than the knee of the differential number counts at 1.2 mm (Fujimoto et al. 2016) (based on extrapolation from the fits). In particular, this is one of the still few faint optically undetected SMGs (with an identified NIR counterpart) known to date with full SED characterization, which allows us not only to accurately estimate the redshift but also to measure its stellar mass and other physical properties (see e.g. da Cunha et al. 2015 for a similar SED characterization of the ALESS SMGs). It adds one member to the still sparse population of known faint, dusty, star-forming galaxies.
Do the SF properties of the faint SMG studied in this work resemble those of “normal” star-forming galaxies or those of extreme starbursts? To answer this question, we first consider the physical size of our source. At , the size measured on ALMA data translates into a physical size of kpc. This value is perfectly consistent with the average size inferred by Hodge et al. (2016) for a sample of 16 bright 2.5 ALESS SMGs, whose formation, according to the authors, may be due to major mergers. The measured size is larger than the 1 kpc size inferred by Simpson et al. (2015) and Ikarashi et al. (2015) for bright high- SMGs, and smaller than 2.7 kpc, which is what is expected by extrapolating the results of van der Wel et al. (2014) for late-type galaxies at the redshift and stellar mass of our source. The compactness compared to normal star-forming galaxies is another indication that the properties of our faint SMGs resemble those of starbursts. Where is this source located with respect to the Main Sequence (Speagle et al. 2014, and references therein) of star-forming galaxies? By assuming the Main Sequence parameterization of Schreiber et al. (2015) (after converting stellar masses and SFRs from a Chabrier IMF into a Salpeter IMF by adding 0.24 dex, Santini et al. 2012, and 0.15 dex, Davé 2008, respectively) and that the Main Sequence/starburst separation criterion by Rodighiero et al. (2011) extends to 3, this galaxy would not be classified as a rare starburst, although it lies on the upper envelope of the Main Sequence (close to the region of starburst galaxies when the FIR-based SFR is adopted). However, its ”starburstiness” , defined as the ratio between the specific SFR () and the SSFR of a galaxy of the same mass located on the Main Sequence (, Elbaz et al. 2011) is between 2 and 3.8 (depending on the adopted SFR tracer). According to Elbaz et al. (2011), starburstiness higher than 2 is indicative of a starburst nature. A different criterion for distinguishing starbursts from normal Main Sequence galaxies is suggested by Tan et al. (2014) at high redshift (), based on the dust-to-stellar mass ratio: while this ratio is expected to rise out to 2.5 and then decrease for Main Sequence galaxies, starbursts are observed to be more dust-rich at high redshift, providing evidence of an early metal enrichment. The observed of our source is 0.03, in agreement with what has been observed by Tan et al. (2014) for starburst galaxies at similar redshift and above the average ratio for Main Sequence galaxies reported by Béthermin et al. (2015). All this is consistent with the results of Yamaguchi et al. (2016), who found that while four out of the five faint SMGs of their sample are located in the Main Sequence, the only source that is faint at optical and NIR wavelengths is a starburst galaxy.
Observing even more galaxies like the one studied in this work is of major importance to reach a full understanding of the population of faint SMGs in the early Universe and for better constraining the cosmic star formation history through a complete census of star-forming galaxies. Indeed, at these redshifts, the latter is so far almost completely and critically dependent on optical detections and dust corrections. The rapidly increasing number of observations carried out with ALMA, as well as the advent of JWST for their characterization, will be of great help in the near future.
Acknowledgements.
We thank the anonymous referee for the thorough review and helpful comments. PS thanks D. Burgarella and M. Boquien for support in using CIGALE and J. Dunlop for a critical review of the manuscript. The research leading to these results has received funding from the European Union Seventh Framework Programme ASTRODEEP (FP7/2007-2013) under grant agreement n∘ 312725. RM and RA acknowledge support from the ERC Advanced Grant 695671 QUENCH. This paper makes use of the following ALMA data: ADS/JAO.ALMA#2013.1.00034.S. ALMA is a partnership of ESO (representing its member states), NSF (USA) and NINS (Japan), together with NRC (Canada), NSC and ASIAA (Taiwan) and KASI (Republic of Korea), in cooperation with the Republic of Chile. The Joint ALMA Observatory is operated by ESO, AUI/NRAO and NAOJ. Based on data products from observations made with ESO Telescopes at the La Silla Paranal Observatory under ESO programme ID 179.A-2005 and on data products produced by TERAPIX and the Cambridge Astronomy Survey Unit on behalf of the UltraVISTA consortium.References
- Amorín et al. (2014) Amorín, R., Grazian, A., Castellano, M., et al. 2014, ApJ, 788, L4
- Aravena et al. (2016) Aravena, M., Decarli, R., Walter, F., et al. 2016, ArXiv: 1607.06769
- Barger et al. (2012) Barger, A. J., Wang, W.-H., Cowie, L. L., et al. 2012, ApJ, 761, 89
- Barone-Nugent et al. (2015) Barone-Nugent, R. L., Wyithe, J. S. B., Trenti, M., et al. 2015, MNRAS, 450, 1224
- Bell (2003) Bell, E. F. 2003, ApJ, 586, 794
- Berta et al. (2016) Berta, S., Lutz, D., Genzel, R., Förster-Schreiber, N. M., & Tacconi, L. J. 2016, A&A, 587, A73
- Berta et al. (2011) Berta, S., Magnelli, B., Nordon, R., et al. 2011, A&A, 532, A49+
- Bertin & Arnouts (1996) Bertin, E. & Arnouts, S. 1996, A&AS, 117, 393
- Béthermin et al. (2015) Béthermin, M., Daddi, E., Magdis, G., et al. 2015, A&A, 573, A113
- Béthermin et al. (2011) Béthermin, M., Dole, H., Lagache, G., Le Borgne, D., & Penin, A. 2011, A&A, 529, A4
- Bondi et al. (2008) Bondi, M., Ciliegi, P., Schinnerer, E., et al. 2008, ApJ, 681, 1129
- Bourne et al. (2016) Bourne, N., Dunlop, J. S., Merlin, E., et al. 2016, ArXiv: 1607.04283
- Bouwens et al. (2016) Bouwens, R., Aravena, M., Decarli, R., et al. 2016, ArXiv: 1606.05280
- Bruzual & Charlot (2003) Bruzual, G. & Charlot, S. 2003, MNRAS, 344, 1000
- Burgarella et al. (2013) Burgarella, D., Buat, V., Gruppioni, C., et al. 2013, A&A, 554, A70
- Caputi et al. (2014) Caputi, K. I., Michałowski, M. J., Krips, M., et al. 2014, ApJ, 788, 126
- Casey et al. (2013) Casey, C. M., Chen, C.-C., Cowie, L. L., et al. 2013, MNRAS, 436, 1919
- Casey et al. (2014) Casey, C. M., Narayanan, D., & Cooray, A. 2014, Phys. Rep, 541, 45
- Castellano et al. (2014) Castellano, M., Sommariva, V., Fontana, A., et al. 2014, A&A, 566, A19
- Castellano et al. (2016) Castellano, M., Yue, B., Ferrara, A., et al. 2016, ApJ, 823, L40
- Chabrier (2003) Chabrier, G. 2003, ApJ, 586, L133
- Chapman et al. (2005) Chapman, S. C., Blain, A. W., Smail, I., & Ivison, R. J. 2005, ApJ, 622, 772
- Chen et al. (2014) Chen, C.-C., Cowie, L. L., Barger, A. J., Wang, W.-H., & Williams, J. P. 2014, ApJ, 789, 12
- Civano et al. (2016) Civano, F., Marchesi, S., Comastri, A., et al. 2016, ApJ, 819, 62
- da Cunha et al. (2015) da Cunha, E., Walter, F., Smail, I. R., et al. 2015, ApJ, 806, 110
- Davé (2008) Davé, R. 2008, MNRAS, 385, 147
- Draine & Lee (1984) Draine, B. T. & Lee, H. M. 1984, ApJ, 285, 89
- Draine & Li (2007) Draine, B. T. & Li, A. 2007, ApJ, 657, 810
- Dunlop et al. (2016) Dunlop, J. S., McLure, R. J., Biggs, A. D., et al. 2016, ArXiv: 1606.00227
- Elbaz et al. (2011) Elbaz, D., Dickinson, M., Hwang, H. S., et al. 2011, A&A, 533, A119
- Fioc & Rocca-Volmerange (1997) Fioc, M. & Rocca-Volmerange, B. 1997, A&A, 326, 950
- Fontana et al. (2000) Fontana, A., D’Odorico, S., Poli, F., et al. 2000, AJ, 120, 2206
- Fujimoto et al. (2016) Fujimoto, S., Ouchi, M., Ono, Y., et al. 2016, ApJS, 222, 1
- Grazian et al. (2015) Grazian, A., Fontana, A., Santini, P., et al. 2015, A&A, 575, A96
- Greve et al. (2005) Greve, T. R., Bertoldi, F., Smail, I., et al. 2005, MNRAS, 359, 1165
- Hodge et al. (2013) Hodge, J. A., Karim, A., Smail, I., et al. 2013, ApJ, 768, 91
- Hodge et al. (2016) Hodge, J. A., Swinbank, A. M., Simpson, J. M., et al. 2016, ArXiv: 1609.09649
- Hsu et al. (2016) Hsu, L.-Y., Cowie, L. L., Chen, C.-C., Barger, A. J., & Wang, W.-H. 2016, ApJ, 829, 25
- Hughes et al. (1998) Hughes, D. H., Serjeant, S., Dunlop, J., et al. 1998, Nature, 394, 241
- Ikarashi et al. (2015) Ikarashi, S., Ivison, R. J., Caputi, K. I., et al. 2015, ApJ, 810, 133
- Kochanek et al. (2004) Kochanek, C., Schneider, P., & Wambsganss, J. 2004, in Part 2 of Gravitational Lensing: Strong, Weak & Micro, ed. P. J. . P. N. G. Meylan, Proceedings of the 33rd Saas-Fee Advanced Course
- Koekemoer et al. (2007) Koekemoer, A. M., Aussel, H., Calzetti, D., et al. 2007, ApJS, 172, 196
- Koprowski et al. (2016) Koprowski, M. P., Dunlop, J. S., Michałowski, M. J., et al. 2016, MNRAS, 458, 4321
- Laigle et al. (2016) Laigle, C., McCracken, H. J., Ilbert, O., et al. 2016, ApJS, 224, 24
- Le Borgne et al. (2009) Le Borgne, D., Elbaz, D., Ocvirk, P., & Pichon, C. 2009, A&A, 504, 727
- Le Floc’h et al. (2009) Le Floc’h, E., Aussel, H., Ilbert, O., et al. 2009, ApJ, 703, 222
- Li & Draine (2001) Li, A. & Draine, B. T. 2001, ApJ, 554, 778
- Lilly et al. (2009) Lilly, S. J., Le Brun, V., Maier, C., et al. 2009, ApJS, 184, 218
- Lilly et al. (1996) Lilly, S. J., Le Fevre, O., Hammer, F., & Crampton, D. 1996, The Astrophysical Journal Letters, 460, L1+
- Lo Faro et al. (2013) Lo Faro, B., Franceschini, A., Vaccari, M., et al. 2013, ApJ, 762, 108
- Lutz et al. (2011) Lutz, D., Poglitsch, A., Altieri, B., et al. 2011, A&A, 532, A90+
- Madau & Dickinson (2014) Madau, P. & Dickinson, M. 2014, ARA&A, 52, 415
- Madau et al. (1996) Madau, P., Ferguson, H. C., Dickinson, M. E., et al. 1996, Royal Astronomical Society, Monthly Notices, 283, 1388
- Magnelli et al. (2010) Magnelli, B., Lutz, D., Berta, S., et al. 2010, A&A, 518, L28
- Magnelli et al. (2012) Magnelli, B., Lutz, D., Santini, P., et al. 2012, A&A, 539, A155
- Mason et al. (2015) Mason, C. A., Treu, T., Schmidt, K. B., et al. 2015, ApJ, 805, 79
- McCracken et al. (2012) McCracken, H. J., Milvang-Jensen, B., Dunlop, J., et al. 2012, A&A, 544, A156
- Merlin et al. (2016) Merlin, E., Amorín, R., Castellano, M., et al. 2016, A&A, 590, A30
- Merlin et al. (2015) Merlin, E., Fontana, A., Ferguson, H. C., et al. 2015, A&A, 582, A15
- Michałowski et al. (2010a) Michałowski, M., Hjorth, J., & Watson, D. 2010a, A&A, 514, A67+
- Michałowski et al. (2010b) Michałowski, M. J., Watson, D., & Hjorth, J. 2010b, ApJ, 712, 942
- Muzzin et al. (2013) Muzzin, A., Marchesini, D., Stefanon, M., et al. 2013, ApJS, 206, 8
- Negrello et al. (2010) Negrello, M., Hopwood, R., De Zotti, G., et al. 2010, Science, 330, 800
- Noll et al. (2009) Noll, S., Burgarella, D., Giovannoli, E., et al. 2009, A&A, 507, 1793
- Oliver et al. (2012) Oliver, S. J., Bock, J., Altieri, B., et al. 2012, MNRAS, 424, 1614
- Ono et al. (2014) Ono, Y., Ouchi, M., Kurono, Y., & Momose, R. 2014, ApJ, 795, 5
- Oteo et al. (2016) Oteo, I., Zwaan, M. A., Ivison, R. J., Smail, I., & Biggs, A. D. 2016, ApJ, 822, 36
- Pappalardo et al. (2016) Pappalardo, C., Bizzocchi, L., Fritz, J., et al. 2016, A&A, 589, A11
- Pope et al. (2008) Pope, A., Chary, R.-R., Alexander, D. M., et al. 2008, ApJ, 675, 1171
- Pope et al. (2006) Pope, A., Scott, D., Dickinson, M., et al. 2006, MNRAS, 370, 1185
- Rau & Cornwell (2011) Rau, U. & Cornwell, T. J. 2011, A&A, 532, A71
- Rodighiero et al. (2011) Rodighiero, G., Daddi, E., Baronchelli, I., et al. 2011, ApJ, 739, L40
- Roseboom et al. (2012) Roseboom, I. G., Ivison, R. J., Greve, T. R., et al. 2012, MNRAS, 419, 2758
- Roseboom et al. (2010) Roseboom, I. G., Oliver, S. J., Kunz, M., et al. 2010, MNRAS, 409, 48
- Rowlands et al. (2014) Rowlands, K., Dunne, L., Dye, S., et al. 2014, MNRAS, 441, 1017
- Sanders et al. (2007) Sanders, D. B., Salvato, M., Aussel, H., et al. 2007, ApJS, 172, 86
- Santini et al. (2015) Santini, P., Ferguson, H. C., Fontana, A., et al. 2015, ApJ, 801, 97
- Santini et al. (2009) Santini, P., Fontana, A., Grazian, A., et al. 2009, A&A, 504, 751
- Santini et al. (2012) Santini, P., Fontana, A., Grazian, A., et al. 2012, A&A, 538, A33
- Santini et al. (2014) Santini, P., Maiolino, R., Magnelli, B., et al. 2014, A&A, 562, A30
- Santini et al. (2010) Santini, P., Maiolino, R., Magnelli, B., et al. 2010, A&A, 518, L154
- Schneider et al. (2006) Schneider, P., Kochanek, C., & Wambsganss, J. 2006, Gravitational Lensing: Strong, Weak and Micro (Springer)
- Schreiber et al. (2015) Schreiber, C., Pannella, M., Elbaz, D., et al. 2015, A&A, 575, A74
- Scoville et al. (2007) Scoville, N., Aussel, H., Brusa, M., et al. 2007, ApJS, 172, 1
- Scoville et al. (2016) Scoville, N., Sheth, K., Aussel, H., et al. 2016, ApJ, 820, 83
- Simpson et al. (2015) Simpson, J. M., Smail, I., Swinbank, A. M., et al. 2015, ApJ, 799, 81
- Simpson et al. (2014) Simpson, J. M., Swinbank, A. M., Smail, I., et al. 2014, ApJ, 788, 125
- Speagle et al. (2014) Speagle, J. S., Steinhardt, C. L., Capak, P. L., & Silverman, J. D. 2014, ApJS, 214, 15
- Swinbank et al. (2014) Swinbank, A. M., Simpson, J. M., Smail, I., et al. 2014, MNRAS, 438, 1267
- Tacconi et al. (2008) Tacconi, L. J., Genzel, R., Smail, I., et al. 2008, ApJ, 680, 246
- Tan et al. (2014) Tan, Q., Daddi, E., Magdis, G., et al. 2014, A&A, 569, A98
- Tiley et al. (2016) Tiley, A. L., Stott, J. P., Swinbank, A. M., et al. 2016, MNRAS, 460, 103
- Treu (2010) Treu, T. 2010, ARA&A, 48, 87
- Treu et al. (2010) Treu, T., Auger, M. W., Koopmans, L. V. E., et al. 2010, ApJ, 709, 1195
- Tully & Fisher (1977) Tully, R. B. & Fisher, J. R. 1977, A&A, 54, 661
- Turner et al. (1984) Turner, E. L., Ostriker, J. P., & Gott, III, J. R. 1984, ApJ, 284, 1
- van der Wel et al. (2014) van der Wel, A., Franx, M., van Dokkum, P. G., et al. 2014, ApJ, 788, 28
- van der Wel et al. (2013) van der Wel, A., van de Ven, G., Maseda, M., et al. 2013, ApJ, 777, L17
- Vanzella et al. (2016) Vanzella, E., De Barros, S., Cupani, G., et al. 2016, ApJ, 821, L27
- Vieira et al. (2013) Vieira, J. D., Marrone, D. P., Chapman, S. C., et al. 2013, Nature, 495, 344
- Viero et al. (2013) Viero, M. P., Moncelsi, L., Quadri, R. F., et al. 2013, ApJ, 779, 32
- Viero et al. (2015) Viero, M. P., Moncelsi, L., Quadri, R. F., et al. 2015, ApJ, 809, L22
- Wang et al. (2016) Wang, T., Elbaz, D., Schreiber, C., et al. 2016, ApJ, 816, 84
- Watson et al. (2015) Watson, D., Christensen, L., Knudsen, K. K., et al. 2015, Nature, 519, 327
- Weiß et al. (2013) Weiß, A., De Breuck, C., Marrone, D. P., et al. 2013, ApJ, 767, 88
- Weiß et al. (2009) Weiß, A., Kovács, A., Coppin, K., et al. 2009, ApJ, 707, 1201
- Yamaguchi et al. (2016) Yamaguchi, Y., Tamura, Y., Kohno, K., et al. 2016, PASJ, 68, 82
- Yun & Carilli (2002) Yun, M. S. & Carilli, C. L. 2002, ApJ, 568, 88
- Zavala et al. (2015) Zavala, J. A., Yun, M. S., Aretxaga, I., et al. 2015, MNRAS, 452, 1140