Interstellar medium and star formation studies with the Square Kilometre Array
P. Manoj1, S. Vig2, Maheswar, G.3, U. S. Kamath4 and A. Tej2
1 Tata Institute of Fundamental Research, Homi Bhabha Rd, Mumbai 400 005 (manoj.puravankara@tifr.res.in)
2 Indian Institute of Space Science and Technology, Valiamala, Thiruvananthapuram 695 547
3 Aryabhatta Research Institute of Observational Sciences, Manora Peak, Nainital, 263 129
4 Indian Institute of Astrophysics, Sarjapur Road, Koramangala, Bangalore 560034
(To appear in Journal of Astrophysics and Astronomy (JOAA) special issue on ”Science with the SKA: an Indian perspective”)
Abstract
Stars and planetary systems are formed out of molecular clouds in the interstellar medium. Although the sequence of steps involved in star formation are generally known, a comprehensive theory which describes the details of the processes that drive formation of stars is still missing. The Square Kilometre Array (SKA), with its unprecedented sensitivity and angular resolution, will play a major role in filling these gaps in our understanding. In this article, we present a few science cases that the Indian star formation community is interested in pursuing with SKA, which include investigation of AU-sized structures in the neutral ISM, the origin of thermal and non-thermal radio jets from protostars and the accretion history of protostars, and formation of massive stars and their effect on the surrounding medium.
Keywords: H II regions – ISM: jets and outflows – ISM: structure – stars: formation – stars: protostars
Introduction
The formation of stars and planetary systems out of interstellar clouds is one of the central problems in contemporary astrophysics. Multi-wavelength observational studies, augmented by theoretical and laboratory studies in the last three decades or so have been successful in providing a framework to understand the formation of stars and planetary systems. In the current paradigm for low-mass star formation, the process begins with the gravitational collapse of a slowly rotating cloud core, leading to the formation of a central protostar surrounded by a rotating disk and an overlying envelope from which the material rains down onto the disk (see reviews: Shu et al., 1987a; McKee & Ostriker, 2007). Since the total angular momentum is conserved during the collapse, the high angular momentum material in the outer envelope first collapses to form a disk, before getting accreted onto the central protostar (Ulrich, 1976; Cassen & Moosman, 1981; Terebey et al., 1984). In the early embedded stages, the system drives powerful bipolar jets/outflows, the origin of which is not entirely understood. As the system evolves, the envelope dissipates either by draining onto the disk or is cleared out by stellar winds and outflows, leaving behind a young pre-main sequence star surrounded by a disk. Planetary systems are formed out of such protoplanetary disks which are the natural byproducts of star formation process (e.g. Stahler & Palla, 2004; Hartmann, 2009). Although the different stages in the formation of star and planetary systems are broadly understood, the details of the various processes that drive star and planet formation are only poorly understood. Several questions remain to be answered. How are molecular clouds formed out of the neutral Interstellar medium (ISM) and how long do they last? What processes controls the efficiency of star formation in molecular clouds? What determines the final stellar mass? What drives the accretion in protostars? What is the launching mechanisms for the jets in young stars? How are they collimated and accelerated to such large distances? In addition, as opposed to low-mass star formation, there is no coherent picture yet for the formation of massive stars.
The Square Kilometre Array (SKA), with its unprecedented sensitivity and angular resolution, will play a major role in answering several of these questions. Below we discuss a few of problems in interstellar medium and star formation that SKA will directly address.
Investigation of the AU-sized structures in ISM: SKA-TMT Synergies
The 21-cm absorption observable in the spectra of bright continuum sources in the background are used to probe the properties of the cold atomic component of interstellar medium (ISM). Several interferometric studies of the bright extended sources have revealed the existence of structures in cold HI gas (Clark et al., 1962; Clark, 1965). Subsequently, over the past few decades, both observations and theory have provided ample evidence for the existence of structures in the ISM on scales from 1 kpc down to 1 pc (e.g., Dickey & Lockman, 1990). Adopting typical values of thermal pressure, temperature and observed column density of the cold neutral medium (CNM) as cm-3 K (Jenkins & Tripp, 2001), T70 K (Heiles & Troland, 2003) and cm-2 (Heiles & Troland, 2003), the typical expected scale length for CNM feature is about 1 pc. Thus it came as a surprise when observers began to report structures on AU scales in several sightlines. These results were based on spatial mapping of the HI absorption-line profiles across extended extragalactic background sources (e.g., Dieter et al., 1976; Diamond et al., 1989; Davis et al., 1996; Faison & Goss, 2001; Brogan et al., 2005; Goss et al., 2008; Roy et al., 2012), temporal and spatial variations of optical interstellar absorption lines (like NaI D and CaIIK) against binary stars (Meyer & Blades, 1996; Watson & Meyer, 1996; Welty et al., 2008; Smith et al., 2013), globular clusters (Meyer & Lauroesch, 1999; Welsh et al., 2009), and the time variability of HI absorption profiles against high proper motion pulsars (Deshpande et al., 1992; Frail et al., 1994; Johnston et al., 2003). In addition to these, the presence of AU-sized structures in the ionized (Fiedler et al., 1987; Romani et al., 1987; Walker, 2007) and the molecular (Marscher et al., 1993; Liszt & Lucas, 2000) components of ISM, though not as prevalent as in CNM, has invoked further interest in the topic.
The thermal pressure calculated for the observed AU-sized structures, assuming them as blobs of HI gas having a spherical geometry, is found to be much higher than the hydrostatic equilibrium pressure of the ISM or the standard thermal pressure of the CNM (Heiles, 1997). Thus it is difficult to comprehend the existence of these structures in pressure equilibrium with other components of ISM. Also, such over-dense and over-pressured structures are expected to be short-lived yet are omnipresent in observations. Several explanations were proposed to reconcile the observations. Heiles (1997) suggested that the observed AU-sized structures are actually gas distribution in nonspherical geometries like curved filaments and/or sheets that happen to be aligned along the line of sight. On the other hand, Deshpande (2000) suggested that the observations are basically statistical fluctuations resulting from compact, overdense gaseous structures in interstellar medium that exist in a wide range of spatial scales.The scintillation phenomenon combined with the velocity gradient across the absorbing H I gas was suggested by Gwinn (2001) to explain the optical depth fluctuations seen especially in multi-epoch pulsar observations.
Apart from understanding the mechanisms involved in the formation and the physical properties of the AU-sized structures, one of the most important questions to address first is whether the structures detected in the radio and optical observations are same or different. To investigate this we required to make observations of same sightlines. With the future facilities like SKA and TMT, this study should be possible. It would also be important to make such study in locations which are diverse in physical properties to ascertain the effects of environment on the formation of AU-sized structures. The high resolution optical spectrometer, HROS, will be one of the first decade instruments available with TMT. When built, HROS will be capable of providing spectral resolution of R=50,000 for a 1′′ slit or R1,00,000 with an image slicer in the wavelength range of 0.31-1 micron (Froning et al., 2006; Osterman et al., 2006). The highly efficient HROS design combined with the 10-fold increase in TMT collecting area relative to Keck will enable to observed more distant stars of a region to probe small scale structures of the foreground medium in a more systematic manner.
Jets and outflows from protostars
During the early stages of their formation, young stars drive powerful jets/outflows. They play a significant role in the evolution of a protostar as they transfer angular momentum from the young protostellar system to its environment, in the absence of which accretion cannot occur and a star cannot form. Jets are believed to drive the large scale outflows. The mechanism for the launch of jets, however, is far from certain although significant advances have been made through various numerical simulation (Zanni et al., 2007; Fendt, 2006; Ouyed & Pudritz, 1997). Most successful models of jet engines invoke magnetic fields for the launch and driving of jets. It is still not clear if the engine for jet launch is the interface between the star’s magnetosphere and disk (X-wind model, Shu et al., 2000) or a wide range of disk radii (disk or D-wind model, Konigl & Pudritz, 2000). In the X-wind model, jets are launched magneto-centrifugally from the inner most parts of the disks ( AU) which interact strongly with stellar magnetic fields. Disk-wind model, on the other hand, explains jets as magnetocentrifugally driven from larger disk radii, typically AU.
Protostellar jets are observed at multiple frequencies. Observations at different frequencies trace different locations and physical processes associated with jets/outflows. For example, CO observations at submillimeter/millimeter wavelengths trace the molecular gas entrained and swept-up by jets which provide a fossil record of the mass loss history of the protostar (Bontemps et al., 1996; Bachiller & Tafalla, 1999; Richer et al., 2000). Optical and near-IR forbidden lines such as [S II], [O III] and [Fe II] (e.g Bally et al., 2007; Tsinganos et al., 2009) probe fast (a few tens to few hundreds of km s-1), highly collimated and partially ionised jets. Because of the large line-of-sight extinction towards protostars, these optical and IR lines are generally used to trace outer parts of the jets, farther out from the central engine, and in relatively evolved protostars with tenuous envelopes. Mid- and far-IR fine structure lines such [O I], [Fe II], [Si II], observed with Spitzer and Herschel, suffer relatively less extinction, and they trace hot gas that is currently being shocked in jets (Watson et al., 2015). The spatial resolution of Spitzer and Herschel, however, is relatively poor (10′′ for [OI] at 63 m corresponding to 1000 AU at distances to nearby star forming regions) and cannot probe the innermost parts of the jet close to where it is launched. Despite the existence of a wealth of observational studies, the nature of the primary jets from protostars is far from clear. Several questions remain: Where and how are protostellar jets launched and accelerated? How are they collimated to such high degree? How does the jet propagation and interaction affect the surrounding medium? How do the jet properties evolve with system age? How long does jet production persist?
‘Thermal’ radio jets from protostars
Observations at cm wavelengths have revealed the presence of compact continuum emission centered on protostars which is often found to be elongated roughly in the direction of the large-scale jet/outflow, indicating that the cm emission traces the base of the jet very close to the driving source (e.g. Anglada, 1996; Reipurth et al., 2002, 2004). The cm flux density generally has a positive spectral index (; for winds or radio jets) and the emission is thought to be dominated by thermal free-free radiation from ionised gas (Reynolds, 1986; Curiel et al., 1989). Thus, cm emission from low-mass protostars traces collimated and ionised jets extending to a few hundred AUs from the exciting source and corresponding to material ejected from the protostars with dynamical ages of the order of a few years or less.
Unlike the near-infrared and optical, there have been relatively fewer studies of protostellar jets in the radio regime as the emission is relatively weak, of the order of few mJy. Most of the detection of the radio jets have been for low-mass protostars that are relatively nearby (Girart et al., 2002). In the case of massive protostars, only a handful of radio jets have been detected due to the observational difficulties encountered in studying the early phases of massive stars. Sensitive polarisation measurements at cm wavelengths using VLA of a jet GGD27-28 (Carrasco-González et al., 2010a) has shown that the magnetic field lines are parallel to the jet axis upto AU and increase in intensity towards the centre. The investigation of radio jets is of significance from massive protostars as it can help us constrain the models of massive star formation as the location and timing of launch of jet can throw light on the massive star formation scenario vis-a-vis low mass star formation.
SKA will address some very fundamental questions linked to the origin and collimation of jets by probing radio emission from the jet very close to launch point from the central exciting object. At 1 GHz, SKA should be able to observe regions as close as 25-30 AU from the central protostar at 100 pc. Although radio emission detected from jets is very weak (mJy level), a sensitive interferometer like SKA will detect radio emission from nearly all jets and outflows in the solar neighbourhood, including that from low mass protostars.
Tracing mass accretion history from jets/outflows
Mass accretion in young stellar objects is thought to be highly time variable and episodic (e.g. Kenyon et al., 1990; Hartmann & Kenyon, 1996; Evans et al., 2009; Dunham & Vorobyov, 2012). However, a detailed picture of the time evolution of mass accretion from early protostellar phase to late pre-main sequence phase is still missing. This is primarily because, most of the commonly used direct observational tracers of mass accretion such as UV and optical continuum excess and emission lines of , , fall at wavelengths 2 m (e.g. Calvet & Gullbring, 1998; Muzerolle et al., 1998a, b, 2001), and are heavily extinguished toward protostars which are deeply embedded in their natal core. Jets and outflows from embedded protostars, on the other hand, are more readily accessible to observations than the direct accretion tracers, particularly at far-IR, mm and radio wavelengths, where the line of sight extinction can be very low. Observations of protostellar jets and outflows at these wavelengths provide important diagnostics for the energetics of mass ejection and mass loss rates from protostars (e.g. Bachiller & Tafalla, 1999; Richer et al., 2000; Hollenbach et al., 1989; Reynolds, 1986). Moreover, mass accretion and ejection in protostars are thought to be strongly coupled (Watson et al., 2015). Theoretical models of mass ejection mechanisms from protostars predict a linear relation between mass loss rate from protostars, , and mass accretion rate, , onto the protostar (Shu et al., 1994; Najita & Shu, 1994; Pelletier & Pudritz, 1992; Wardle & Koenigl, 1993; Matt & Pudritz, 2005, 2008). Thus, observed properties of mass ejection can be used to study the mass accretion history in protostars.
Observations of molecular outflows from protostars at (sub)mm wavelengths measures time-averaged flow energetic parameters, viz., the mechanical luminosity () and the momentum flux or outflow force (). Since the observed molecular outflows are driven by protostellar jets, the measured and of the outflows are the rates at which kinetic energy and momentum are injected into the flow by the jets. These are time-averaged rates over the dynamical timescale of the observed molecular flow, which is typically in the range of yr. Thus from (sub)mm CO observations we can obtain mass loss rates from protostars averaged over yr. Observations of protostellar jets in the [O I] line at 63 m provide mass loss rates averaged over the cooling timescale of 100 yr (e.g. Hollenbach, 1985; Watson, 1985; Gonzalez-Garcia et al., 2016, Manoj et al. in prep). On the other hand, the ionised jets observed at radio wavelengths have dynamical timescales of a few yr, thus measuring the instantaneous mass loss rates. With its high sensitivity and angular resolution, SKA will resolve ‘thermal’ jets from several hundreds of low-mass protostars in star forming regions within 500 pc from us, most of which has already been observed in (sub)mm CO lines and with Herschel (Manoj et al., 2013). Thus, equipped with protostellar mass loss rates smoothed over a few yr, 100 yr and yr, we will be able to study the detailed time evolution of mass ejection/accretion in protostars. Such a study will place strong constraints on the frequency, amplitude and duration of episodic accretion events in protostars during their early stages of evolution.
Non-thermal jets from protostars
Although the radio jets from protostars show positive spectral index, in a few cases the cm flux density in strong radio knots is found to have negative spectral slopes, indicative of non-thermal emission (e.g. Curiel et al., 1993; Wilner et al., 1999). Linearly polarised emission has been detected in some of them, confirming that the emission mechanism is non-thermal synchrotron emission (e.g. Carrasco-González et al., 2010b). This provides evidence for the presence of a population of electrons accelerated to relativistic energies. It is generally thought that the electrons are accelerated to such high velocities in strong and fast shocks (e.g. Carrasco-González et al., 2010b), but the exact mechanism is far from clear. Negative spectral indices at cm wavelengths are observed in only a few systems, and the polarisation measurements exist for even fewer. Linear polarisation measurements are difficult as polarised flux density is only a fraction (typically 10%) of the total emission and the total radio emission itself is very weak, particularly in low-mass protostars.
With the high sensitivity offered by SKA we will be able to detect the ionised jets in protostars across a wide frequency range (few GHz to MHz) and measure the spectral indices in a large number of sources to study the incidence of non-thermal emission. Follow-up linear polarisation measurements of sources which show negative spectral indices will allow us to infer the energy spectrum of the population of relativistic electrons and to study the details of particle acceleration mechanisms. In addition, such studies will also map the magnetic fields in protostellar jets, which will help address questions of collimation and acceleration of jets.
Formation of high-mass stars and their effect on the surrounding ISM
High-mass stars, with their radiative, mechanical and chemical feedback, play an important role in the dynamical and chemical evolution of the interstellar medium (ISM) and the galaxy. The outpouring of UV photons and the associated generation of HII regions, accompanied by strong stellar winds profoundly alter the surrounding ISM. Apart from this, massive stars evolve to become Type II Supernovae and hence inject energy and heavy elements to the ISM. However, the formation mechanism and the very early phases of evolution of this mass regime is still not well understood although the basic feature of the collapse of a rotating cloud core is applicable to all mass ranges. The question that arises is whether the formation mechanism of high-mass stars (greater than M⊙) is just a scaled up version of the low mass regime or the processes involved are completely different. The formation scenario is expected to be different for the high-mass range because the accretion timescales become larger than the protostar contraction timescales implying that the star ‘switches on’ (i.e reaches the zero age main-sequence, ZAMS) while still accreting. This invokes the ‘radiation-pressure’ problem that inhibits further accretion onto the protostar (Kahn, 1974; Wolfire & Cassinelli, 1987) thereby questioning the formation of higher mass stars which are observationally a reality.
The current theoretical and observational status of high mass star formation has been recently reviewed by Tan et al. (2014). Models such as monolithic collapse with scaled up parameters like larger mass accretion rates and outflows have been proposed (Yorke & Sonnhalter, 2002). An alternate contender is the turbulent core model where massive stars form in gravitationally bound cores supported by turbulence and magnetic field (McKee & Tan, 2003). In addition, competitive accretion models have been proposed by Bonnell et al. (2004) where small stars form via gravitational collapse and then grow by gravitational accretion of gas that was initially unbound to the star. Observationally, factors that hinder the investigation of massive stars in their infancy include rarity of sources (owing to fast evolutionary time scales), formation in clustered environment, large distances, complex, embedded and influenced environment, as well as high extinction (Zinnecker & Yorke, 2007). Hence, observational studies to probe the various phases involved in high-mass star formation and the effect they have on the surrounding ISM are of crucial importance in validating the proposed theories.
Understanding the Early Phases
In the last couple of decades, the importance of multiwavelength observations has been realised in the investigation of massive star forming regions. The initial studies were primarily based on far-infrared colours of IRAS (Palla et al., 1991; Wouterloot et al., 1993; Palagi et al., 1993). Along the lines of the well established phases of low-mass star formation (Shu et al., 1987b), recently there have been a number of attempts to carry out a similar evolutionary classification for the higher mass counterparts. These are based on signposts such as masers, near and mid-infrared emission, jets and outflows, shocked gas as well as the presence of radio emission (Molinari et al., 2008; Battersby et al., 2010; Sánchez-Monge et al., 2013; Giannetti et al., 2013). The early phases of massive star forming sites are characterised by the presence of cold clumps detected in millimetre continuum and infrared emission, presence of water or methanol maser and low levels of radio continuum emission (Molinari et al., 2008; Sánchez-Monge et al., 2013). For example, Battersby et al. (2010) have examined massive star formation by investigating a number of infrared dark clouds and have described an observational evolutionary sequence comprising of four stages: (i) quiescent clump, (ii) clump with signature of active star formation (maser, green fuzzy111A knot with enhanced emission in the Spitzer-IRAC 4.5 m band believed to be caused by shocked H2, indicative of outflows and associated with massive young stellar objects., or 24 emission), (iii) initiation of ultracompact HII region, and (iv) diffuse red clump222A dense object within an IRDC of parsec scale with extended, enhanced 8 m emission., finally leading to the formation of a young stellar stellar cluster. High resolution radio continuum mapping of objects identified in stages (ii) and (iii) holds the potential of unravelling the onset of Lyman continuum photon emission, providing impetus for a rigorous study of these early phases as discussed below.
In the early phases, high-mass stars are associated with small and dense HII regions known as ultra-compact HII (UCHII) regions and the recently identified class of hyper-compact HII (HCHII) regions. These arise due to ionisation of the surrounding interstellar medium. The HCHII regions (size AU, densities cm-3) display a distinct property of broad radio recombination line (RRL) profiles ( km/s) as compared to the UCHII regions ( km/s Sewilo et al., 2004). According to one school of thought, HCHII regions are preceded by the massive young stellar object phase (MYSO, Hoare et al., 2007). These MYSOs are luminous in infrared ( L⊙) and weak in radio as they have not yet ionised the surrounding interstellar medium and the ionised emission arises due to stellar winds from the star-disk system itself (Davies et al., 2011). Alternate groups continue to designate this phase as earliest-stage protostellar HII regions (Tanaka et al., 2016). Two classes of such objects have been discovered: (i) those where the elongated ionised gas is perpendicular to the outflow and coincides with the location of a dusty disk, eg S140 IRS1 (Hoare, 2006; Maud et al., 2013), and (ii) those where the elongated ionised gas represents a radio jet and is perpendicular to the disk structure such as GGD27 (Marti et al., 1993; Carrasco-González et al., 2012). It is not clear what distinguishes these two classes of MYSOs and whether they simply represent stages of an evolutionary chronology. Considering that the massive stars have short evolutionary timescales ( yrs), these protostellar phases are not expected to last long. Hence, sensitive surveys to identify and isolate these objects to make the currently limited sample larger, will go a long way in enhancing our understanding of the earliest phases. SKA with its multi-frequency and multi-scale capabilities should help address this issue. It is expected that with the sensitivity of SKA ( Jy at 10 GHz for 10 min integration), HCHII regions formed around stars of type B1 and earlier should be sampled throughout our Galaxy. In addition, the Core Accretion model predicts that the outflow is the first structure to be ionised by the protostar with a flux density of mJy for a source at a distance of 1 kpc with a spectral index , with an apparent size that is typically AU at 10 GHz (Tanaka et al., 2016). It should be possible to substantiate this with SKA using multiple frequencies given that at a distance of 1 kpc, SKA should be able to resolve spatial scales upto AU at 10 GHz (corresponding to a resolution of for the largest baseline diameter of 150 km). This should allow us to distinguish between competing models regarding the nature of ionised gas emission, i.e whether it is arising due to thermally evaporating flow from disks (Lugo et al., 2004) or gravitationally trapped ionised accretion flow (Keto, 2002).
The broad RRL profiles of HCHII regions are interpreted as arising due to high densities, supersonic flows, and steep density gradients, consistent with accretion and outflows associated with the formation of massive stars. The decrease of line width with frequency in these regions demonstrates the importance of pressure broadening (Keto et al., 2008). Multiple frequency observations of RRLs exhibit the presence of red and blue shifted gas with respect to the central location, attributed to higher density gas being traced by the high frequency lines (Lizano, 2008). The lack of detailed kinematics across the HCHII regions is a grey area at present. In order to validate the dynamical models of ionised gas emission in HCHII regions, it is essential to obtain high angular resolution (one tenths to one-hundredth of an arcsec) mapping of the RRLs. Usually, the RRL line flux being an order or two lower in magnitude than the continuum flux, such a study very often becomes prohibitively expensive in time. With the unprecendented collecting area of SKA and large frequency coverage, it will be feasible to carry out such multi-frequency measurements at spatial scales that resolve the HCHII regions, enabling precise kinematics that appear challenging at present. For instance, the SKA1-mid bands cover nearly 200 hydrogen RRLs, from H265 to H78 and H334 to H45. Taking advantage of the antenna configurations, multiple frequency maps at the same scale (resolution) can be obtained to understand the motion of the ionised gas.
An additional feature of interest that has been observed in few HCHII and UCHII regions is the variability in flux densities, also referred to as flickering. Observational data taken across different epochs (few years) show a change in flux density as well as morphology (Franco-Hernández et al., 2004; Hoare, 2006; Galván-Madrid et al., 2008). This is attributed to either the variation in the flux density of the ionising source itself, or to a change in absorption of the enveloping medium such as the motion of clumps in the stellar wind. Klassen et al. (2012) investigated this variability phenomenon using various protostellar models and showed that HCHII regions can dwindle in size from scales of hundreds of AU (depending on the model) to near absence during the swelling of stellar radius that accompanies the protostellar transition from a convective to a radiative internal structure, on timescales as short as years. On the other hand, Peters et al. (2010) use simulations to conclude that the intermittent shielding by dense filaments in the gravitationally unstable accretion flow around the massive star result in highly variable UCHII regions that do not grow monotonically, but rather flicker. With the angular resolution achievable by SKA1-MID, changes in size and flux density are expected to be mapped more accurately on shorter timescales allowing us to ascertain the origin of the variability.
UCHII regions display a wide variety of radio morphologies such as cometary, bipolar, shell, irregular, core-halo (Churchwell, 2002). However, classification based on interferometric measurements could be biased by the limited range of spatial scales that the observations are sensitive to. Larger dynamic range and higher resolution observations of an HII region could lead to an alternate morphological shape, as is evident for G29.96-0.02 (Fey et al. 1995). Therefore, a complete continuum picture of the HII region is revealed by multi-configuration observations. An improvement to the classification scheme using multi-scale radio interferometric observations was provided by De Pree et al. (2005), who recommended the removal of the core-halo morphology apart from renaming the shell morphology to shell-like. The morphology of a HII region is significant as it can provide vital clues about density inhomogeneities in the molecular cloud, the age, as well as the dynamics of the ionized and molecular gas. The thermal pressure of ionised gas drives the dynamics in compact and large HII regions. In the earliest stages of ionization by massive star(s), such as those associated with early phase hypercompact and ultracompact HII regions, simulations have shown that other dominant factors such as outflow dynamics, rate of accretion, and gravitational instabilities shape the ionized gas distribution and evolution (Keto, 2007; Peters et al., 2010; Klessen et al., 2011). The complete mapping of HII regions is also expected to eliminate problems associated with the morphological classification of HII regions at all scales. In addition, with SKA observations we foresee a clarity regarding the hierarchical density and temperature structures that manifest as the association of the large-scale diffuse emission with the compact HII regions embedded within them (Kurtz et al., 1999; Kim & Koo, 2001; Shabala et al., 2006).
Triggered star formation in Molecular Clouds
It is known that significant fraction of the cluster population in a star forming region is confined to just a few rich clusters (Carpenter et al., 2000). As the star-forming nebula evolves, the OB stars contained within it can move far from their original birthplaces. Moreover, molecular clouds are clumpy and inhomogeneous on all scales. Therefore, displacement of the local gas and creation of non-spherical ionization fronts changes the overall structure of the GMC. Studies of individual UC HII regions show evidence for the evolutionary sequence of the associated nebulae (Anderson et al., 2009). These regions can mutually interact and influence the future course of star formation in the entire molecular cloud. The W3/ W4/ W5 star-forming complexes are prime examples of how this can happen. This region contains some of the richest and well-studied populations of deeply embedded massive stars. It presents evidence of triggered star formation, wherein new generations of stars have been triggered by previous generations of OB stars (Oey et al., 2005). The presence of thousands of young, low-mass stars in this region demonstrates that the low-mass versus high-mass star formation scenarios need not necessarily work in isolation (Megeath et al., 2008). The W4 region is the nearest example of a galactic superbubble powered by the winds of supernovae and massive OB stars (West et al., 2007). Isolated clouds seen near some GMCs could have been torn away from the parent GMC by the action of OB star winds. Therefore, a global view of a GMC, as opposed to studies of its UC H II regions alone, would be able to tell us why and how these regions emerge from the molecular cloud. Another well studied object, W51, is a giant complex composed of several H II regions spread over an area of a square degree. It broadly comprises of four components, each having futher sub-components, with different properties related to star formation (Carpenter & Sanders, 1998). Radio continuum observations of W51 have been done at different times at frequencies ranging from 151 MHz to 15 GHz at spatial resolutions of arcminutes (Subrahmanyan & Goss (1995) and references therein). In such cases, identifying the continuum sources with, say, OH (1720 MHz) sources – the signposts of supernova-molecular cloud interaction – is not unambiguous. Brogan et al. (2013) observed W51 at 74 MHz at 88” reolution and found a new non-thermal source. The wide frequency range of SKA from 50 MHz to 20 GHz offers the possibility of disentangling thermal and non-thermal components of such GMCs in a better way, and at unpreceedented resolution (7 ” at 110 MHz and 0.25 ” at 20GHz) and sensitivity ( 1Jy hr-1/2). Many W51-like interesting sources lie towards the inner Galactic plane, but are difficult to observe due to the extreme complexity of the intervening medium in their line-of-sight ; these would be accessible better using SKA.
Mid-infrared Bubbles
An interesting manifestation of the interplay between massive stars and the surrounding ISM is seen in the form of bubbles which are observed as bright-rimmed shells prominent in the mid-infrared. Using mid-infrared Galactic plane surveys such as GLIMPSE and MIPSGAL, a large number of bubbles have been identified. Catalogs of IR bubbles have been compiled by Churchwell et al. (2006, 2007) and more recently by Simpson et al. (2012, - The Milky Way Project). These bubbles are believed to be formed around massive star(s) as is evident from the high correlation seen between IR bubbles and HII regions (Churchwell et al., 2006, 2007; Deharveng et al., 2010). The observed bright-rimmed shells are swept up gas and dust between the ionization and the shock fronts encompassing relatively low density, evacuated cavity around the central massive star (Weaver et al., 1977). The mid-infrared emission is attributed to excitation of polycyclic aromatic hydrocarbon (PAH) molecules driven by the UV radiation from the central massive star(s). The formation of these bubbles is due to various feedback mechanisms like thermal overpressure, powerful stellar winds, radiation pressure, or a combination of all of them Churchwell et al. (2006); Deharveng et al. (2010); Simpson et al. (2012).
Fragmented dust shells or clumps have been observed at the borders of several IR bubbles (Zavagno et al., 2010; Ji et al., 2012; Liu et al., 2016). Populations of young stellar objects (YSOs) are also seen towards the periphery of several bubbles (Deharveng et al., 2010). Both of the above are signposts of triggered star formation. The two commonly accepted models for this are the collect and collapse ((CC) Weaver et al., 1977; Deharveng et al., 2010, and references therein) and radiatively driven implosion ((RDI) Lefloch & Lazareff, 1994). The preferred mechanism (CC or RDI) and the link with the initial star formation are still unclear. The complicated nature of this problem can be well appreciated from studies like those by Hopkins et al. (2011), (Matzner, 2002), Dale & Bonnell (2011). Hence, bubbles provide an ideal database not only for probing high-mass star formation but also for addressing issues related to triggered star formation.
In a recent work, Ranjan Das et al. (2016) have studied in detail the southern IR bubble S10. Herschel far-infrared images showed the presence of six clumps toward the periphery of the bubble suggesting a fragmented shell. The derived masses of the clumps qualify them as potential high-mass star forming regions. Further, model based analysis revealed that these clumps harbour massive YSOs with high envelope accretion rates. Four of these clumps showed no radio peaks at low Giant Metrewave Radio Telescope (GMRT) frequencies of 610 and 1280 MHz and based on models are also seen to be close to the end of the accelerated accretion phase. Detecting the onset of ionization in the form of resolved HCHII regions is challenging given their small sizes and large opacities in the radio frequencies. With the achievable high resolution and sensitivity (Umana et al., 2014), SKA has the potential to enable the detection of the early phases of massive star formation triggered by the expanding bubble possible using the frequency coverage offered.
Understanding the nature of the ionized emission in the bubble interior is a crucial factor in validating different mechanisms proposed for its formation. Examining the spectral index map of the bubble interior would throw light on the nature and origin of the ionized emission in different zones of the bubble. In another recent work, Nandakumar et al. (2016) have discussed about non-thermal emission toward the periphery of the bubble CS-112. This non-thermal component is attributed to the presence of reletivistic electrons in shocked regions of gas along the bubble boundary. The broad instantaneous frequency coverage of SKA would enable obtaining spectral index maps at high resolution.
Of recent interest is the presence of infrared arcs in the HII regions associated with bubbles (Ochsendorf et al., 2014; Ranjan Das et al., 2016; Mackey et al., 2016). Some studies have associated these with stellar wind while others have invoked the dust or bow wave models. High resolution radio observations achievable by SKA for locating the ionizing source alongwith mid-infrared observations is key to understanding the origin of these dust structures in the bubble interior.
Massive Star formation studies using GMRT
Apart from the studies mentioned in the earlier section, here we present few more examples of studies carried out by Indian Astronomers using GMRT. GMRT is the largest radio interferometer operating at low frequencies: 150 - 1400 MHz. This frequency range is unique in the investigation of ionized emission associated with massive stars. In many cases, the frequency turn-over occurs in this range allowing a detailed modelling of the physical conditions prevailing in HII regions. In addition, both thermal and non-thermal emission in HII regions can be examined using GMRT. In star formation studies, another prominent advantage of GMRT has been in the simultaneous mapping of compact and diffuse emission as result of the antenna distribution in a hybrid configuration.
In the last decade, a number of studies focused on massive star forming regions have been carried out using GMRT. Here, we discuss a few diverse results obtained. The radio morphology of the star forming region IRAS 19111+1048 investigated by Vig et al. (2006) shows the presence of a highly inhomogeneous ionized medium in the neighbourhood of an ultracompact HII region. Twenty compact sources including one non-thermal source were identified. The radio spectral types for majority of the compact sources match with the spectral type of the near-infrared counterparts. However, not all compact radio sources are internally excited by an embedded ZAMS star. In cases such as IRAS 17258-3637 (Vig et al., 2014) and IRAS 06055+2039 (Tej et al., 2006), apart from the brightest compact source that represents the location of exciting star(s), several high density radio clumps have been detected that are likely to be externally ionised in a clumpy medium. Studies of young cluster in HII regions (Mallick et al., 2015) and sites of triggered star formation associated with expanding HII regions (Samal et al., 2014) have also been investigated using GMRT.
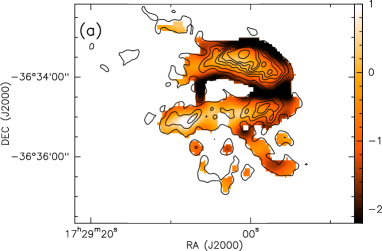
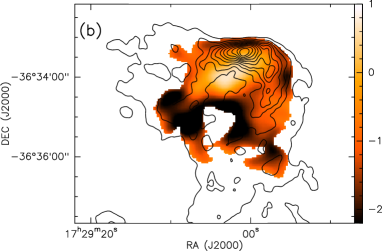
Spectral indices of diffuse emission extending upto 3 pc have been determined towards the cometary HII region IRAS 17256-3631 at low frequencies (Veena et al., 2016). As shown in Figure 1, non-thermal emission is seen prominently towards the tail region that is ionisation bounded. The lower frequency (610 - 325) spectral indices are more non-thermal in nature (i.e. steeper negative index) when compared to the higher frequencies, i.e. 1372 - 610. This is likely to be because thermal contribution dominates at higher frequencies. IRAS 17256-3631 exhibits a morphology where the spectral indices are nearly flat towards the core and relatively negative towards the diffuse envelope. It has been proposed that the diffuse non-thermal emission corresponds to synchrotron radiation from electrons that are accelerated in the region of interaction between stellar wind and ambient cloud material (Garay et al., 1996). It is expected that with SKA, such studies can be extended further to scales and levels that may answer as well as question our current understanding of the formation of massive stars and their interaction with the ISM.
References
- Anderson et al. (2009) Anderson, L. D., Bania, T. M., Jackson, J. M., Clemens, D. P., Heyer, M., Simon, R., Shah, R. Y., & Rathborne, J. M. 2009, ApJS, 181, 255
- Anglada (1996) Anglada, G. 1996, in Astronomical Society of the Pacific Conference Series, Vol. 93, Radio Emission from the Stars and the Sun, ed. A. R. Taylor & J. M. Paredes, 3–14
- Bachiller & Tafalla (1999) Bachiller, R. & Tafalla, M. 1999, in NATO Advanced Science Institutes (ASI) Series C, Vol. 540, NATO Advanced Science Institutes (ASI) Series C, ed. C. J. Lada & N. D. Kylafis, 227
- Bally et al. (2007) Bally, J., Reipurth, B., & Davis, C. J. 2007, Protostars and Planets V, 215
- Battersby et al. (2010) Battersby, C., Bally, J., Jackson, J. M., Ginsburg, A., Shirley, Y. L., Schlingman, W., & Glenn, J. 2010, ApJ, 721, 222
- Bonnell et al. (2004) Bonnell, I. A., Vine, S. G., & Bate, M. R. 2004, MNRAS, 349, 735
- Bontemps et al. (1996) Bontemps, S., André, P., Terebey, S., & Cabrit, S. 1996, A&A, 311, 858
- Brogan et al. (2013) Brogan, C. L., Goss, W. M., Hunter, T. R., Richards, A. M. S., Chandler, C. J., Lazendic, J. S., Koo, B.-C., Hoffman, I. M. & Claussen, M. J. 2013, ApJ, 771, 91
- Brogan et al. (2005) Brogan, C. L., Zauderer, B. A., Lazio, T. J., Goss, W. M., DePree, C. G., Faison, M. D. 2005, AJ, 130, 698
- Calvet & Gullbring (1998) Calvet, N. & Gullbring, E. 1998, ApJ, 509, 802
- Carpenter et al. (2000) Carpenter, J. M., Heyer, M. H., & Snell, R. L. 2000, ApJS, 130, 381
- Carpenter & Sanders (1998) Carpenter, J. M. & Sanders, D. B. 1998, AJ, 116, 1856
- Carrasco-González et al. (2010a) Carrasco-González, C., Rodríguez, L. F., Anglada, G., Martí, J., Torrelles, J. M., & Osorio, M. 2010a, Science, 330, 1209
- Carrasco-González et al. (2010b) —. 2010b, Science, 330, 1209
- Carrasco-González et al. (2012) Carrasco-González, C., Galván-Madrid, R., Anglada, G., Osorio, M., DÁlessio, P., Hofner, P., Rodríguez, L. F., Linz, H. & Araya, E. D. 2012, ApJ, 752, 29
- Cassen & Moosman (1981) Cassen, P. & Moosman, A. 1981, Icarus, 48, 353
- Churchwell (2002) Churchwell, E. 2002, ARA&A, 40, 27
- Churchwell et al. (2006) Churchwell, E., Povich, M. S., Allen, D., Taylor, M. G., Meade, M. R., Babler, B. L., Indebetouw, R., et al. 2006, ApJ, 649, 759
- Churchwell et al. (2007) Churchwell, E., Watson, D. F., Povich, M. S., Taylor, M. G., Babler, B. L., Meade, M. R., Benjamin, R. A., Indebetouw, R., & Whitney, B. A. 2007, ApJ, 670, 428
- Clark (1965) Clark, B. G. 1965, ApJ, 142, 1398
- Clark et al. (1962) Clark, B. G., Radhakrishnan, V., & Wilson, R. W. 1962, ApJ, 135, 151
- Curiel et al. (1989) Curiel, S., Rodriguez, L. F., Bohigas, J., Roth, M., Canto, J., & Torrelles, J. M. 1989, Astrophysical Letters and Communications, 27, 299
- Curiel et al. (1993) Curiel, S., Rodriguez, L. F., Moran, J. M., & Canto, J. 1993, ApJ, 415, 191
- Dale & Bonnell (2011) Dale, J. E. & Bonnell, I. 2011, MNRAS, 414, 321
- Davis et al. (1996) Davis, R. J., Diamond, P. J., & Goss, W. M. 1996, MNRAS, 283, 1105
- Davies et al. (2011) Davies, B., Hoare, M. G., Lumsden, S. L., Hosokawa, T., Oudmaijer, R. D., Urquhart, J. S., Mottram, J. C & Stead, J. 2011, MNRAS, 416, 972
- Deharveng et al. (2010) Deharveng, L., Schuller, F., Anderson, L. D., Zavagno, A., Wyrowski, F., Menten, K. M., Bronfman, L., et al. 2010, A&A, 523, A6
- Deshpande (2000) Deshpande, A. A. 2000, MNRAS, 317, 199
- Deshpande et al. (1992) Deshpande, A. A., McCulloch, P. M., Radhakrishnan, V., & Anantharamaiah, K. R. 1992, MNRAS, 258, 19P
- Diamond et al. (1989) Diamond, P. J., Goss, W. M., Romney, J. D., Booth, R. S., Kalberla, P. M. W., & Mebold, U. 1989, ApJ, 347, 302
- Dickey & Lockman (1990) Dickey, J. M. & Lockman, F. J. 1990, ARA&A, 28, 215
- Dieter et al. (1976) Dieter, N. H., Welch, W. J., & Romney, J. D. 1976, ApJ, 206, L113
- Dunham & Vorobyov (2012) Dunham, M. M. & Vorobyov, E. I. 2012, ApJ, 747, 52
- Elmegreen & Lada (1977) Elmegreen, B. G. & Lada, C. J. 1977, ApJ, 214, 725
- Evans et al. (2009) Evans, N. J., Dunham, M. M., Jørgensen, J. K., Enoch, M. L., Merín, B., van Dishoeck, E. F., Alcalá, J. M., et al. 2009, ApJS, 181, 321
- Faison & Goss (2001) Faison, M. D. & Goss, W. M. 2001, AJ, 121, 2706
- Fendt (2006) Fendt, C. 2006, ApJ, 651, 272
- Fiedler et al. (1987) Fiedler, R. L., Dennison, B., Johnston, K. J., & Hewish, A. 1987, Nature, 326, 675
- Franco-Hernández et al. (2004) Franco-Hernández, R. & Rodriguez, L. F. 2004, ApJ, 604, 105
- Frail et al. (1994) Frail, D. A., Weisberg, J. M., Cordes, J. M., & Mathers, C. 1994, ApJ, 436, 144
- Froning et al. (2006) Froning, C., Osterman, S., Beasley, M., Green, J., Beland, S. 2006, in Ground-based and Airborne Instrumentation for Astronomy, ed. McLean, Ian S. & Iye, Masanori, Proceedings of the SPIE, 6269, 62691V
- Garay et al. (1996) Garay, G., Ramirez, S., Rodriguez, L. F., Curiel, S., & Torrelles, J. M. 1996, ApJ, 459, 193
- Galván-Madrid et al. (2008) Galván-Madrid, R., Rodriguez, L. F., Ho, P. T. P. & Keto, E., 2008, ApJ, 674, 33
- Giannetti et al. (2013) Giannetti, A., Brand, J., Sánchez-Monge, Á., Fontani, F., Cesaroni, R., Beltrán, M. T., Molinari, S., Dodson, R., & Rioja, M. J. 2013, A&A, 556, A16
- Girart et al. (2002) Girart, J. M., Curiel, S., Rodríguez, L. F., & Cantó, J. 2002, Rev. Mexicana Astron. Astrofis., 38, 169
- Gonzalez-Garcia et al. (2016) Gonzalez-Garcia, B., Manoj, P., Watson, D. M., Vavrek, R., Megeath, S. T., Stutz, A. M., Osorio, M., et al. 2016, A&A, Submitted to A & A
- Goss et al. (2008) Goss, W. M. and Richards, A. M. S. and Muxlow, T. W. B. and Thomasson, P. 2008, MNRAS, 388, 165
- Gwinn (2001) Gwinn, C. R. 2001, ApJ, 561, 815
- Hartmann (2009) Hartmann, L. 2009, Accretion Processes in Star Formation: Second Edition (Cambridge University Press)
- Hartmann & Kenyon (1996) Hartmann, L. & Kenyon, S. J. 1996, ARA&A, 34, 207
- Heiles (1997) Heiles, C. 1997, ApJ, 481, 193
- Heiles & Troland (2003) Heiles, C. & Troland, T. H. 2003, ApJ, 586, 1067
- Hoare (2006) Hoare, M. G. 2006, ApJ, 649, 856
- Hoare et al. (2007) Hoare, M. G., Kurtz, S. E., Lizano, S., Keto, E. & Hofner, P. 2007, Protostars and Planets V, ed. B. Reipurth, D. Jewitt & K. Keil, 181–196
- Hollenbach (1985) Hollenbach, D. 1985, Icarus, 61, 36
- Hollenbach et al. (1989) Hollenbach, D. J., Chernoff, D. F., & McKee, C. F. 1989, in ESA Special Publication, Vol. 290, Infrared Spectroscopy in Astronomy, ed. E. Böhm-Vitense, 245–258
- Hopkins et al. (2011) Hopkins, P. F., Quataert, E., & Murray, N. 2011, MNRAS, 417, 950
- Israel (1978) Israel, F. P. 1978, A&A, 70, 769
- Jenkins & Tripp (2001) Jenkins, E. B. & Tripp, T. M. 2001, ApJS, 137, 297
- Ji et al. (2012) Ji, W.-G., Zhou, J.-J., Esimbek, J., Wu, Y.-F., Wu, G. & Tang, X.-D., 2012, å, 544, A39
- Johnston et al. (2003) Johnston, S., Koribalski, B., Wilson, W., & Walker, M. 2003, MNRAS, 341, 941
- Kahn (1974) Kahn, F. D. 1974, A&A, 37, 149
- Kenyon et al. (1990) Kenyon, S. J., Hartmann, L. W., Strom, K. M., & Strom, S. E. 1990, AJ, 99, 869
- Keto (2002) Keto, E. 2002, ApJ, 580, 980
- Keto (2007) Keto, E. 2007, ApJ, 666, 976
- Keto et al. (2008) Keto, E., Zhang, Q. & Kurtz, S. 2008, ApJ, 672, 423
- Kim & Koo (2001) Kim, K.-T. & Koo, B.-C. 2001, ApJ, 549, 979
- Klassen et al. (2012) Klassen, M., Peters, T. & Pudritz, R. E. 2012, ApJ, 758, 137
- Klessen et al. (2011) Klessen, R. S., Peters, T., Banerjee, R., Mac Low, M., Galván-Madrid, R. & Keto, E. R., 2011, Computational Star Formation, Proceedings of the International Astronomical Union, IAU Symposium, 270, 107
- Konigl & Pudritz (2000) Konigl, A. & Pudritz, R. E. 2000, Protostars and Planets IV, 759
- Kurtz et al. (1999) Kurtz, S. E., Watson, A. M., Hofner, P. & Otte, B. 1999, ApJ, 514, 232
- Lefloch & Lazareff (1994) Lefloch, B. & Lazareff, B. 1994, A&A, 289, 559
- Liszt & Lucas (2000) Liszt, H. & Lucas, R. 2000, A&A, 355, 333
- Lizano (2008) Lizano, S. 2008, Massive Star Formation: Observations Confront Theory ASP Conference Series, Vol. 387, eds. H. Beuther, H. Linz & T. Henning, 232
- Liu et al. (2016) Liu, H.-L., Li, J.-Z., Wu, Y., Yuan, J.-H., Liu, T., Dubner, G., Paron, S., Ortega, M. E., Molinari, S., Huang, M. et al. 2016, ApJ, 818, 95
- Lugo et al. (2004) Lugo, J., Lizano, S., & Garay, G. 2004, ApJ, 614, 807
- Mackey et al. (2016) Mackey, J., Haworth, T. J., Gvaramadze, V. V., Mohamed, S., Langer, N. & Harries, T. J., 2016, å, 586, A114
- Mallick et al. (2015) Mallick, K. K., Ojha, D. K., Tamura, M., Linz, H., Samal, M. R., & Ghosh, S. K. 2015, MNRAS, 447, 2307
- Manoj et al. (2013) Manoj, P., Watson, D. M., Neufeld, D. A., Megeath, S. T., Vavrek, R., Yu, V., Visser, R., et al. 2013, ApJ, 763, 83
- Marscher et al. (1993) Marscher, A. P., Moore, E. M., & Bania, T. M. 1993, ApJ, 419, L101
- Marti et al. (1993) Marti, J., Rodriguez, L. F. & Reipurth, B. 1993, ApJ, 416, 208
- Matt & Pudritz (2005) Matt, S. & Pudritz, R. E. 2005, ApJ, 632, L135
- Matt & Pudritz (2008) —. 2008, ApJ, 681, 391
- Matzner (2002) Matzner, C. D. 2002, ApJ, 566, 302
- Maud et al. (2013) Maud, L. T., Hoare, M. G., Gibb, A. G., Shepherd, D. & Indebetouw, R. 2013, MNRAS, 428, 609
- McKee & Ostriker (2007) McKee, C. F. & Ostriker, E. C. 2007, ARA&A, 45, 565
- McKee & Tan (2003) McKee, C. F. & Tan, J. C. 2003, ApJ, 585, 850
- Megeath et al. (2008) Megeath, S. T., Townsley, L. K., Oey, M. S., & Tieftrunk, A. R. 2008, Low and High Mass Star Formation in the W3, W4, and W5 Regions, ed. B. Reipurth (The Northern Sky ASP Monograph Publications, Vol. 4), 264
- Meyer & Blades (1996) Meyer, D. M. & Blades, J. C. 1996, ApJ, 464, L179
- Meyer & Lauroesch (1999) Meyer, D. M. & Lauroesch, J. T. 1999, ApJ, 520, L103
- Molinari et al. (2008) Molinari, S., Faustini, F., Testi, L., Pezzuto, S., Cesaroni, R., & Brand, J. 2008, A&A, 487, 1119
- Muzerolle et al. (1998a) Muzerolle, J., Calvet, N., & Hartmann, L. 1998a, ApJ, 492, 743
- Muzerolle et al. (2001) —. 2001, ApJ, 550, 944
- Muzerolle et al. (1998b) Muzerolle, J., Hartmann, L., & Calvet, N. 1998b, AJ, 116, 2965
- Najita & Shu (1994) Najita, J. R. & Shu, F. H. 1994, ApJ, 429, 808
- Nandakumar et al. (2016) Nandakumar, G., Veena, V. S., Vig, S., Tej, A., Ghosh, S. K. & Ojha, D., 2016, 2016arXiv160701267N, AJ(in press)
- Ochsendorf et al. (2014) Ochsendorf, B. B., Verdolini, S., Cox, N. L. J., Berne, O., Kaper, L. & Tielens, A. G. G. M., 2014, å, 566, A75
- Oey et al. (2005) Oey, M. S., Watson, A. M., Kern, K., & Walth, G. L. 2005, AJ, 129, 393
- Osterman et al. (2006) Osterman, S., Froning, C., Beasley, M., Green, J., Beland, S. 2006, in Ground-based and Airborne Instrumentation for Astronomy, ed. McLean, Ian S. & Iye, Masanori, Proceedings of the SPIE, 6269, 626930
- Ouyed & Pudritz (1997) Ouyed, R. & Pudritz, R. E. 1997, ApJ, 482, 712
- Palagi et al. (1993) Palagi, F., Cesaroni, R., Comoretto, G., Felli, M., & Natale, V. 1993, A&AS, 101, 153
- Palla et al. (1991) Palla, F., Brand, J., Comoretto, G., Felli, M., & Cesaroni, R. 1991, A&A, 246, 249
- Pelletier & Pudritz (1992) Pelletier, G. & Pudritz, R. E. 1992, ApJ, 394, 117
- Peters et al. (2010) Peters, T., Klessen, R. S., Mac Low, M. & Banerjee, R. 2010, ApJ, 725, 134
- Ranjan Das et al. (2016) Ranjan Das, S., Tej, A., Vig, S., Ghosh, S. K. & Ishwara Chandra C., H., 2016, 2016arXiv160509495R, AJ(in press)
- Reid & Ho (1985) Reid, M. J. & Ho, P. T. P. 1985, ApJ, 288, L17
- Reipurth et al. (2002) Reipurth, B., Rodríguez, L. F., Anglada, G., & Bally, J. 2002, AJ, 124, 1045
- Reipurth et al. (2004) —. 2004, AJ, 127, 1736
- Reynolds (1986) Reynolds, S. P. 1986, ApJ, 304, 713
- Richer et al. (2000) Richer, J. S., Shepherd, D. S., Cabrit, S., Bachiller, R., & Churchwell, E. 2000, Protostars and Planets IV, 867
- Romani et al. (1987) Romani, R. W., Blandford, R. D., & Cordes, J. M. 1987, Nature, 328, 324
- Roy et al. (2012) Roy, N., Minter, A. H., Goss, W. M., Brogan, C. L., Lazio, T. J. W. 2012, ApJ, 749, 144
- Samal et al. (2014) Samal, M. R., Zavagno, A., Deharveng, L., Molinari, S., Ojha, D. K., Paradis, D., Tigé, J., Pandey, A. K., & Russeil, D. 2014, A&A, 566, A122
- Sánchez-Monge et al. (2013) Sánchez-Monge, Á., Beltrán, M. T., Cesaroni, R., Fontani, F., Brand, J., Molinari, S., Testi, L., & Burton, M. 2013, A&A, 550, A21
- Sewilo et al. (2004) Sewilo, M., Churchwell, E., Kurtz, S., Goss, W. M., & Hofner, P. 2004, ApJ, 605, 285
- Shabala et al. (2006) Shabala, S. S., Ellingsen, S. P., Kurtz, S. E & Forbes, L. K. 2006, MNRAS, 372, 457
- Shu et al. (1994) Shu, F., Najita, J., Ostriker, E., Wilkin, F., Ruden, S., & Lizano, S. 1994, ApJ, 429, 781
- Shu et al. (1987a) Shu, F. H., Adams, F. C., & Lizano, S. 1987a, ARA&A, 25, 23
- Shu et al. (1987b) —. 1987b, ARA&A, 25, 23
- Shu et al. (2000) Shu, F. H., Najita, J. R., Shang, H., & Li, Z.-Y. 2000, Protostars and Planets IV, 789
- Simpson et al. (2012) Simpson, R. J., Povich, M. S., Kendrew, S., Lintott, C. J., Bressert, E., Arvidsson, K., Cyganowski, C., et al. 2012, MNRAS, 424, 2442
- Smith et al. (2013) Smith, K. T., Fossey, S. J., Cordiner, M. A., Sarre, P. J., Smith, A. M., Bell, T. A., Viti, S. 2012, MNRAS, 429, 939
- Stahler & Palla (2004) Stahler, S. W. & Palla, F. 2004, The Formation of Stars (WILEY-VCH Verlag GmbH & Co. KGaA, Weinheim)
- Subrahmanyan & Goss (1995) Subrahmanyan, R & Goss, W. M., 1995, MNRAS, 275, 755
- Tan et al. (2014) Tan, J. C., Beltrán, M. T., Caselli, P., Fontani, F., Fuente, A., Krumholz, M. R., McKee, C. F., & Stolte, A. 2014, Protostars and Planets VI, 149
- Tanaka et al. (2016) Tanaka, K. E. I., Tan, J. C. & Zhang, Y. 2016, ApJ, 818, 52
- Tej et al. (2006) Tej, A., Ojha, D. K., Ghosh, S. K., Kulkarni, V. K., Verma, R. P., Vig, S., & Prabhu, T. P. 2006, A&A, 452, 203
- Tenorio-Tagle (1979) Tenorio-Tagle, G. 1979, A&A, 71, 59
- Terebey et al. (1984) Terebey, S., Shu, F. H., & Cassen, P. 1984, ApJ, 286, 529
- Tsinganos et al. (2009) Tsinganos, K., Ray, T., & Stute, M., eds. 2009, Jets from Embedded Protostars (Springer Heidelberg Dordrecht London New York), 215–224
- Umana et al. (2014) Umana, G., Trigilio, C., Cerrigone, L., Cesaroni, R., Zijlstra, A. A., Hoare, M., Weis, K., Beasley, A., Bomans, D., Hallinan, G. et al. 2015, Proceedings of Advancing Astrophysics with the Square Kilometre Array (AASKA14)
- Ulrich (1976) Ulrich, R. K. 1976, ApJ, 210, 377
- van Buren et al. (1990) van Buren, D., Mac Low, M.-M., Wood, D. O. S., & Churchwell, E. 1990, ApJ, 353, 570
- Veena et al. (2016) Veena, V. S., Vig, S., Tej, A., Varricatt, W. P., Ghosh, S. K., Chandrasekhar, T., & Ashok, N. M. 2016, MNRAS, 456, 2425
- Vig et al. (2006) Vig, S., Ghosh, S. K., Kulkarni, V. K., Ojha, D. K., & Verma, R. P. 2006, ApJ, 637, 400
- Vig et al. (2014) Vig, S., Ghosh, S. K., Ojha, D. K., Verma, R. P., & Tamura, M. 2014, MNRAS, 440, 3078
- Walker (2007) Walker, M. A. 2007, in Small Ionized and Neutral Structures in the Diffuse Interstellar Medium, eds. M. Haverkorn, & W. M. Goss, ASP Conf. Ser., 365, 299
- Wardle & Koenigl (1993) Wardle, M. & Koenigl, A. 1993, ApJ, 410, 218
- Watson (1985) Watson, D. M. 1985, Physica Scripta Volume T, 11, 33
- Watson et al. (2015) Watson, D. M., Calvet, N. P., Fischer, W. J., Forrest, W. J., Manoj, P., Megeath, S. T., Melnick, G. J., et al. 2015, ArXiv e-prints
- Watson & Meyer (1996) Watson, J. K. & Meyer, D. M. 1996, ApJ, 473, L127
- Weaver et al. (1977) Weaver, R., McCray, R., Castor, J., Shapiro, P. & Moore, R. 1977, ApJ, 218, 377
- Welsh et al. (2009) Welsh, B. Y. and Wheatley, J. and Lallement, R. 2009, PASP, 121, 606
- Welty et al. (2008) Welty, D. E., Simon, T., Hobbs, L. M. 2008, MNRAS, 388, 323
- West et al. (2007) West, J. L., English, J., Normandeau, M., & Landecker, T. L. 2007, ApJ, 656, 914
- Wilner et al. (1999) Wilner, D. J., Reid, M. J., & Menten, K. M. 1999, ApJ, 513, 775
- Wolfire & Cassinelli (1987) Wolfire, M. G. & Cassinelli, J. P. 1987, ApJ, 319, 850
- Wood & Churchwell (1989) Wood, D. O. S. & Churchwell, E. 1989, ApJ, 340, 265
- Wouterloot et al. (1993) Wouterloot, J. G. A., Brand, J., & Fiegle, K. 1993, A&AS, 98, 589
- Yorke & Sonnhalter (2002) Yorke, H. W. & Sonnhalter, C. 2002, ApJ, 569, 846
- Zanni et al. (2007) Zanni, C., Ferrari, A., Rosner, R., Bodo, G., & Massaglia, S. 2007, A&A, 469, 811
- Zavagno et al. (2010) Zavagno, A., Anderson, L. D., Russeil, D., Morgan, L., Stringfellow, G. S., Deharveng, L., Rodón, J. A., Robitaille, T. P., Mottram, J. C., Schuller, F., et al., 2010, å, 518, 101
- Zinnecker & Yorke (2007) Zinnecker, H. & Yorke, H. W. 2007, ARA&A, 45, 481