The outburst of the X-ray nova GRS 1739-278 in September, 2016
1Space Research Institute, Russian Academy of Sciences, Profsoyuznaya 84/32, 117997 Moscow, Russia
2Max Planck Institute for Astrophysics, Karl-Schwarzschild-Strasse 1, D-85741 Garching, Germany
During the scanning observations of the Galactic Center region in August – September 2016 we detected the new outburst of the historical X-ray nova GRS 1739-278 , the black hole candidate LMXB system. In this letter we present results of INTEGRAL and Swift-XRT observations taken during the outburst. In hard X-ray band (20–60 keV) the flux from the source raised from 11 to 30 mCrab between 3 and 14 of September. For nearly 8 days the source has been observed at this flux level and then faded to 15 mCrab. The broadband quasi-simultaneous spectrum obtained during the outburst is well described by the absorbed powerlaw with the photon index in broad energy range 0.5–150 keV, with absorption corresponding to cm-2 assuming solar abundance. Based on this we can conclude that the source was in the low/hard state. From the lightcurve and spectra we propose that this outburst was ‘failed’, i.e. amount of accreted matter was not sufficient to achieve the high/soft spectral state with dominant soft blackbody component as seen in normal outbursts of black hole candidates.
Keywords: X-ray transients, GRS 1739-278
Accepted for publication in Astronomy Letters, 2017, n.3.
∗Corresponding author i.a.mereminskiy@gmail.com
1 Introduction
The X-ray nova GRS 1739-278 was discovered by SIGMA telescope onboard GRANAT space observatory during its bright outburst in 1996 (Paul et al., 1996). Later GRANAT continued observations of this source (Vargas et al., 1997) along with other X-ray telescopes: ROSAT (Greiner et al., 1996), RXTE and TTM/Kvant (Borozdin et al., 1998). The optical counterpart was found in observations carried out by ESO telescopes (Marti et al., 1997). The peak flux was about mCrab in 2–10 keV (ASM/RXTE) (Borozdin et al., 1998). During the outburst GRS 1739-278 demonstrated typical behavior of the black hole candidate (BHC, see e.g. Grebenev et al., 1993, 1997; Tanaka and Shibazaki, 1996; Remillard and McClintock, 2006; Belloni, 2010). The lightcurve could be described with a FRED-like (fast rise, exponential decay) shape, at the beginning of the outburst the source was in a typical low/hard state, with spectrum dominated by a power-law component with exponential cutoff at high (100 keV) energies followed by a high/soft state with a strong blackbody component (Borozdin et al., 1998). Observations at VLA (Durouchoux et al., 1996) revealed presence of variable radio emission, which could be caused by jets. Borozdin and Trudolyubov (2000) found QPO at 5 Hz in RXTE observations conducted while the source was in the very high/soft state.
Since the discovery of the source in 1996, the Galactic Center region has been regularly monitored by RXTE/ASM and INTEGRAL (since 2003) missions. According to Krivonos et al. (2012a) GRS 1739-278 remained in quiescence until 2013, the upper limit on 20–60 keV flux was 0.12 mCrab (3, 1 mCrab corresponds to 12.310-12 erg cm-2 s-1).
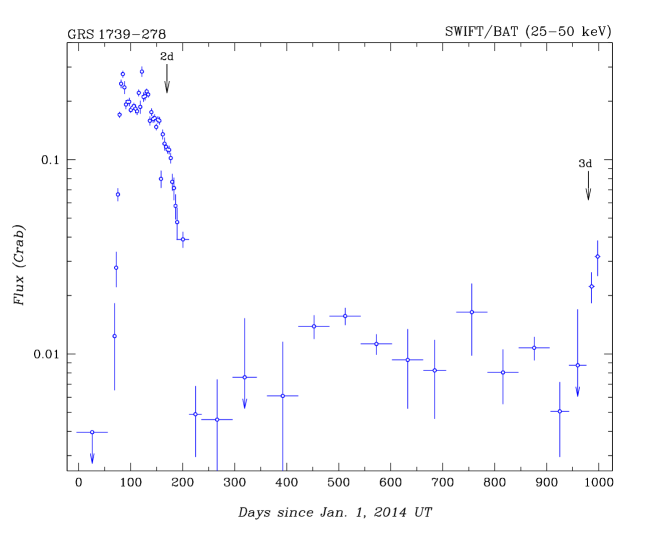
The second outburst of GRS 1739-278 was detected by Filippova et al. (2014) in 2014. It’s 2–20 keV flux was measured at the level of 200 mCrab111http://maxi.riken.jp/top/index.php?cid=1&jname=J1742-277 with MAXI experiment (Matsuoka et al., 2009). Fig. 1 shows the source lightcurve during the second outburst as measured by Swift-BAT telescope (Gehrels et al., 2004) in 25-50 keV. One can notice that although the second outburst apparently ended after 150 days after the beginning, the source flux has not lowered down to zero and remained on 5–15 mCrab level. As shown in Fig. 1 in the beginning of September the flux from GRS 1739-278 started to increase. This allowed us to report an onset of the new outburst using INTEGRAL observations (Mereminskiy et al., 2016). In this work we used all publicly available INTEGRAL data, including monitoring observations of the Galactic Bulge (Kuulkers et al., 2007) and private data from scanning observations of the Galactic Center (as described in Krivonos et al., 2012b). We also used two Swift-XRT observations performed on September 21 and 24 as well as follow-up observations by Russian-Turkish 1.5-m telescope (RTT-150) on September, 26.
2 Observations
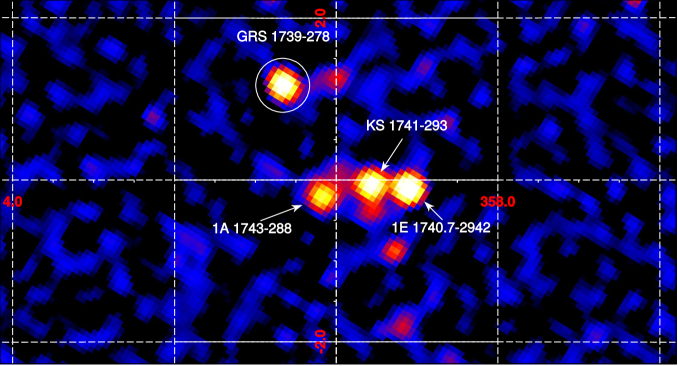
Main results were obtained with IBIS/ISGRI telescope (Ubertini et al., 2003) onboard INTEGRAL observatory (Winkler et al., 2003). IBIS/ISGRI is a wide-field ( FWZR) coded mask telescope working in the hard X-ray range 20–300 keV. The angular resolution of about 13’ FWHM allows a confident detection of GRS 1739-278 despite its location in the Galactic Bulge, a region crowded by a large number of bright point X-ray sources (Krivonos et al. (2012a), see also Fig. 2 for illustration). We also used JEM-X telescope onboard INTEGRAL, which is sensitive in the standard X-ray range 3–35 keV (Lund et al., 2003) and has field of view of 13.2 in diameter. The field around the source was observed by INTEGRAL from 29 August until 27 September 2016 which corresponds to 1719-1729 INTEGRAL orbits, with exception for 1723 and 1724 revolutions, when INTEGRAL observed Crab nebulae for calibration purposes.
For IBIS/ISGRI data we performed energy calibration (processing of event lists up to the COR level) with use of OSA 10.1 (Courvoisier et al., 2003). Then we used the proprietary analysis package developed at IKI (Revnivtsev et al., 2004; Krivonos et al., 2010; Churazov et al., 2014) to reconstruct sky images and extract source fluxes. JEM-X data were reduced with the standard software OSA 10.1 to obtain sky images (IMA level) and then processed according to Grebenev and Mereminskiy (2015).
Swift-XRT observational campain was initiated immediately (Neilsen et al., 2016) after discovery of the new outburst. The first observation (ObsID. 00033812055, hereafter we use only two last digits of the ObsID.) was performed on 21 September (57652 MJD), XRT observed GRS 1739-278 in Photon Counting mode for 1 ks. The second observation (ID. 56) took place on 24 September (57656 MJD). We processed all data using the standard pipeline XRTPIPELINE v.0.12.6 (Burrows et al., 2005). The exposure map was build by XRTEXPOMAP and was used to produce ARF files. XRT observed GRS 1739-278 at nearly 1.5 cts s-1 (0.5–10 keV) rate. For the spectral analysis we had rebinned data in order to have at least 100 photons per bin. Unfortunately, the source count rate was too low to study its variability at timescales of minutes or seconds.
On 26 September (16:50 UTC) we performed a search for an optical/IR emission with RTT-150 telescope with the focal reducer and TFOSC spectrograph. Observational conditions were poor because of the large zenith angle, the image quality was about 2.5′′. We got direct images in and band , the exposure time was 300 s.
3 Results
Fig. 2 shows the significance map of the field around GRS 1739-278 obtained with IBIS/ISGRI in 20–60 keV range on September 2016 (spacecraft revolutions 1725-1727). The source is detected at 34 significance level, the exposure on the source is 62 ksec. Several other bright X-ray sources in the Galactic Bulge are also marked.
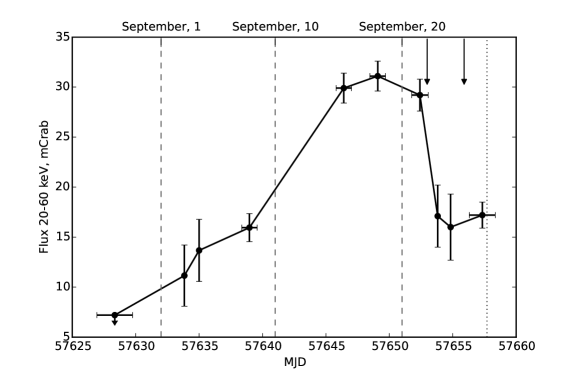
In Fig. 3 we present the lightcurve of the source in 20–60 keV band taken with IBIS/ISGRI for all available data. The first significant detection of the source occured on 3 September, the flux was mCrab. Several features are clearly seen on the figure: the slow and steady increase of the flux for about 10 days, the “plateau” at mCrab level that lasted for a week, and, then, the decline to 15 mCrab. The source remained at this stage until the end of our observations. This behaviour is completely different from that in the previous outburst of the source, during which intensity in 15–50 keV band increased tenfold in the course of 8 days and reached 300 mCrab at maximum as Swift-BAT data show (Krimm et al., 2014) (see also Fig. 1).
We reconstructed and studied spectra obtained by IBIS/ISGRI in 1725, 1726 and 1727 orbits, during which the source was bright. We also built the overall spectrum for 1728-1729 revolutions. To fit spectra we used wabs*powerlaw model from XSPEC package (Arnaud, 1996). All spectra are well-fitted by the powerlaw with the slope of 1.7–2.0 (Table 1), no high-energy cut-off is seen up to 150 keV.
| Revolution | Obs. start | Obs. end | Exposure, | Flux 20-100 keV, | , |
|---|---|---|---|---|---|
| MJD | MJD | ks | 10-10 egr cm-2 s-1 | photon index | |
| 1725 | 57645.8 | 57647.0 | 21 | 5.82.6 | 1.730.12 |
| 1726 | 57648.5 | 57649.7 | 23 | 5.62.6 | 1.980.12 |
| 1727 | 57651.9 | 57653.1 | 19 | 5.22.8 | 1.840.14 |
| 1728-1729 | 57653.7 | 57658.3 | 37 | 3.01.9 | 1.810.16 |
In Swift-XRT observations the source was already in fading phase, yet still confidiently detected at 1.280.04 cts s-1 (S/N 30). Spectra obtained by Swift-XRT show no obvious peculiarities and can be described with the absorbed powerlaw. The measured absorption column 2.31022 cm-2 is in agreement with previous estimates (Greiner et al., 1996; Miller et al., 2015). The best-fit models are presented in Table 2. The slope of the powerlaw is measured with large errors due to narrow width of the energy range and strong correlation with the absorption.
| ID | Obs. start | Exposure, | Unabsorbed flux (0.1-10 keV), | , | N |
|---|---|---|---|---|---|
| MJD | s | 10-10, erg cm-2 s-1 | photon index | 1022 cm-2 | |
| 55 | 57652 | 968.9 | 2.40.6 | 1.740.24 | 2.140.43 |
| 56 | 57656 | 939 | 1.60.2 | 1.50.3 | 1.520.19 |
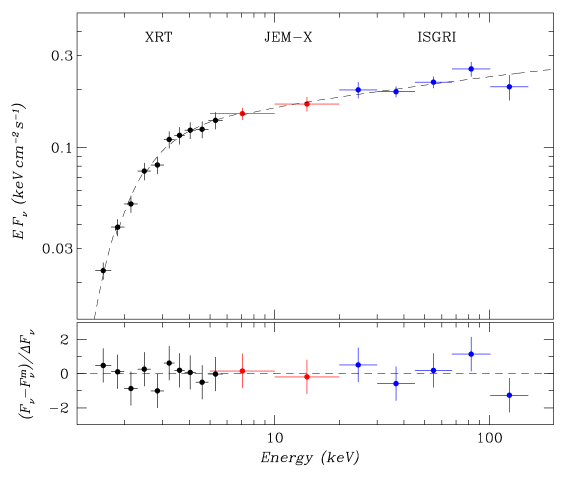
We then constructed broadband X-ray spectra of GRS 1739-278 using quasi-simultaneous observations made by INTEGRAL and Swift. To achieve better statistics for INTEGRAL JEM-X and IBIS/ISGRI data we used the spectrum averaged over 1725-1727 (“plateau”) revolutions. We performed simultaneous fitting of three spectra (XRT 0.3–10 keV, JEM-X 5–20 keV, and IBIS/ISGRI 20–150 keV) using simple const*wabs*powerlaw model. To account for non-simultaneity of observations and differences in absolute calibrations we introduced cross-calibration coefficients (const) and ), using IBIS/ISGRI data as a reference. The obtained spectrum is presented in Fig. 4. For 1728-1729 revolutions we performed the similar analysis, but without using JEM-X data.
The best-fit model parameters are presented in Table 3. The spectrum obtained in the course of “plateau’ ’ is well described by a simple model with reasonable =0.51 (12 d.o.f.). The surface density of the neutral hydrogen column which accounts for the absorption seen in spectra, was measured as cm-2 (assuming solar abundance) during the “plateau” and as cm-2 at the decline. Both values are close to previously measured cm-2 (Greiner et al., 1996; Miller et al., 2015), however they are significantly different from each other. On the other hand, although data in Table 3 show some spectral hardening (from = 1.860.07 to = 1.730.05) this is not reliable enough. There are no traces of the blackbody radiation or Fe K fluorescent line. Unlike the NuSTAR observations from previous outburst (Miller et al., 2015; Fuerst et al., 2016) there is no cut-off at 40–50 keV in the powerlaw component, which we traced up to 150 keV, thanks to IBIS/ISGRI energy coverage. We shall note, that observations performed by different telescopes were non-simultaneous and the source showed variability of at least order of 2 during the individual IBIS/ISGRI observations on the “plateau”. This can explain cross-calibration coefficients of 0.44 and 0.33 for JEM-X and XRT, respectively. This also makes it hard to estimate the true luminosity of GRS 1739-278 . Using IBIS/ISGRI data as reference frame (since it has the largest exposure) we can estimate unabsorbed luminosity in 0.1–100 keV range as L=1.51037 erg s-1, assuming distance to the source of 8.5 kpc, which corresponds to about 1% of Eddington luminosity for a 10 black hole ( erg s-1).
| INTEGRAL | XRT, | NH, | , | Flux, 10-10, cm-2 s-1 | ||||
|---|---|---|---|---|---|---|---|---|
| revolutions | ObsID | 1022 cm-2 | photon index | 0.1–10 keV | 20-100 keV | |||
| 1725-1727 | 55 | 2.330.20 | 1.860.07 | 8.62.3 | 5.31.4 | 0.440.06 | 0.320.05 | 6.1(12) |
| 1728-1729 | 56 | 1.680.19 | 1.730.05 | 1.8 0.1 | 3.00.2 | – | 0.560.18 | 12.1(10) |
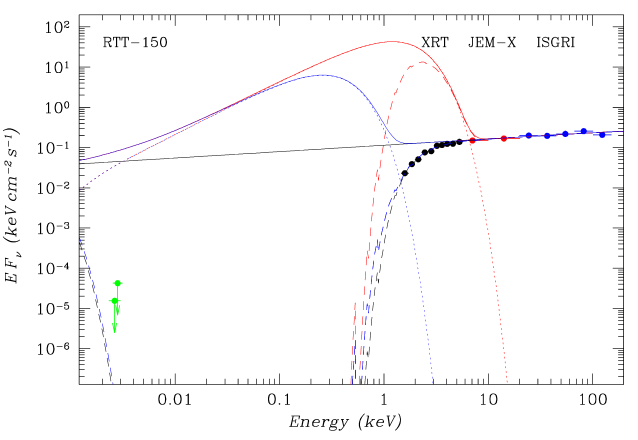
No IR source was detected at the position reported by Marti et al. (1997) in images obtained with RTT-150. We estimated 5 upper limits as and . In Fig. 5 we plotted these limits alongside with the spectrum from Fig. 4. Earlier Grebenev et al. (2013, 2014, 2016) shown that IR and optical observations of some X-ray novae are well described by the powerlaw extrapolation of their hard X-ray spectra, with respect to the absorption by the dust, corresponding to the photoabsorption by the neutral gas which can be measured from a soft X-ray spectrum. It is interesting to note that observations of X-ray novae in radio bands also suggest single powerlaw (Russell et al., 2006). From Fig. 5 it is seen, that due to severe absorption in direction to the GRS 1739-278 obtained upper limits are much higher than powerlaw extrapolation of the hard X-ray spectrum, as well as possible blackbody contribution from outer and cooler parts of the accretion disk around the black hole. In Fig. 5 spectra corresponding to the critical Eddington accretion rate onto 10 black hole are also presented: red lines show spectrum arising from an accretion disk, extended up to the last stable orbit radius (3 Rg), blue lines show the same disk but with 30 Rg inner radius. Both models give equal contribution to the IR band, although the first disk can not be present in this system, because of lack of the soft X-ray emission. We should also note that, under reasonable assumptions, the irradiation can not significantly increase the blackbody disk contribution to the IR emission (Grebenev et al., 2016).
Based on both spectra and the estimated luminosity we can assume that the source stayed in the canonical low/hard black hole state. Therefore, it turns out that this outburst is failed, at least yet, i.e. amount of accreted matter is not high enough to reach the high/soft state with the prominent blackbody component, that is usual for developed outbursts. Forthcoming NuSTAR and Chandra observations (Neilsen et al., 2016) could shed additional light on this question.
We carried out several addtitonal observations of GRS 1739-278 with IBIS/ISGRI in 1730-1732 revolutions after the paper was accepted. The source remains active with 20–60 keV flux about 15 mCrab.
Acknowledgments
This work is based on observations with INTEGRAL, an ESA project with instruments and the science data centre funded by ESA member states (especially the PI countries: Denmark, France, Germany, Italy, Switzerland, Spain), and Poland, and with the participation of Russia and the USA. INTEGRAL data used here were obtained from the Russian INTEGRAL Science Data Center. Research has made use of SWIFT data obtained through the High Energy Astrophysics Science Archive Research Center Online Service, provided by the NASA/Goddard Space Flight Center. We take the opportunity to thank the TUBITAK National Observatory (Turkey), the Space Research Institute of the Russian Academy of Sciences, and the Kazan Federal University for their support in using RTT-150. Work was financially supported by RNF grant 14-22-00271. Authors are grateful for MPA for the computational support.
References
- Arnaud (1996) Arnaud, K. A.: 1996, in G. H. Jacoby and J. Barnes (eds.), Astronomical Data Analysis Software and Systems V, Vol. 101 of Astronomical Society of the Pacific Conference Series, p. 17
- Belloni (2010) Belloni, T. M.: 2010, in T. Belloni (ed.), Lecture Notes in Physics, Berlin Springer Verlag, Vol. 794 of Lecture Notes in Physics, Berlin Springer Verlag, p. 53
- Borozdin et al. (1998) Borozdin, K. N., Revnivtsev, M. G., Trudolyubov, S. P., Aleksandrovich, N. L., Sunyaev, R. A., and Skinner, G. K.: 1998, Astronomy Letters 24, 435
- Borozdin and Trudolyubov (2000) Borozdin, K. N. and Trudolyubov, S. P.: 2000, Astrophys. J. 533, L131
- Burrows et al. (2005) Burrows, D. N., Hill, J. E., Nousek, J. A., Kennea, J. A., Wells, A., Osborne, J. P., Abbey, A. F., Beardmore, A., Mukerjee, K., Short, A. D. T., Chincarini, G., Campana, S., Citterio, O., Moretti, A., Pagani, C., Tagliaferri, G., Giommi, P., Capalbi, M., Tamburelli, F., Angelini, L., Cusumano, G., Bräuninger, H. W., Burkert, W., and Hartner, G. D.: 2005, Space Sci. Rev. 120, 165
- Churazov et al. (2014) Churazov, E., Sunyaev, R., Isern, J., Knödlseder, J., Jean, P., Lebrun, F., Chugai, N., , S., Bravo, E., Sazonov, S., and Renaud, M.: 2014, Nature 512, 406
- Courvoisier et al. (2003) Courvoisier, T. J.-L., Walter, R., Beckmann, V., Dean, A. J., Dubath, P., Hudec, R., Kretschmar, P., Mereghetti, S., Montmerle, T., Mowlavi, N., Paltani, S., Preite Martinez, A., Produit, N., Staubert, R., Strong, A. W., Swings, J.-P., Westergaard, N. J., White, N., Winkler, C., and Zdziarski, A. A.: 2003, Astron. Astrophys. 411, L53
- Durouchoux et al. (1996) Durouchoux, P., Smith, I. A., Hurley, K., Schultz, A. S. B., Waters, L. B. F. M., van Paradijs, J., Wallyn, P., Hjellming, R. M., Rupen, M. P., Marti, J., Mirabel, F., and Rodriguez, L. F.: 1996, IAU Circ. 6383
- Filippova et al. (2014) Filippova, E., Kuulkers, E., Skådt, N. M., Alfonso-Garzon, J., Beckmann, V., Bird, A. J., Brandt, S., Chenevez, J., Del Santo, M., Domingo, A., Ebisawa, K., Jonker, P. G., Kretschmar, P., Markwardt, C. B., Oosterbroek, T., Paizis, A., Pottschmidt, K., Sanchez-Fernandez, C., Wijnands, R., Bozzo, E., and Ferrigno, C.: 2014, The Astronomer’s Telegram 5991
- Fuerst et al. (2016) Fuerst, F., Tomsick, J. A., Yamaoka, K., Dauser, T., Miller, J. M., Clavel, M., Corbel, S., Fabian, A. C., Garcia, J., Harrison, F. A., Loh, A., Kaaret, P., Kalemci, E., Migliari, S., Miller-Jones, J. C. A., Pottschmidt, K., Rahoui, F., Rodriguez, J., Stern, D., Stuhlinger, M., Walton, D. J., and Wilms, J.: 2016, ArXiv e-prints
- Gehrels et al. (2004) Gehrels, N., Chincarini, G., Giommi, P., Mason, K. O., Nousek, J. A., Wells, A. A., White, N. E., Barthelmy, S. D., Burrows, D. N., Cominsky, L. R., Hurley, K. C., Marshall, F. E., Mészáros, P., Roming, P. W. A., Angelini, L., Barbier, L. M., Belloni, T., Campana, S., Caraveo, P. A., Chester, M. M., Citterio, O., Cline, T. L., Cropper, M. S., Cummings, J. R., Dean, A. J., Feigelson, E. D., Fenimore, E. E., Frail, D. A., Fruchter, A. S., Garmire, G. P., Gendreau, K., Ghisellini, G., Greiner, J., Hill, J. E., Hunsberger, S. D., Krimm, H. A., Kulkarni, S. R., Kumar, P., Lebrun, F., Lloyd-Ronning, N. M., Markwardt, C. B., Mattson, B. J., Mushotzky, R. F., Norris, J. P., Osborne, J., Paczynski, B., Palmer, D. M., Park, H.-S., Parsons, A. M., Paul, J., Rees, M. J., Reynolds, C. S., Rhoads, J. E., Sasseen, T. P., Schaefer, B. E., Short, A. T., Smale, A. P., Smith, I. A., Stella, L., Tagliaferri, G., Takahashi, T., Tashiro, M., Townsley, L. K., Tueller, J., Turner, M. J. L., Vietri, M., Voges, W., Ward, M. J., Willingale, R., Zerbi, F. M., and Zhang, W. W.: 2004, Astrophys. J. 611, 1005
- Grebenev et al. (1993) Grebenev, S., Sunyaev, R., Pavlinsky, M., Churazov, E., Gilfanov, M., Dyachkov, A., Khavenson, N., Sukhanov, K., Laurent, P., Ballet, J., Claret, A., Cordier, B., Jourdain, E., Niel, M., Pelaez, F., and Schmitz-Fraysse, M. C.: 1993, Astron. Astrophys. Suppl. Ser. 97, 281
- Grebenev and Mereminskiy (2015) Grebenev, S. A. and Mereminskiy, I. A.: 2015, Astronomy Letters 41, 765
- Grebenev et al. (2014) Grebenev, S. A., Prosvetov, A. V., and Burenin, R. A.: 2014, Astronomy Letters 40, 171
- Grebenev et al. (2016) Grebenev, S. A., Prosvetov, A. V., Burenin, R. A., Krivonos, R. A., and Mescheryakov, A. V.: 2016, Astronomy Letters 42, 69
- Grebenev et al. (2013) Grebenev, S. A., Prosvetov, A. V., and Sunyaev, R. A.: 2013, Astronomy Letters 39, 367
- Grebenev et al. (1997) Grebenev, S. A., Sunyaev, R. A., and Pavlinsky, M. N.: 1997, Advances in Space Research 19, 15
- Greiner et al. (1996) Greiner, J., Dennerl, K., and Predehl, P.: 1996, Astron. Astrophys. 314, L21
- Krimm et al. (2014) Krimm, H. A., Barthelmy, S. D., Baumgartner, W., Cummings, J., Gehrels, N., Lien, A. Y., Markwardt, C. B., Palmer, D., Sakamoto, T., Stamatikos, M., and Ukwatta, T.: 2014, The Astronomer’s Telegram 5986
- Krivonos et al. (2010) Krivonos, R., Revnivtsev, M., Tsygankov, S., Sazonov, S., Vikhlinin, A., Pavlinsky, M., Churazov, E., and Sunyaev, R.: 2010, Astron. Astrophys. 519, A107
- Krivonos et al. (2012a) Krivonos, R., Tsygankov, S., Lutovinov, A., Revnivtsev, M., Churazov, E., and Sunyaev, R.: 2012a, A&A 545, A27
- Krivonos et al. (2012b) Krivonos, R., Tsygankov, S., Revnivtsev, M., Sazonov, S., Churazov, E., and Sunyaev, R.: 2012b, Astron. Astrophys. 537, A92
- Kuulkers et al. (2007) Kuulkers, E., Shaw, S. E., Paizis, A., Chenevez, J., Brandt, S., Courvoisier, T. J.-L., Domingo, A., Ebisawa, K., Kretschmar, P., Markwardt, C. B., Mowlavi, N., Oosterbroek, T., Orr, A., Rísquez, D., Sanchez-Fernandez, C., and Wijnands, R.: 2007, Astron. Astrophys. 466, 595
- Lund et al. (2003) Lund, N., Budtz-Jørgensen, C., Westergaard, N. J., Brandt, S., Rasmussen, I. L., Hornstrup, A., Oxborrow, C. A., Chenevez, J., Jensen, P. A., Laursen, S., Andersen, K. H., Mogensen, P. B., Rasmussen, I., Omø, K., Pedersen, S. M., Polny, J., Andersson, H., Andersson, T., Kämäräinen, V., Vilhu, O., Huovelin, J., Maisala, S., Morawski, M., Juchnikowski, G., Costa, E., Feroci, M., Rubini, A., Rapisarda, M., Morelli, E., Carassiti, V., Frontera, F., Pelliciari, C., Loffredo, G., Martínez Núñez, S., Reglero, V., Velasco, T., Larsson, S., Svensson, R., Zdziarski, A. A., Castro-Tirado, A., Attina, P., Goria, M., Giulianelli, G., Cordero, F., Rezazad, M., Schmidt, M., Carli, R., Gomez, C., Jensen, P. L., Sarri, G., Tiemon, A., Orr, A., Much, R., Kretschmar, P., and Schnopper, H. W.: 2003, A&A 411, L231
- Marti et al. (1997) Marti, J., Mirabel, I. F., Duc, P.-A., and Rodriguez, L. F.: 1997, Astron. Astrophys. 323, 158
- Matsuoka et al. (2009) Matsuoka, M., Kawasaki, K., Ueno, S., Tomida, H., Kohama, M., Suzuki, M., Adachi, Y., Ishikawa, M., Mihara, T., Sugizaki, M., Isobe, N., Nakagawa, Y., Tsunemi, H., Miyata, E., Kawai, N., Kataoka, J., Morii, M., Yoshida, A., Negoro, H., Nakajima, M., Ueda, Y., Chujo, H., Yamaoka, K., Yamazaki, O., Nakahira, S., You, T., Ishiwata, R., Miyoshi, S., Eguchi, S., Hiroi, K., Katayama, H., and Ebisawa, K.: 2009, Publ. Astron. Soc. Japan 61, 999
- Mereminskiy et al. (2016) Mereminskiy, I., Krivonos, R., Grebenev, S., Filippova, E., and Sunyaev, R.: 2016, The Astronomer’s Telegram 9517
- Miller et al. (2015) Miller, J. M., Tomsick, J. A., Bachetti, M., Wilkins, D., Boggs, S. E., Christensen, F. E., Craig, W. W., Fabian, A. C., Grefenstette, B. W., Hailey, C. J., Harrison, F. A., Kara, E., King, A. L., Stern, D. K., and Zhang, W. W.: 2015, Astrophys. J. 799, L6
- Neilsen et al. (2016) Neilsen, J., Motta, S., Ponti, G., Coriat, M., Fender, R., and Corbel, S.: 2016, The Astronomer’s Telegram 9541
- Paul et al. (1996) Paul, J., Bouchet, L., Churazov, E., and Sunyaev, R.: 1996, IAU Circ. 6348
- Remillard and McClintock (2006) Remillard, R. A. and McClintock, J. E.: 2006, Ann. Rev. Astron. Astrophys. 44, 49
- Revnivtsev et al. (2004) Revnivtsev, M. G., Sunyaev, R. A., Varshalovich, D. A., Zheleznyakov, V. V., Cherepashchuk, A. M., Lutovinov, A. A., Churazov, E. M., Grebenev, S. A., and Gilfanov, M. R.: 2004, Astronomy Letters 30, 382
- Russell et al. (2006) Russell, D. M., Fender, R. P., Hynes, R. I., Brocksopp, C., Homan, J., Jonker, P. G., and Buxton, M. M.: 2006, Mon. Not. Roy. Astron. Soc. 371, 1334
- Tanaka and Shibazaki (1996) Tanaka, Y. and Shibazaki, N.: 1996, Ann. Rev. Astron. Astrophys. 34, 607
- Ubertini et al. (2003) Ubertini, P., Lebrun, F., Di Cocco, G., Bazzano, A., Bird, A. J., Broenstad, K., Goldwurm, A., La Rosa, G., Labanti, C., Laurent, P., Mirabel, I. F., Quadrini, E. M., Ramsey, B., Reglero, V., Sabau, L., Sacco, B., Staubert, R., Vigroux, L., Weisskopf, M. C., and Zdziarski, A. A.: 2003, Astron. Astrophys. 411, L131
- Vargas et al. (1997) Vargas, M., Goldwurm, A., Laurent, P., Paul, J., Jourdain, E., Roques, J.-P., Borrel, V., Bouchet, L., Sunyaev, R., Churazov, E., Gilfanov, M., Novikov, B., Dyachkov, A., Khavenson, N., Sukhanov, K., and Kuleshova, N.: 1997, Astrophys. J. 476, L23
- Winkler et al. (2003) Winkler, C., Courvoisier, T. J.-L., Di Cocco, G., Gehrels, N., Giménez, A., Grebenev, S., Hermsen, W., Mas-Hesse, J. M., Lebrun, F., Lund, N., Palumbo, G. G. C., Paul, J., Roques, J.-P., Schnopper, H., Schönfelder, V., Sunyaev, R., Teegarden, B., Ubertini, P., Vedrenne, G., and Dean, A. J.: 2003, Astron. Astrophys. 411, L1