Mpc-scale diffuse radio emission in two massive cool-core clusters of galaxies
Abstract
Radio halos are diffuse synchrotron sources on scales of 1 Mpc that are found in merging clusters of galaxies, and are believed to be powered by electrons re-accelerated by the merger-driven turbulence. We present measurements of extended radio emission on similarly large scales in two clusters of galaxies hosting cool cores: Abell 2390 and Abell 2261. The analysis is based on interferometric imaging with the JVLA, VLA and GMRT. We present detailed radio images of the targets, subtract the compact emission components, and measure the spectral indices for the diffuse components. The radio emission in A2390 extends beyond a known sloshing-like brightness discontinuity, and has a very steep in-band spectral slope at 1.5 GHz that is similar to some known ultra-steep spectrum radio halos. The diffuse signal in A2261 is more extended than in A2390 but has lower luminosity. X-ray morphological indicators, derived from XMM-Newton X-ray data, place these clusters in the category of relaxed or regular systems, although some asymmetric features that can indicate past minor mergers are seen in the X-ray brightness images. If these two Mpc-scale radio sources are categorized as giant radio halos, they question the common assumption of radio halos occurring exclusively in clusters undergoing violent merging activity, in addition to commonly used criteria in distinguishing between radio halos and mini-halos.
keywords:
radiation mechanisms: non-thermal – radiation mechanisms: thermal – galaxies: clusters: intracluster medium– radio continuum: general1 Introduction
The intra-cluster medium (ICM) in massive clusters of galaxies is host to various populations of ultra-relativistic particles (cosmic rays) that show their presence mainly through synchrotron emission at radio wavelengths. While some of the synchrotron emission is associated with radio galaxies (such as radio jets and radio lobes), there is a clear distinction from the more diffuse components observed in the direction of some clusters. Radio relics are one class of diffuse sources that are generally associated with shocks originating in merger events (Ensslin et al., 1998), and are typically observed at the outskirts of clusters. Radio halos (also Giant radio halos, or GRHs), typically on the scale of 1 Mpc and located in the cluster inner regions, are a class of diffuse sources that indicate the presence of cluster-wide particle acceleration mechanisms. Radio mini-halos are another class of diffuse synchrotron sources that have been classified as distinct from GRHs (See, e.g., Feretti et al. (2012) for a review).
Giant Radio halos have preferentially been found in dynamically disturbed systems, provisionally indicating a turbulent origin of the cosmic ray acceleration (Buote, 2001; Cassano et al., 2010). One striking property of radio halos is a bi-modal distribution (Brunetti et al., 2007), whereby galaxy clusters appear divided into on- and off-states in the radio regime, although it has been cautioned that such a bi-modality may also come about by selection biases (Basu, 2012). Furthermore, the relative prevalence of radio halos is still largely unknown. Sommer & Basu (2014) found that the selection of galaxy clusters from X-ray surveys biases against disturbed systems, thereby underestimating the fraction of radio halo clusters. Cuciti et al. (2015) found a large fraction of radio halos in high-mass clusters, where most of them conform to the criteria of merging systems, following the morphological classification discussed in Cassano et al. (2010).
Radio mini-halos have been classified as distinct from GRHs mainly due to their compact sizes (100200 kpc) and their occurrence in the central regions of cool-core clusters (e.g., Gitti, Brunetti & Setti, 2002; Gitti et al., 2004). The number of known mini-halos is small compared to known GRHs (Giacintucci et al., 2014; Bravi, Gitti & Brunetti, 2015), and their production mechanism is even more uncertain than that of the GRHs. One suggested explanation invokes the mechanism of particle acceleration through ICM turbulence as in the GRHs, but with the source of turbulence being gas sloshing at the cluster core (e.g., Mazzotta & Giacintucci, 2008; ZuHone et al., 2013). Alternatively, a hadronic origin of the mini-halos, in which radio-emitting electrons are generated from interactions between cosmic-ray protons and the thermal ICM protons, has been proposed (Fujita & Ohira, 2013; Zandanel, Pfrommer & Prada, 2014).
In the framework of turbulent models, the discovery of a giant radio halo in a cool core cluster can be considered surprising, since cool cores are generally associated with relaxed objects. The elevated level of turbulent kinetic energy that can drive particle acceleration is only sustainable on timescales of the order Gyr (Hallman & Jeltema, 2011; Miniati, 2014), within which a disrupted cool core will not be able to re-assemble. In spite of this theoretical expectation, a first identification of a GRH in a cool-core cluster was recently made (Bonafede et al., 2014). In this work, we present the analysis of extended, Mpc scale diffuse radio emissions in the two galaxy clusters Abell 2390 and Abell 2261. Neither of these systems has previously been classified as a merging system, and Allen (2000) found both objects to host cool cores (More recent work by Mahdavi et al. 2013 also classify both objects as cool-core systems, although the classification of A2261 can be said to be marginal). We point out that central diffuse radio emissions has been previously identified in both clusters, although neither was considered as hosting a giant radio halo. In this work, we show the presence of diffuse radio emission at a scale of 1 Mpc in these objects, based on observations using JVLA, VLA and GMRT. To inverstigate the dynamical states of the systems, we use X-ray photometry from XMM-Newton.
Abell 2390 (henceforth A2390) is a massive cool-core cluster at =0.228 (redshift from Struble & Rood 1999), previously identified to host a radio mini-halo by Bacchi et al. (2003). We re-analyze the 1.4 GHz VLA data originally presented by Bacchi et al. In addition, we present more recent observations with the JVLA at the same frequency, allowing for a deeper image with greater spatial dynamic range and the determination of the spectral slope of the diffuse component.
Venturi et al. (2008) identified hints of diffuse emission in Abell 2261 (henceforth A2261), another massive cool-core cluster at =0.224 (redshift from Struble & Rood 1999), from observations with the VLA. We re-analyze the relevant archived data, and use further archived VLA data with higher spatial resolution to model and subtract the compact emission. Our analysis confirms the presence of diffuse Mpc-scale radio emission in this galaxy cluster.
We outline the interferometric and X-ray observations in Section 2, and describe our data analysis in Section 3. Our main results are presented in Section 4. We discuss our findings in Section 5 and offer our conclusions in Section 6. For all results derived in this work we assume a CDM concordance cosmology with , and . Given the similar redshifts of the two clusters, the angular to physical scale conversion is then roughly 200 kpc/arcmin for both targets.
2 Targets and observations
The two clusters we focus on in this work, A2390 and A2261, were identified by analyzing the radio data of a sample of 26 galaxy clusters, selected to be complete above a mass threshold in the redshift range . Masses were inferred from the integrated Comptonization of the clusters, as measured from their Sunyaev-Zel’dovich (SZ) effect in the ESZ Planck catalog (Planck Collaboration, 2011). In addition, independent estimates of the masses are available from the weak-lensing analysis of the Canadian Cluster Comparison Project (CCCP; Hoekstra et al. 2015), with determined from a Navarro-Frenk-White (NFW) fit to be and for A2390 and A2261, respectively. These two targets are thus some of the most massive cool core clusters known.
It is known that X-ray selected samples are biased towards cool core clusters (e.g., Eckert, Molendi & Paltani, 2011), whereas an SZ selection is less sensitive to cluster dynamical states and provides a better mass proxy than the X-ray luminosity (e.g. Motl et al., 2005). In Sommer & Basu (2014) we argued that this can result in an under-representation of giant radio halos in X-ray selected samples. However, the two present target clusters are massive enough to be unaffected by such selection considerations; indeed both A2390 and A2261 are also part of the GMRT radio halo survey (Kale et al., 2015) which is X-ray selected. The SZ-based selection thus does not play a major role in this work apart from sorting out some of the most massive clusters for radio follow-up studies.
We primarily made use of our proprietary JVLA data (project 13A-26) for A2390, using the full 1 GHz bandwidth of the L band (1.4 GHz) with 16 spectral windows of 64 channels each. The observations were done in 30 minute blocks in each of the B, C and D configurations. We also calibrated and imaged archival VLA C array data to check our results for consistency. For A2261, we calibrated archival VLA data from 4 hours of observations each in the B and D configuration, with a 100 MHz bandwidth. The D configuration data were previously analyzed by Venturi et al. (2008). We also re-analyzed archived low-frequency GMRT data, originally published by Kale et al. (2013). In Table 1 we summarize the radio frequency data used in this Paper.
| Object | project | date(s) of | facility/array | no. of | central | Bandwidth |
|---|---|---|---|---|---|---|
| number | observations | configuration | hours | freq. | ||
| A2390 | AF367 | 28-Apr-2000 | VLA/C | 1.0 | 1.4 GHz | 100 MHz |
| 13A-268 | 12-Jan-2014; 6-Mar-2015 | JVLA/B | 0.5 | 1.5 GHz | 1.0 GHz | |
| 13A-268 | 25-Jul-2013; 31-Jul-2013 | JVLA/C | 1.0 | 1.5 GHz | 1.0 GHz | |
| 13A-268 | 3-Mar-2013; 11-Mar-2013 | JVLA/D | 1.0 | 1.5 GHz | 1.0 GHz | |
| A2261 | AC696 | 8-Dec-2003; 3-Jan-2004 | VLA/B | 4.0 | 1.4 GHz | 100 MHz |
| AC696 | 20-Aug-2004 | VLA/D | 4.1 | 1.4 GHz | 100 MHz | |
| 16_117 | 7-May-2009; 9-May-2009 | GMRT | 6.0 | 240 MHz | 6.9 MHz | |
| 16_117 | 7-May-2009; 9-May-2009 | GMRT | 6.0 | 610 MHz | 30 MHz |
To investigate the dynamical states of our targets, we make use of the archival XMM-Newton X-ray observations 0111270101 (for A2390) and 0693180901 (for A2261).
3 Method
3.1 Radio calibration and imaging
3.1.1 VLA, JVLA
Calibration was carried out with standard flux and phase calibrators using the CASA (McMullin et al., 2007) software package. Flux and bandpass calibration at 1.4 GHz were performed against the known sources 3C286 (A2261) and 3C48 (A2390), adopting the Baars et al. (1977) flux scale. Bandpass stability across the observations was assumed. Gain phases and amplitudes were calibrated every ten to fifteen minutes against bright nearby sources (bootstrapped in amplitude against the primary calibrators), and were furthermore self-calibrated at the imaging stage, resulting in residual phase errors on the order of 5% for the VLA data.
Excision of radio frequency interference (RFI) was done by careful visual inspection of each spectral window, antenna pair and correlation. Approximately 40% of the 1 GHz bandwidth of JVLA was completely lost (including the flagging of channels at the edges of spectral windows, depending on the bandpass response). In total, the excised data did not exceed 60% for JVLA. For the archived VLA data RFI was less of a problem, with approximately 15% of the data being flagged after visual inspection.
Imaging was carried out in CASA , using the multi-scale multi-frequency synthesis (MSMFS) CLEAN algorithm (Venkata, 2010) to model the spectrum of each clean component (JVLA) in addition to using multi-scale CLEANing. For JVLA data, due to the large bandwidth, we used a spectral model, using a Taylor expansion with two Taylor terms (multi-frequency synthesis). VLA and GMRT data, due to the limited bandwidth, were imaged in single frequency mode.
To avoid biases in the images, we avoided creating CLEAN boxes by visual inspection. Instead, the mask was defined where the flux in the current image (residual plus clean components convolved with the restoring beam) was in excess of five times the rms of the residual image. Cleaning was stopped at the level of the current image noise estimate, and the mask was re-calculated. We iterated until both the rms level of the residual and the extent of the mask converged; the latter in the sense that no new pixels were added to the mask.
We first imaged each data set (by array configuration) separately, using Briggs weighting with robust=0 and performing several cycles of phase-only self-calibration. In the A2390 field, two compact sources residing in the secondary lobes of the primary beam were modeled and subtracted from the plane, separately for each data set. The coordinates of these sources are (J2000) [21h52m25.4, +17d34m43] and [21h54m40.2, +17d27m59]. The corresponding NVSS (NRAO VLA Sky Survey; Condon et al. 1998) measurements of integrated flux are 680.5 mJy and 293.9 mJy, respectively.
We proceeded to combine the visibilities from all array configurations and re-imaged the targets. At this point we performed one iteration of self-calibration on amplitude and phase, with the data averaged over ten minute chunks. This improved the phase solutions of the visibilities from the more extended array configurations, in addition to mitigating problems arising from systematic errors in the amplitude calibration between the different observations.
Due to the mismatched bandwidths, we imaged the VLA data separately from the JVLA data. The integrity of the calibration was checked by comparing integrated flux densities of compact sources in the images to those of the NVSS (Condon et al., 1998) and FIRST (Becker, White & Helfand, 1995) surveys.
Relative weights on the visibilities were re-estimated from the data, after subtraction of a preliminary model of the sky emission, to improve the rms of the images. For JVLA, this was done from the rms of the data, per baseline and spectral window in segments of 1 minute of integration, after subtraction of a source model, thereby improving the image rms by approximately 20% on average. For VLA, visibility weights were computed on a longer time scale (5 minutes) due to the continuum setup of these observations. This improved the image rms by approximately 12% in the A2261 field.
3.1.2 GMRT
The GMRT data at 240 and 610 MHz were calibrated and edited using the AIPS-based SPAM pipeline as detailed by Intema et al. (2016). In short, after inspecting and flagging (removing) bad data from dead antennas, corrupt baselines and RFI, the primary calibrator 3C48 was used to derive instrumental bandpass and complex gain calibrations, adopting the Scaife & Heald (2012) flux scale. Several rounds of self-calibration, wide-field imaging and flagging of more bad data were started off by phase calibrating the target field data against a simple sky model derived from other radio surveys (NVSS, Condon et al. 1998; WENSS, Rengelink et al. 1997; and VLSSr, Lane et al. 2014). Next, two rounds of direction-dependent calibration (peeling), ionospheric modeling (Intema et al., 2009) and wide-field imaging were performed. At this point, all sources beyond a radius of 10 arcmin from the primary beam center were removed (e.g., Bonafede et al. 2015), thus creating a data set suitable for final imaging in CASA.
3.1.3 Radio images
In Table 2 we present the properties of
our most important image products, including all the ones presented
as figures in this work. We discuss the images further in
Section 4.
| Object | central | facility/array | synthesized beam | rms per | Figure |
|---|---|---|---|---|---|
| freq. | configuration(s) | FWHM (arcsec) | beam | ||
| A2390 | 1.4 GHz | JVLA / B+C+D | 40 Jy | Fig. 1 | |
| A2390 | 1.4 GHz | VLA / C | 43 Jy | (not shown) | |
| A2261 | 1.4 GHz | VLA / B+D | 50 Jy | Fig. 2 | |
| A2261 | 1.4 GHz | VLA / B | 34 Jy | Fig. 3 | |
| A2261 | 240 MHz | GMRT | 700 Jy | Fig. 3 | |
| A2261 | 240 MHz | GMRT | 870 Jy | Fig. 4 | |
| A2261 | 610 MHz | GMRT | 90 Jy | Fig. 4 | |
| A2261 | 610 MHz | GMRT | 160 Jy | Fig. 4 |
3.2 Radio image analysis
In this subsection we describe the sensitive process of separating compact from the extended emission by means of using different parts of the space of the interferometric observations. Cool core clusters typically feature bright, central radio sources (e.g., Edge et al. 1999; Mittal et al. 2009), necessitating a very high dynamic range to separate out the relatively much fainter diffuse emission. With traditional synthesis imaging, the latter is not typically attainable with short observations where the space is too sparsely sampled.
As it is necessary to not only separate out point-like or very moderately resolved sources (such as radio galaxies) but also partially extended structures (such as jets and radio lobes) an angular scale must be carefully chosen below which the emission is considered ‘compact’. This is difficult to do in general, as radio lobes can extend to Mpc scales in extreme cases. In this work, we follow the pragmatic approach of inspecting the residual images (after compact source subtraction) to visually exclude the possibility of residual extended emission from radio lobes (Section 4).
After repeated self-calibration (phase only, see Section 3.1) to improve the dynamic range, we used the long baselines to make models of the compact emission component (radio galaxies, jets and lobes) at 20 cm in each field, imaging with Briggs weighting with robust=0. Given a set of visibilities, the connection of distance with the typical recoverable scale is a complicated function of the coverage and the associated weights of the visibilities. For example, in an observation containing lots of radio frequency interference (RFI), predominantly the short spacings may be either severely decimated by flagging or have low weights due to low-level residual RFI superficially manifesting itself as a higher noise level. For these reasons, similar angular to physical scale conversions still result in dissimilar cuts for the different visibilities. We carefully selected these cuts so as to maximize the recovery of compact emissions (smaller than a scale of kpc, which is considerably larger than a radio galaxy but smaller than a GRH) while at the same time minimizing the contribution from extended emissions on scales of Mpc in the compact emission image, resulting in cuts of 1.8 k for A2390 and 1.3 k for A2261. The compact emission models were then Fourier transformed, de-gridded and subtracted from the visibilities prior to imaging the diffuse emission using natural weighting.
Images of the compact emission were made with the multi-scale feature of CASA clean turned off, building the clean models as sums of point sources.
Each of our fields has a bright central radio source, partially resolved in the more extended array configurations. In the A2390 and A2261 fields, respectively, the coordinates of these sources are (J2000) 21h53m36.83 +17d41m43.7 and 17h22m17.01 +32d09m12.9, with the corresponding integrated flux densities (from Gaussian fits) 230.61.0 mJy and 18.750.46 mJy at 20 cm. Special care was taken to model these sources, in particular by joint imaging of data from different array configurations with subsequent self-calibration. We found that the necessary amplitude adjustments were always less than a few per cent, yet vital to the accurate modeling of the bright sources.
Additionally, many types of sources of different spatial extent are present in the targeted fields. We carried out three separate tests for systematic effects in the separation of the compact emission:
-
1.
To test for a possible loss of flux due to missing short spacings, we inserted the CLEAN model of the extended emission into an emission-free direction of the image plane, Fourier-transformed this model to the uv plane and made a deconvolved image. We repeated this process with slightly stretched models of the extended emission, and found no significant loss (less than 5% for both targets, when stretched by up to ).
-
2.
To test for loss of flux due to subtraction of the compact emission, we again Fourier transformed the CLEAN model of the extended emission and cleaned using only the long baselines, to verify that none of this emission was recovered by the process. We found that at most of the diffuse emission was recovered in this way. Note, however, that this simple test does not account for losses due to substructures in the radio emission, that may have been lost prior to modeling this emission.
-
3.
Residual emission from partially subtracted compact sources could possibly be hidden in the noise of the residual images at some level. We tested the robustness of the compact source subtraction by making alternative compact images with a (u,v) cut corresponding to scales smaller than kpc (rather than the nominal 200 kpc used for our main analysis). Imaging the residuals resulted in the extended emission being somewhat attenuated, but at a level of less than 15% in both targets, suggesting that our choice of 200 kpc is robust.
We made deconvolved (CLEANed) images at GHz from compact source-subtracted visibilities, and extracted the diffuse radio flux by measuring the integrated flux inside an aperture corresponding to the -contour of the emission. While this makes our measurements dependent on signal-to-noise, the difference is less than when taking a larger aperture.
1.4 GHz radio luminosities111with this definition we are strictly measuring a luminosity density. For simplicity, we stick with the term ‘luminosity’ for the remainder of the work. for the extended radio emission were computed as
| (1) |
where is the integrated flux density, is the cosmological luminosity distance and the factor is the K-correction, accounting for the observed flux corresponding to a higher rest frequency. The spectral index, , is defined using the convention . Uncertainties on and were propagated through the calculation. The derivation of spectral indices is discussed in the next subsection.
3.3 Spectral slopes
The spectral index of the extended radio emission in A2390 was estimated from the wide-band 20 cm data in two ways, which were found to be consistent. First, we used the CASA spectral index image produced by the wide-band imaging algorithm with nterms=2 to find an average spectral index inside the same aperture used for extracting the flux, albeit with no reliable uncertainty estimate. Secondly, we split the data by frequency to make images centered at 1.25 and 1.81 GHz. The flux in these images were again measured in the aperture described above, with uncertainties derived from regions of the images with no apparent signal. With a simple Monte Carlo approach, drawing flux values at the two frequencies from the allowed ranges, we obtained a posterior distribution of the spectral index. Because residual signals of bright point sources and radio lobes can conceivably affect the determination of the spectral index, we also excluded regions around the brightest point sources and determined the spectral index again. These regions were constructued as a pixel mask, first choosing all pixels exceeding 3 in the image of the compact emission, and subsequenly extending the mask to correspond to the resolution of the image with the residual (extended) emission. This had no effect on the determined values other than a slight increase in the uncertainty.
As we have only narrow-band data at 1.4 GHz for A2261, the spectral slope was estimated in conjunction with the GMRT data, from which we do not have a significant detection of the extended component from either frequency. We measured the signal in the GMRT images in two ways: First, we subtracted the compact emission using the clean components of images made using a lower uv cut of 0.5k. To avoid giving to much weight to the longest baselines (sensitive only to the most compact emission), we tapered the visibilities at 1.4k for these images of the compact emission. We subtracted these components from the visibilities and made new images, now tapered at 0.8k (to recover any extended emission), and proceeded to directly measure the flux of the possible extended emission, in the same aperture as for the 20cm image. To rule out contamination due to residual emission from the complex structure to the North-West of the cluster center (see Fig. 3), we additionally made use of a second method in which we measured the flux in an aperture excluding this region. Specifially, the region corresponds to an excess of 3 or more in any of the three images of the compact emission. The flux was then corrected upwards to match the flux ratio of the VLA image in the corresponding regions. The measured values (see Table 3) using the two methods were found to be consistent.
We tested how well the GMRT data can recover a structure of the size and morphology found at 20cm by injecting the 20cm model, scaled with a spectral index , and measuring the difference in the resulting images. We found relatively high flux recovery ratios: 0.85 at 610 MHz and 0.89 at 240 GHz. The measured signals were corrected upward by the inverses of these factors.
Finally, to determine the mean spectral slope of the A2261 extended emission given the flux measurements at the three different frequencies, we made use of a Monte Carlo Markov chain to fit for the spectral slope (in conjunction with a flux normalization which was subsequently marginalized over).
3.4 X-ray data analysis
The latest versions of the Observation Data Files were downloaded from the XMM-Newton Science Archive (XSA222http://nxsa.esac.esa.int/nxsa-web/) and reduced with version 14.0.0 of the XMM Science Analysis System (XMM-SAS333http://www.cosmos.esa.int/web/xmm-newton/sas). Calibrated event-lists were produced for the EPIC cameras using the standard processing script emchain/epchain, based on the up-to-date calibration database as of January 2015. The event-lists were filtered for time intervals affected by particle contamination using the method described by Pacaud et al. (2016). For A2261, this resulted in a loss of 8% of the EPIC pn data. For A2390, about 50% of the data were rejected for all three instruments. The usable (effective area weighted) exposure time was 9.3ks for A2390 and 25.1ks for A2261. We used the test developed by Kuntz & Snowden (2008) to identify EPIC-MOS CCDs in the so-called anomalous state, which shows enhanced soft band emission, and cross-checked the results via visual inspection of images in the 200-900 eV band. This resulted in the exclusion of CCD4 from the MOS2 camera in the observation of A2261.
For the morphological analysis (Section 5.3.2), we used the [0.4-1.25] keV band. The automated source detection pipeline of Pacaud et al. (2006) was used to create preliminary source masks, which were modified by visual inspection to appropriately retain possible substructures in the ICM. The masked areas were replaced by the values of randomly selected pixels in surrounding annuli. We modeled the background using calibration observations taken with the filter wheel in Closed position. First, we reprojected the stacked event-lists to the same average attitude and applied a rescaling factor for each CCD based on the data recorded in the unexposed CCD corners in the same imaging band444For the EPIC-PN camera, one single rescaling factor was computed and applied to each quadrant. For the EPIC-MOS central CCDs, which have no unexposed corner, we used the average rescaling factor of the outer CCDs whose noise properties best correlate with them according to Kuntz & Snowden (2008) - (2, 3, 6, 7) for MOS1 and (3, 4, 6) for MOS2.. In a second step, we used the outer parts of each pointing to estimate average sky backgrounds at the locations of the clusters and added them to the instrumental background maps. While sky levels estimated in this way may be biased high by residual emission in the cluster outskirts, any such bias would be negligible compared to the cluster emission within 500 kpc which we analyze in Section 5.3.2. Finally, we produced background substracted and exposure corrected surface brightness images, applying a light () gaussian smoothing.
4 Results
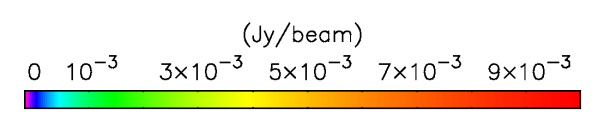
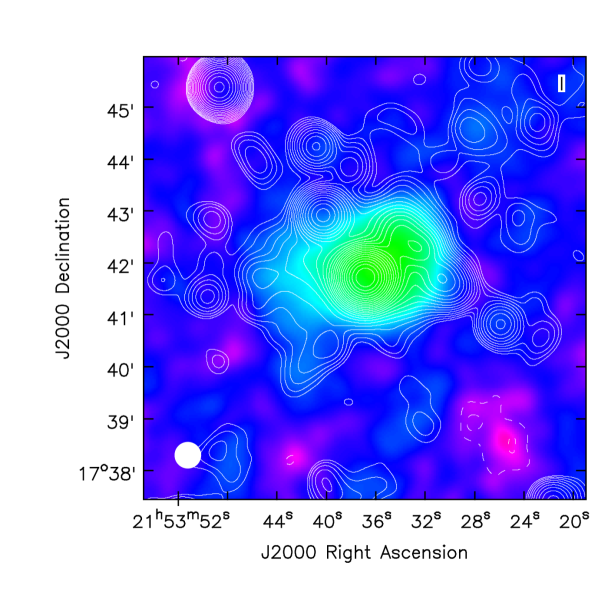
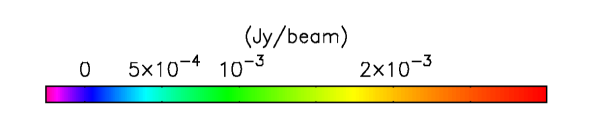
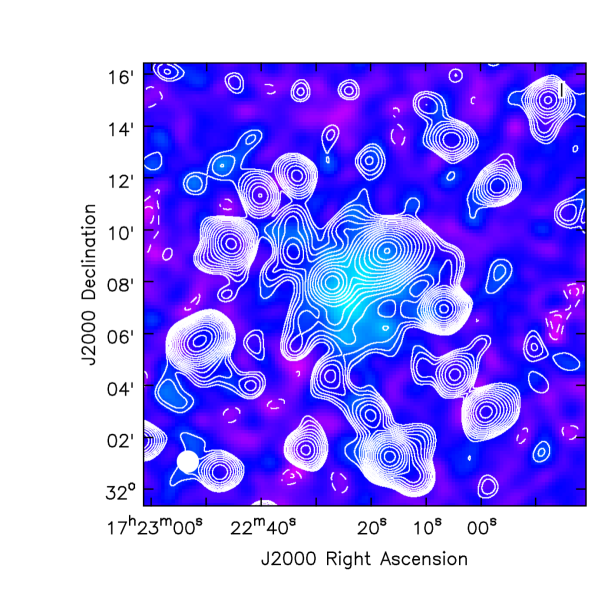
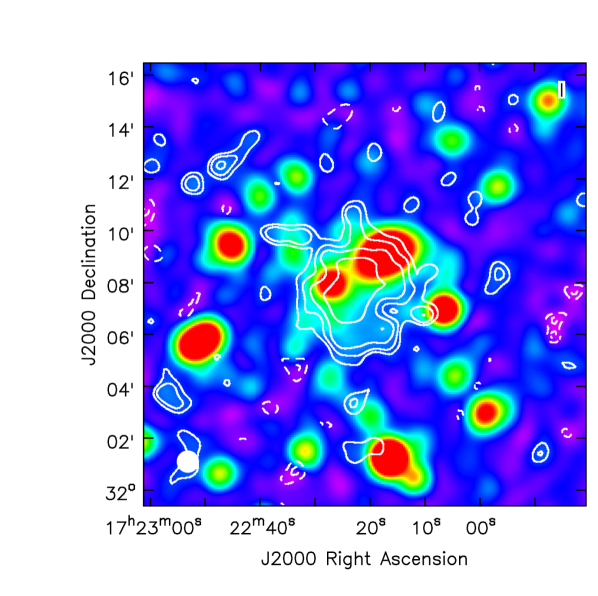
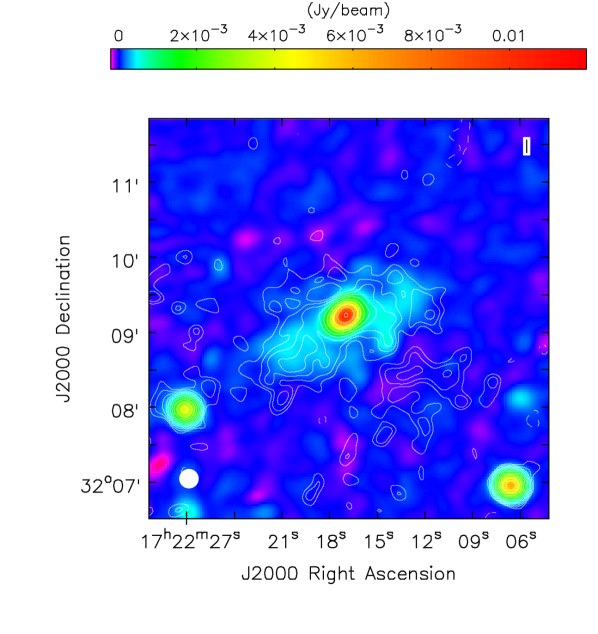
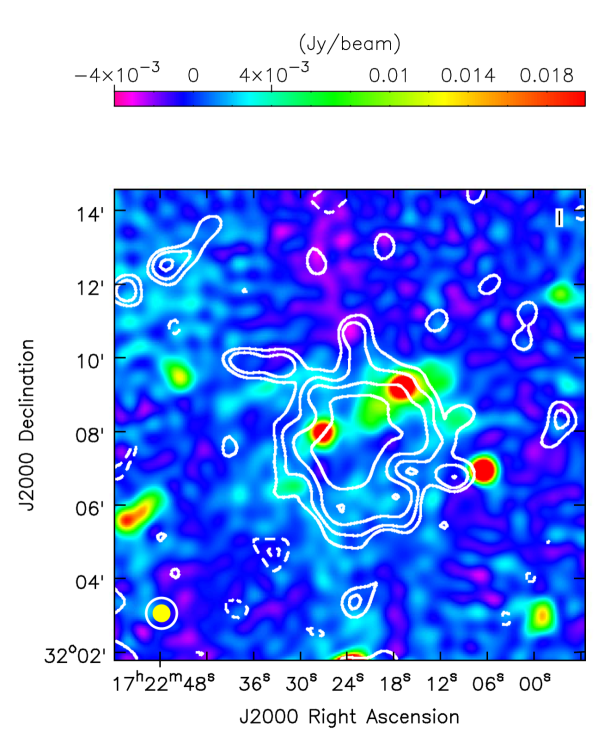
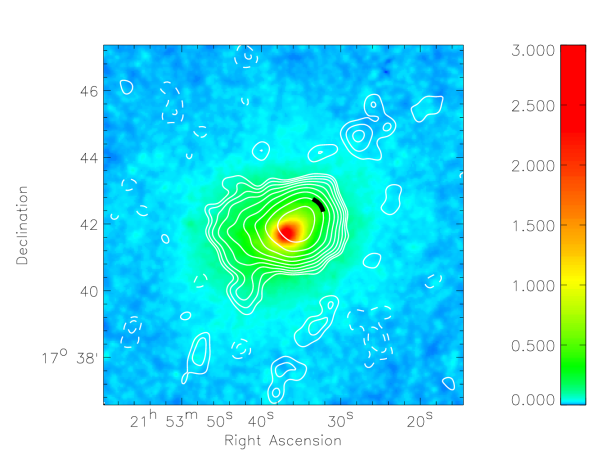
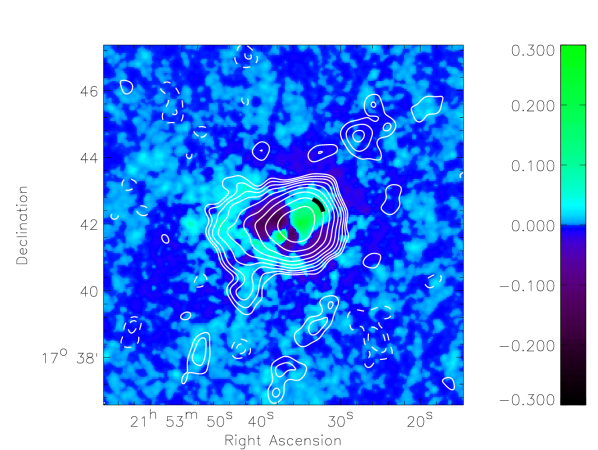
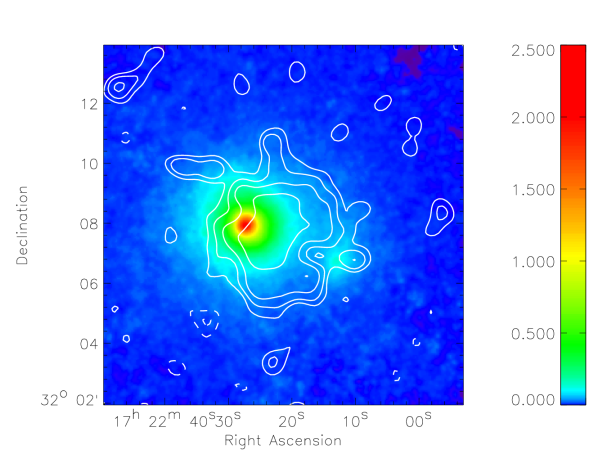
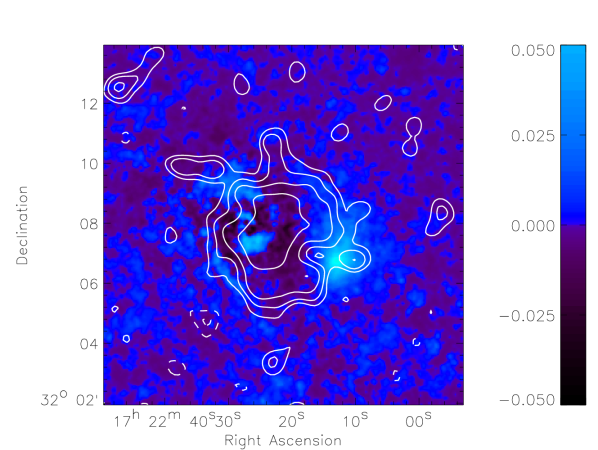
In this section we present radio images of the targets and the associated physical parameters derived from the images. VLA L-band images of A2390 and A2261 are shown in Figures 1 and 2 (array configurations are listed in Table 1). The image of A2390 was smoothed to highlight the 1 Mpc scale emission. For A2261 we show a heavily tapered and smoothed image in Figure 2 to bring out the relatively featureless emission on a scale of several arcminutes and contrast it to other features, including the structure in the central region. The latter is highlighted in Figure 3, where it is shown in higher resolution in conjunction with a GMRT image at 240 MHz. The emission extended at the Mpc scale is clearly distinct from the more compact components, judging in particular by the relative lack of features in the former and the efficiency with which marginally resolved features outside the central regions of the targets are removed by the subtraction of compact components. The morphology of the emission in the images made from the visibilities with the compact emission removed resemble typical GRHs from the literature in both size and shape. Notably, the compact structure around the bright, central source does not align with the peak of the extended emission, suggesting that this is indeed a separate emission component.
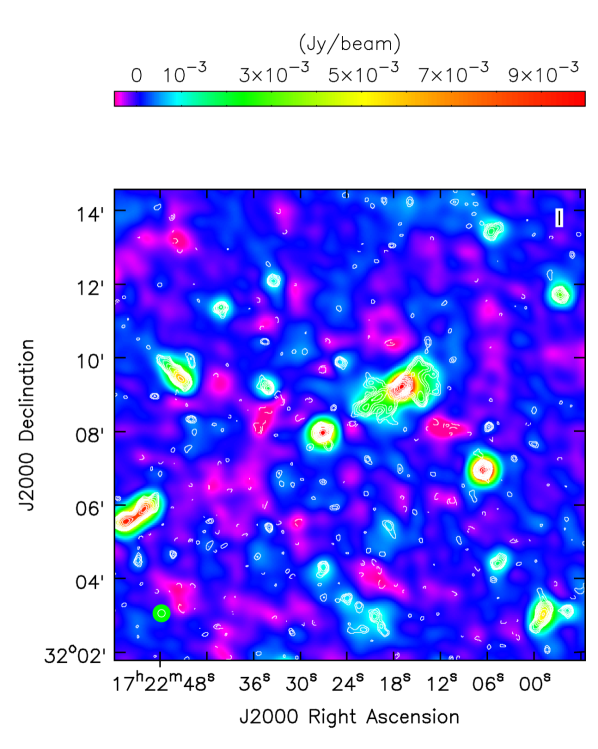
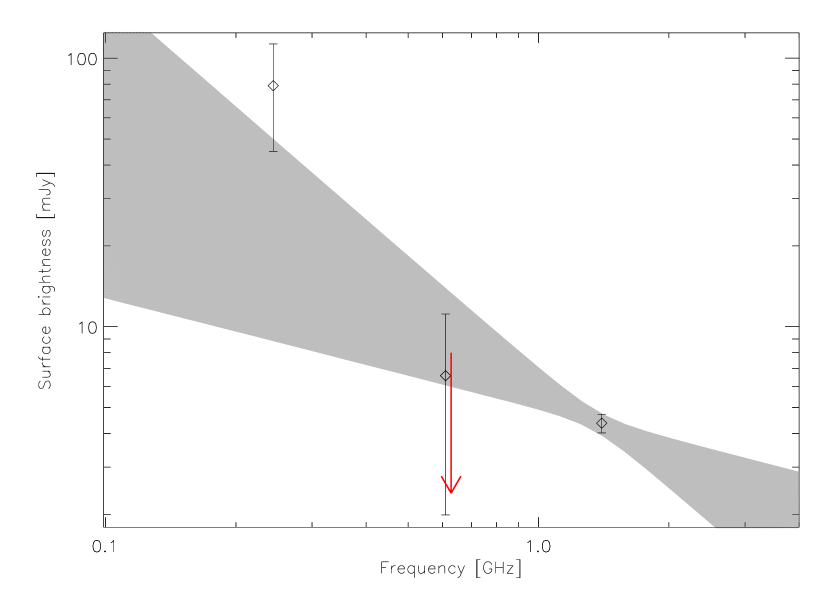
GMRT images of A2261 at 240 and 610 GHz are shown in Fig. 4. Although an extended emission component is not apparent in these images, this is expected due to the relatively high level of noise: in spite of a GRH being expected to be brighter at these frequencies, the signal-to-noise ratio is in fact lower. The latter becomes obvious from Fig. 5, where we show the resulting spectral fit for the A2261 halo. We note here also that the flux at 610 GHz is consistent with the upper limit of Kale et al. (2013).
The relevant physical parameters derived from our analysis are summarized in Table 3. The largest linear scale (LLS) of each target was measured from the -contours of the diffuse emission component images, adjusting for the synthesized beam. For convenience we also give the exact conversions of angular and physical scales given the concordance cosmology. The spectral slope of A2390 is derived from the 20 cm JVLA data alone, as we have no lower frequency data.

| Object | Redshift | Mpc/ | LLS | LLS | Spectral | slope | |||||
| [Mpc] | arcmin | [′] | [Mpc] | [mJy] | [mJy] | [mJy] | [ W/Hz] | ||||
| A2390 | 0.228 | 743 | 0.216 | 3.6 | 0.8 | 16.800.37 | 30.711.29 | (1) | |||
| A2261 | 0.224 | 733 | 0.213 | 5.7 | 1.2 | 7934 | 6.64.6 | 4.370.35 | 7.040.80 | (2) | |
| GHz in-band spectral index | |||||||||||
| MHz GHz spectral index | |||||||||||
5 Discussion
5.1 Comparison with previous results
5.1.1 A2390
The A2390 VLA data at 20 cm were previously analyzed by Bacchi et al. (2003), who identified the radio emission as a mini-halo with an integrated signal of 633 mJy. Because this value is inconsistent with our result, we re-analyzed the VLA data used by Bacchi et al. After careful flagging and self-calibration, we were able to deconvolve an image consistent with our deeper JVLA result. While we confirm the existence of a “hole” in the emission north of the BCG, we find no evidence of filaments extending to the north as reported by Bacchi et al. The large inconsistency could be due to a different definition of the compact emission component. This is difficult to verify as Bacchi et al. do not show an image for which the compact emission has been subtracted; nor do they specify the weighting scheme used in the imaging or the uv tapering used to separate out the emission from compact sources.
The largest physical scale of the extended emission found by Bacchi et al. is 550 kpc, which differs from our estimate of 800 kpc. This corresponds directly to the reported difference in the angular size of the radio emission (after accounting for the respective cosmological models): Bacchi et al. found the largest extent to be , compared to our measurement of . This is likely explained by the lack of short spacings in the earlier analysis.
5.1.2 A2261
The VLA data of A2261 were previously analyzed by Venturi et al. (2008), who found hints of extended emission but concluded that further analysis would be necessary to confirm the result. We have independently confirmed the presence of the extended emission by modeling the compact component from VLA B and D configuration data. Our tests for the robustness of the separation of compact and diffuse emission components, the methods of which are outlined in section 3.2, indicate that the present detection of an extended emission component is robust.
The GMRT data at 240 MHz were first studied by Kale et al. (2013), who reported non-detections of radio halos from the 240 and 610 MHz observations. In particular, upper limits of 8 mJy and 6 mJy at 610 MHz were derived from injection of radio halos with linear sizes of 1.22 Mpc and 1.0 Mpc, respectively. No upper limits were specified for the 240 MHz band. Our measurements are marginally consistent with the results of Kale et al., although our 610 MHz flux measurement is lower than expected from our best-fit spectral slope. A much shallower spectral slope, consistent with the results of Kale et al., is allowed by our analysis (Fig. 5).
5.2 Scaling properties
To shed further light upon whether the extended emission found in our targets should be classified as giant radio halos, we investigate whether the measured luminosities are in the expected range for radio halos, given their linear projected sizes as well as the X-ray luminosities and integrated Comptonizations of the host clusters.
Linear radii are computed following the method of Cassano et al. (2007), using the geometric mean of the largest and smallest radii at the level of the image to characterize the size of a radio halo. Integrated Comptonizations within are adopted from the Planck PSZ catalog (Planck Collaboration et al., 2014), where we use the Planck X-ray derived values of . We compute the intrinsic Comptonization
| (2) |
where is the angular diameter distance and . We obtained X-ray soft band (0.12.4 keV) luminosities for A2390 and A2261 from the BCS (Ebeling et al., 1998) and eBCS (Ebeling et al., 2000) clusters catalogs.
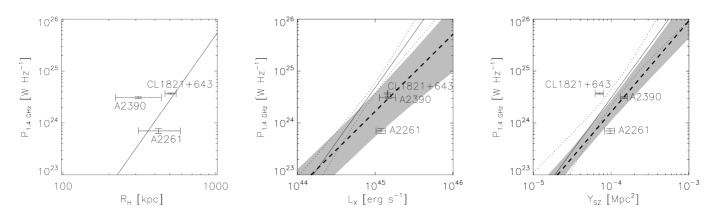
In Fig. 6 we show the scaling of radio luminosity with X-ray luminosity and integrated Comptonization for our two targets. We also include the data for the earlier identification of a GRH in the cool-core cluster CL1821+643 (Bonafede et al., 2014). We compare our measurements to the scaling relations derived by Sommer & Basu (2014) and Cassano et al. (2013). The measured scaling relations have strong intrinsic scatter in the radio luminosity, which can be either physical in origin or due to the difficulty in isolating and quantifying the full extended emission using interferometers, which in turn can lead to an underestimation of the systematic errors in flux measurements. Given the scatter levels reported by Sommer & Basu (2014) and Cassano et al. (2013), the presently reported radio luminositied are consistent with the scaling relations of those works. While a clear scaling of the radio power with mass proxies has been established for GRHs, a corresponding property has not been demonstrated for radio mini-halos.
Comparing to the scaling relations of Cassano et al. (2013), A2390 and A2261 appear radio under-luminous. Apart from the aforementioned large scatter and the fact that we have only three data points in this case, these scaling relations were derived from a fit explicitly excluding the radio non-detections, in a sample not complete within a mass selection. It is thus possible that the Cassano et al. scaling relations are biased towards radio luminous objects. While Cassano et al. (2013) also derived relations for cool-core corrected X-ray luminosities, with similar results, such an analysis does not remove the effect of the selection.
5.3 Dynamical state
We discovered what appear to be giant radio halos in two cool-core clusters of galaxies. Taken together with the results of Bonafede et al. (2014), there are three known such cases. Most clusters hosting a cool core are known to be dynamically relaxed (Edge, Stewart & Fabian, 1992; Allen et al., 2001; Bauer et al., 2005; Vikhlinin et al., 2005), however, the connection between the dynamical state of a cluster and the presence of a cool-core is not straightforward. In this section we examine the empirical evidence available for assessing the dynamical state of these two clusters. To this end we analyze archival XMM-Newton data to compute the values of standard X-ray morphological indicators as well as azimuthal variations in the X-ray brightness.
5.3.1 Previous X-ray and optical analysis
Allen (2000) identified cool cores in both A2261 and A2390 from Chandra data. The measured temperature and entropy profiles can also be seen from the Archive of Chandra Cluster Entropy Profiles (ACCEPT555http://www.pa.msu.edu/astro/MC2/accept/; Cavagnolo et al. 2009), showing clear central temperature drops in both targets. In this work, we quote entropies measured at kpc radii from Mahdavi et al. (2013).
A2390 has a low central entropy of keV cm2. Allen, Ettori & Fabian (2001) determined a cooling radius of kpc, at which the cooling time first exceeds the Hubble time. Dunn & Fabian (2008) determined the cooling radius to be , defined where the cooling time is 3 Gyr. Regardless of the definition of the cooling radius, the radio emission detected in the present work is significantly larger than the radius of cooling and AGN feedback. Although classifying A2390 as a relaxed cluster, Allen et al. (2008) noted substructure within certain position angles from the Chandra images. Allen, Ettori & Fabian (2001) found substructure in the surface brightness on scales , possibly suggesting a locally disturbed or not fully relaxed dynamical state. Weißmann et al. (2013) classified A2390 as an ‘intermediate’ cluster based on a morphology estimator based on the peak of the P3/P0 profile computes in different apertures (see Section 5.3.2 for an explanation of the power ratio P3/P0). A stellar population analysis of the central BCG of A2390 (Bildfell et al., 2008; Loubser et al., 2016) revealed mostly young ( Myr) stars, leading to its classification as a blue-core system with a short cooling timescale.
The cool-core in A2261 is less prominent than the one in A2390, with a central entropy of keV cm2. Bildfell et al. (2008) classified this as a red-core system based on the optical spectra of its central BCG, meaning one that is not actively forming stars due to the cooling of its gas. Nevertheless, it shows a regular, round morphology (within the central 1 Mpc), and based on the small level of substructures and a small centroid shift of the BCG from the X-ray peak ( kpc; Bildfell et al. 2008), it has been classified as a relaxed system (e.g., Maughan et al., 2008).
5.3.2 X-ray morphological estimators
In hierarchically formed structures in the universe, substructures will be present at some level in any system. We therefore choose to rely largely on quantitative measures of relaxation and disturbance. Cassano et al. (2010) showed that galaxy clusters hosting radio halos can be differentiated with respect to their dynamical state characterized using different methods. Following this approach, we computed the power ratio from a multi-pole decomposition of the projected mass distribution (Buote & Tsai, 1995) inside an aperture of radius 500 kpc; the centroid shift from the standard deviation of centroids computed from a series of apertures out to a radius of 500 kpc; and the concentration parameter , defined as the ratio of the peak surface brightness (inside a radius of 100 kpc) and the ambient surface brightness (inside a radius of 500 kpc). The choice of 500 kpc apertures makes a direct comparison with Cassano et al. (2010) possible.
To compute the concentration parameter , we estimated the peak of the cluster emission iteratively by smoothing the surface brightness map to increasingly higher resolution. The flux is simply integrated around this peak within apertures of 100 and 500kpc as described by Cassano et al. (2010), and is defined as the ratio of the two estimates.
For the and the measurements, we followed the suggestion of Böhringer et al. (2010) to fix the center of the aperture at the centroid of the emission obtained by minimizing the dipole moment . We defined the centroid shift as the rms of the distance between the X-ray peak and the flux weighted centroid while the aperture size was varied (Poole et al., 2006). With our XMM-Newton data we only estimated this rms from 10 sub-apertures (Weißmann et al., 2013), i.e. between 50 and 500 kpc with increments of 50kpc. The power ratios were obtained form the surface brightness over the whole aperture =500 kpc.
Uncertainties on all parameters were estimated via Monte Carlo simulations. For and , we obtained a photon model of the whole observation by multiplying the smoothed surface brightness image with the exposure map and adding our background model. A thousand Poisson realisations of the model were generated and analyzed in the same way as the true observation. For the power ratio the process is a bit different as the bias due to Poisson noise must also be corrected for (Weißmann et al., 2013). Rather than performing new simulations, we randomized the azimuthal angle of the photons, permitting to estimate and substract the average power ratio due to shot noise for a perfectly symmetric structure in addition to estimating the uncertainty.
The power ratio and the centroid shift estimators are, by their definition, not sensitive to the presence of substructures occuring exactly along the line of sight. Merger events can thus not be ruled out categorically by these estimators. The concentration parameter, converesly, is sensitive also to line-of-sight occurences, and is used here as a measure of whether the gas in the cluster core has been disrupted by a recent merger event (low gas concentration).
Some mergers have been found to yield inconclusive results using morphological estimators from X-ray photometry (e.g., Shakouri, Johnston-Hollitt & Dehghan 2016). In such cases, a spectroscopic survey of the cluster member galaxies can yield more accurate information on the dynamic state (e.g. Johnston-Hollitt, Hunstead & Corbett, 2008; Owers, Couch & Nulsen, 2009).
Because the resolution can have an effect on the parameters, especially the power ratio, we estimate systematic uncertainties by further downgrading the resolution. In Figure 7 the computed morphological estimators are shown with error bars indicating systematic uncertainties added in quadrature to the statistical uncertainties.
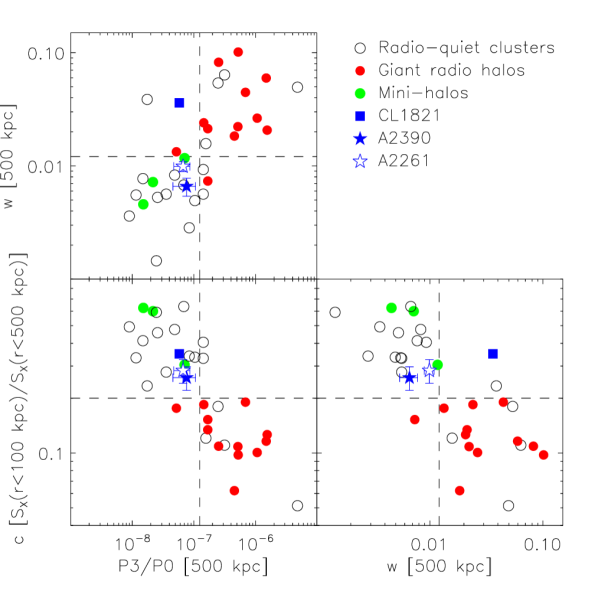
Typically, “radio loud” clusters have high power ratios and centroid shifts combined with low gas concentrations; all characteristic for dynamically disturbed systems and empirically evident from the data of Cassano et al. (2010), adapted in Figure 7. A2261 and A2390 reside in the central region of the joint parameter space, between known halo clusters and known “radio quiet” clusters. Both targets have small centroid shifts, characteristic for dynamically relaxed systems and uncharacteristic for radio loud clusters. The gas concentration parameter likewise suggests a relaxed morphology, although this is somewhat inconclusive because this measure is severely affected by the XMM resolution in the kpc apertures chosen by Cassano et al. (2010). To overcome this problem we also compute concentrations in the larger apertures of , where we find for A2390 and for A2261 (statistical followed by systematic uncertainties due to the resolution). Comparing with the analysis of Cassano et al. (2013), these values place both targets at the boundary of typical radio halo clusters and typical “radio quiet” clusters.
The power ratio , while placing A2390 and A2261 closer to radio-quiet clusters, is also severely affected by the XMM resolution. However, simulations indicate that this quantity fluctuates rapidly during mergers (Hallman & Jeltema, 2011) and may not be a reliable tracer for an ongoing merging activity.
5.3.3 X-ray brightness images
In addition to the ‘global’ morphological indicators of clusters, X-ray brightness images can reveal important clues of ongoing merger activities, like bow shocks and plumes behind a merging sub-structure, or ripple-like features from gas sloshing at the cluster core. We create ‘residual images’ of X-ray surface brightness, after subtracting out the main cluster component, to look for such features.
To create X-ray brightness residual maps, we first fit double elliptical -models to the X-ray photometry in the 0.52 keV band. The fit was carried out by making a count rate model which was tested against the data using the Cash C statistic. The high signal-to-noise allowed fitting the slope, core radius, normalization, eccentricity, inclination angle and centroid of each elliptical model, in addition to a constant sky background. The instrument background was also taken into account. We subtracted the count rate models from the raw images and applied exposure correction.
The residual images are shown in Fig. 8. In the case of A2390, the double model does not seem to provide a sufficient fit to the data, in agreement with the findings of Allen, Ettori & Fabian (2001). Nevertheless, the amplitude of the residuals are small the relative brightness of the brightest positive residual signal (north-west of the cluster center) to the full X-ray emission is less than 1.5%, leading to maximum contribution of this substructure to the gas mass of less then 2% given the scaling of gas mass with X-ray luminosity (e.g. Zhang et al., 2011). We do not see any obvious sub-cluster or bow-shock like features that might indicate an ongoing merger. The region around the detected radio emission also does not reveal signs of sharp discontinuities that can indicate sloshing, although it is possible that the XMM-Newton resolution is not sufficient for detecting such sharp features. Indeed, Sonkamble et al. (2015) identified one such feature from the Chandra imaging data in A2390, at roughly distance from the cluster center. This brightness edge is marked by the thick solid line in the upper-right panel of Fig. 8, clearly within the boundaries of our measured diffuse radio emission.
For the case of A2261, there is an extended structure to the south-west, which appears to be uncorrelated to the region hosting the radio halo emission. We therefore exclude this substructure from our -model fit. The remainder of the cluster emission is extremely uniform within the central Mpc region.
Binning the XMM-Newton spectroscopic data using a Voroni tessellation scheme indicates, apart from the prominent cool cores, a significant azimuthal variation in the distribution of the hot gas, which can be an indicator of past merger activity. Unfortunately, the uncertainties in the tessellated temperatures in both data sets are large, and as such the temperature images are not suitable for a more detailed analysis of the cluster morphologies.
We conclude that while both fields show signs of residual structure after removing a main component (as is expected at some level in any hierarchical scenario), there are no typical signs of mergers in either field. The strongest residual component in A2390 can correspond to no more than a few per cent of the total gas mass in the system, ruling out a major merger scenario, and the levels of substructure in A2261 are lower still. We find no ripple-like features (which would have indicated gas sloshing) from the available XMM-Newton data, but we caution that the XMM resolution may be insufficient for detecting sharp density features. A previously discovered brightness edge in A2390 is located well inside the presently detected radio emission, ruling it out as being directly related to the origin of the diffuse emission.
5.4 Cool cores in merging systems
We find that the standard X-ray morphological indicators place these two clusters apart from the parameter space quadrant of merging systems, where most currently known radio halos reside. While the X-ray brightness images indicate the presence of some substructure, there are no clear signs of active merger activity. A possibility would be that the cool cores have survived minor, non-disruptive merger events, which nonetheless have created enough turbulent energy to power radio halos.
The survival of cluster cool cores during mergers has been verified through numerous simulations. Early hydro-simulations of controlled cluster mergers (Poole et al., 2006, 2008) found that it is difficult to destroy cool-cores unless there is a head-on collision involving a high mass ratio. More recent cosmological hydro-simulations (Hahn et al., 2015) came to similar conclusions. Irrespective of the relative abundance of cool core/non-cool core clusters, cool cores are destroyed only by low angular momentum major mergers. Such a major merger scenario is not supported by the X-ray analysis for either targets, but the occurrence of past minor mergers cannot be ruled out. In the early simulations of Poole et al. (2008) it was reported that off-axis mergers can cause short-lived “warm cores” with elevated entropy, which might be the case for A2261. One main conclusion from these simulation results is that the presence of cool-cores should not be taken as an indicator of a relaxed, virialized systems. Observationally, prominent cool-core clusters show a preference for a steady growth over Gyr (McDonald et al., 2013), during which time minor merger events must have taken place. The two systems discussed in this Paper are among the most massive galaxy clusters known ( M⊙), thus constituting fair targets for mergers over their formation lifetime.
The question of whether a minor, off-axis merger can create enough turbulent energy to cascade into particle acceleration is an open issue. Brunetti et al. (2009) pointed out that a decaying turbulent kinetic energy following a merger strongly suppresses the radio emission, which is a possible mechanism for creating a bi-modality in the radio halo population. Several other factors, including the magnetic field strength and a possible pre-existing cosmic ray electron population, may play a role. If the two objects discussed in this paper are considered as radio halos powered by secondary (turbulent) CRe acceleration, they (together with the similar object in CL1821643) might indicate a new population of radio sources found in massive cool-core clusters with decaying or low-level turbulence, and may well represent an intermediate phase between mini-halos and giant halos.
5.5 A2390: An ultra-steep spectrum radio halo?
The diffuse radio source in A2390 presents an interesting case due to its steep spectrum ( at 20 cm). Such a steep spectrum suggests a turbulent leptonic origin of its cosmic ray electrons, as opposed to a hadronic origin that would require an unrealistically large energy density for the relativistic protons (Brunetti et al., 2008). Indeed, the existence of ultra-steep spectrum radio halos is a distinguishing prediction of the turbulent model, and only a handful of such steep-spectrum sources are known (e.g. Feretti et al. 2012 and references therein). Zandanel, Pfrommer & Prada (2014) suggested a hybrid scenario in which giant radio halos (GHRs) experience a transition from a hadronic emission component in the center to a mainly leptonic component in the halo outskirts. The relatively steep spectrum of A2390 suggests that this may be a radio halo of leptonic origin in transition from a central hadronic component.
Conversely, designating the A2390 radio emission as a mini-halo (albeit with more than double the size of currently known mini-halos, see Giacintucci et al. 2014) with a turbulent origin of its relativistic electrons would require Mpc-scale sloshing motion of its gas core. As discussed in Section 5.3.3, the X-ray brightness of A2390 reveals an edge in the emission, thought to originate from gas sloshing (Sonkamble et al., 2015). However, the presently measured extent of the radio emission extends well beyond that brightness edge (Fig. 8, upper-right panel). The simulations of ZuHone et al. (2013) clearly demonstrate that sloshing motion can generate turbulence only within the sloshing fronts. Unless new sloshing-like features are found further outwards, the radio emission in A2390 can be considered a giant radio halo originating from merger-related turbulence.
6 Summary and conclusions
We have analyzed radio data for two clusters of galaxies hosting cool cores, originating from a mass-selected sample containing some of the most massive known clusters in the universe. Both systems have been previously studied in the radio regime, however, we make the first robust determination of their extended signals using radio images with sufficient spatial dynamic range. In conjunction with the only previously confirmed cool-core cluster hosting radio emission at this scale (Bonafede et al., 2014), there are now three cases of giant radio halos in cool-core cluster with regular X-ray morphologies.
The most important steps of our analysis, and the results obtained, can be summarized as follows:
-
1.
We calibrated JVLA (A2390), VLA (A2390, A2261) and GMRT (A2261) data to allow high dynamic range images of the targets at 1.4 GHz and, in the case of A2261, at 240 and 610 MHz.
-
2.
We verified the recovery of extended emission and the robustness of the subtraction of compact components by means of simulations.
-
3.
We determined the luminosities and spectral slopes of the extended signal components, applying a range of simulations to account for biases due to compact sources.
-
4.
From the 1.4 GHz data, both systems were found to host radio emission on scales of about 1 Mpc. The low-frequency data is not deep enough for an accurate determination of the flux of the extended emission in A2261; however, the data are largely consistent with what would be expected from a radio halo of moderate spectral slope.
-
5.
Scaling properties of the radio emissions with mass proxies were compared to known scaling relations. Given the substantial scatter in such relations, the current results are consistent with previous findings for radio halos.
-
6.
We computed morphological measures quantifying the dynamical states of the clusters. In the space of power ratio versus concentration, the two targets lie in between typical radio halo clusters and typical “radio quiet” clusters. The centroid shift parameters indicate more relaxed morphologies than clusters typically associated with radio halos.
-
7.
To test for density disturbances we fit and subtracted double -models from the XMM-Newton X-ray photometric images. Although there are no obvious signs of ongoing mergers, we do find azimuthal variances in the gas distributions, in agreement with some previous studies.
-
8.
The steep spectral slope of the A2390 radio emission is similar to some known ultra-steep spectrum radio halos, suggesting a possible leptonic origin in transition from a central hadronic component. The halo extends beyond a sloshing-like X-ray brightness discontinuity known from the Chandra data.
Our main conclusion is that the two Mpc-scale diffuse radio emission regions discussed in this work have properties similar to giant radio halos, and should be considered as such. The fact that they are found in two prominent cool-core clusters should not be surprising given that these are extremely massive systems and thus fair targets for minor, off-axis mergers during the formation lifetime of their cool cores.
We find some evidence for minor mergers based on X-ray brightness images. Whether such non-disruptive mergers can generate enough turbulent kinetic energy to eventually power particle acceleration, and how long such elevated level of turbulence lasts, remain open questions. Nevertheless, the current results indicate that the simple picture of radio halos only occurring in actively merging clusters with irregular morphologies is at best incomplete. Together with the similar object in CL1821643, the two objects discussed in this work may be representative of an intermediate phase between mini-halos and giant halos.
Acknowledgments
MWS acknowledges partial support for this work from Transregio Programme TR33 of the German Research Foundation (Deutsche Forschungsgemeinschaft). ABo acknowledges support by the research group FOR 1254 funded by the Deutsche Forschungsgemeinschaft: “Magnetisation of interstellar and intergalactic media: the prospects of low-frequency radio observations”. ABa would like to acknowledge support from NSERC (Canada) through the Discovery Grants program, as well as the Pauli Center for Theoretical Studies UZH ETH. The National Radio Astronomy Observatory is a facility of the National Science Foundation operated under cooperative agreement by Associated Universities, Inc. GMRT is run by the National Centre for Radio Astrophysics of the Tata Institute of Fundamental Research.
References
- Allen (2000) Allen S. W., 2000, \mnras, 315, 269
- Allen, Ettori & Fabian (2001) Allen S. W., Ettori S., Fabian A. C., 2001, \mnras, 324, 877
- Allen et al. (2001) Allen S. W., Fabian A. C., Johnstone R. M., Arnaud K. A., Nulsen P. E. J., 2001, \mnras, 322, 589
- Allen et al. (2008) Allen S. W., Rapetti D. A., Schmidt R. W., Ebeling H., Morris R. G., Fabian A. C., 2008, \mnras, 383, 879
- Baars et al. (1977) Baars J. W. M., Genzel R., Pauliny-Toth I. I. K., Witzel A., 1977, \aap, 61, 99
- Bacchi et al. (2003) Bacchi M., Feretti L., Giovannini G., Govoni F., 2003, \aap, 400, 465
- Basu (2012) Basu K., 2012, \mnras, 421, L112
- Bauer et al. (2005) Bauer F. E., Fabian A. C., Sanders J. S., Allen S. W., Johnstone R. M., 2005, \mnras, 359, 1481
- Becker, White & Helfand (1995) Becker R. H., White R. L., Helfand D. J., 1995, \apj, 450, 559
- Bildfell et al. (2008) Bildfell C., Hoekstra H., Babul A., Mahdavi A., 2008, \mnras, 389, 1637
- Böhringer et al. (2010) Böhringer H. et al., 2010, \aap, 514, A32
- Bonafede et al. (2015) Bonafede A. et al., 2015, \mnras, 454, 3391
- Bonafede et al. (2014) Bonafede A. et al., 2014, \mnras, 444, L44
- Bravi, Gitti & Brunetti (2015) Bravi L., Gitti M., Brunetti G., 2015, in The Many Facets of Extragalactic Radio Surveys: Towards New Scientific Challenges, p. 47
- Brunetti et al. (2009) Brunetti G., Cassano R., Dolag K., Setti G., 2009, \aap, 507, 661
- Brunetti et al. (2008) Brunetti G. et al., 2008, \nat, 455, 944
- Brunetti et al. (2007) Brunetti G., Venturi T., Dallacasa D., Cassano R., Dolag K., Giacintucci S., Setti G., 2007, \apjl, 670, L5
- Buote (2001) Buote D. A., 2001, \apjl, 553, L15
- Buote & Tsai (1995) Buote D. A., Tsai J. C., 1995, \apj, 452, 522
- Cassano et al. (2007) Cassano R., Brunetti G., Setti G., Govoni F., Dolag K., 2007, \mnras, 378, 1565
- Cassano et al. (2013) Cassano R. et al., 2013, \apj, 777, 141
- Cassano et al. (2010) Cassano R., Ettori S., Giacintucci S., Brunetti G., Markevitch M., Venturi T., Gitti M., 2010, \apjl, 721, L82
- Cavagnolo et al. (2009) Cavagnolo K. W., Donahue M., Voit G. M., Sun M., 2009, \apjs, 182, 12
- Condon et al. (1998) Condon J. J., Cotton W. D., Greisen E. W., Yin Q. F., Perley R. A., Taylor G. B., Broderick J. J., 1998, \aj, 115, 1693
- Cuciti et al. (2015) Cuciti V., Cassano R., Brunetti G., Dallacasa D., Kale R., Ettori S., Venturi T., 2015, \aap, 580, A97
- Dunn & Fabian (2008) Dunn R. J. H., Fabian A. C., 2008, \mnras, 385, 757
- Ebeling et al. (2000) Ebeling H., Edge A. C., Allen S. W., Crawford C. S., Fabian A. C., Huchra J. P., 2000, \mnras, 318, 333
- Ebeling et al. (1998) Ebeling H., Edge A. C., Bohringer H., Allen S. W., Crawford C. S., Fabian A. C., Voges W., Huchra J. P., 1998, \mnras, 301, 881
- Eckert, Molendi & Paltani (2011) Eckert D., Molendi S., Paltani S., 2011, \aap, 526, A79
- Edge et al. (1999) Edge A. C., Ivison R. J., Smail I., Blain A. W., Kneib J.-P., 1999, \mnras, 306, 599
- Edge, Stewart & Fabian (1992) Edge A. C., Stewart G. C., Fabian A. C., 1992, \mnras, 258, 177
- Ensslin et al. (1998) Ensslin T. A., Biermann P. L., Klein U., Kohle S., 1998, \aap, 332, 395
- Feretti et al. (2012) Feretti L., Giovannini G., Govoni F., Murgia M., 2012, \aapr, 20, 54
- Fujita & Ohira (2013) Fujita Y., Ohira Y., 2013, \mnras, 428, 599
- Giacintucci et al. (2014) Giacintucci S., Markevitch M., Venturi T., Clarke T. E., Cassano R., Mazzotta P., 2014, \apj, 781, 9
- Gitti et al. (2004) Gitti M., Brunetti G., Feretti L., Setti G., 2004, \aap, 417, 1
- Gitti, Brunetti & Setti (2002) Gitti M., Brunetti G., Setti G., 2002, \aap, 386, 456
- Hahn et al. (2015) Hahn O., Martizzi D., Wu H.-Y., Evrard A. E., Teyssier R., Wechsler R. H., 2015, ArXiv e-prints
- Hallman & Jeltema (2011) Hallman E. J., Jeltema T. E., 2011, \mnras, 418, 2467
- Hoekstra et al. (2015) Hoekstra H., Herbonnet R., Muzzin A., Babul A., Mahdavi A., Viola M., Cacciato M., 2015, \mnras, 449, 685
- Intema et al. (2016) Intema H. T., Jagannathan P., Mooley K. P., Frail D. A., 2016, ArXiv e-prints
- Intema et al. (2009) Intema H. T., van der Tol S., Cotton W. D., Cohen A. S., van Bemmel I. M., Röttgering H. J. A., 2009, \aap, 501, 1185
- Johnston-Hollitt, Hunstead & Corbett (2008) Johnston-Hollitt M., Hunstead R. W., Corbett E., 2008, \aap, 479, 1
- Kale et al. (2015) Kale R. et al., 2015, \aap, 579, A92
- Kale et al. (2013) Kale R., Venturi T., Giacintucci S., Dallacasa D., Cassano R., Brunetti G., Macario G., Athreya R., 2013, \aap, 557, A99
- Kuntz & Snowden (2008) Kuntz K. D., Snowden S. L., 2008, \aap, 478, 575
- Lane et al. (2014) Lane W. M., Cotton W. D., van Velzen S., Clarke T. E., Kassim N. E., Helmboldt J. F., Lazio T. J. W., Cohen A. S., 2014, \mnras, 440, 327
- Loubser et al. (2016) Loubser S. I., Babul A., Hoekstra H., Mahdavi A., Donahue M., Bildfell C., Voit G. M., 2016, \mnras, 456, 1565
- Mahdavi et al. (2013) Mahdavi A., Hoekstra H., Babul A., Bildfell C., Jeltema T., Henry J. P., 2013, \apj, 767, 116
- Maughan et al. (2008) Maughan B. J., Jones C., Forman W., Van Speybroeck L., 2008, \apjs, 174, 117
- Mazzotta & Giacintucci (2008) Mazzotta P., Giacintucci S., 2008, \apjl, 675, L9
- McDonald et al. (2013) McDonald M. et al., 2013, \apj, 774, 23
- McMullin et al. (2007) McMullin J. P., Waters B., Schiebel D., Young W., Golap K., 2007, in Astronomical Society of the Pacific Conference Series, Vol. 376, Astronomical Data Analysis Software and Systems XVI, Shaw R. A., Hill F., Bell D. J., eds., p. 127
- Miniati (2014) Miniati F., 2014, \apj, 782, 21
- Mittal et al. (2009) Mittal R., Hudson D. S., Reiprich T. H., Clarke T., 2009, \aap, 501, 835
- Motl et al. (2005) Motl P. M., Hallman E. J., Burns J. O., Norman M. L., 2005, \apjl, 623, L63
- Owers, Couch & Nulsen (2009) Owers M. S., Couch W. J., Nulsen P. E. J., 2009, \apj, 693, 901
- Pacaud et al. (2016) Pacaud F. et al., 2016, \aap, 592, A2
- Pacaud et al. (2006) Pacaud F. et al., 2006, \mnras, 372, 578
- Planck Collaboration (2011) Planck Collaboration, 2011, \aap, 536, A8
- Planck Collaboration et al. (2014) Planck Collaboration et al., 2014, \aap, 571, A29
- Poole et al. (2008) Poole G. B., Babul A., McCarthy I. G., Sanderson A. J. R., Fardal M. A., 2008, \mnras, 391, 1163
- Poole et al. (2006) Poole G. B., Fardal M. A., Babul A., McCarthy I. G., Quinn T., Wadsley J., 2006, \mnras, 373, 881
- Rengelink et al. (1997) Rengelink R. B., Tang Y., de Bruyn A. G., Miley G. K., Bremer M. N., Roettgering H. J. A., Bremer M. A. R., 1997, \aaps, 124
- Scaife & Heald (2012) Scaife A. M. M., Heald G. H., 2012, \mnras, 423, L30
- Shakouri, Johnston-Hollitt & Dehghan (2016) Shakouri S., Johnston-Hollitt M., Dehghan S., 2016, \mnras, 458, 3083
- Sommer & Basu (2014) Sommer M. W., Basu K., 2014, \mnras, 437, 2163
- Sonkamble et al. (2015) Sonkamble S. S., Vagshette N. D., Pawar P. K., Patil M. K., 2015, \apss, 359, 21
- Struble & Rood (1999) Struble M. F., Rood H. J., 1999, \apjs, 125, 35
- Venkata (2010) Venkata U. R., 2010, PhD thesis, New Mexico Institute of Mining and Technology
- Venturi et al. (2008) Venturi T., Giacintucci S., Dallacasa D., Cassano R., Brunetti G., Bardelli S., Setti G., 2008, \aap, 484, 327
- Vikhlinin et al. (2005) Vikhlinin A., Markevitch M., Murray S. S., Jones C., Forman W., Van Speybroeck L., 2005, \apj, 628, 655
- Weißmann et al. (2013) Weißmann A., Böhringer H., Šuhada R., Ameglio S., 2013, \aap, 549, A19
- Zandanel, Pfrommer & Prada (2014) Zandanel F., Pfrommer C., Prada F., 2014, \mnras, 438, 124
- Zhang et al. (2011) Zhang Y.-Y., Andernach H., Caretta C. A., Reiprich T. H., Böhringer H., Puchwein E., Sijacki D., Girardi M., 2011, \aap, 526, A105
- ZuHone et al. (2013) ZuHone J. A., Markevitch M., Brunetti G., Giacintucci S., 2013, \apj, 762, 78