The Mass-Discrepancy Acceleration Relation: A Natural Outcome of Galaxy Formation in Cold Dark Matter Halos
Abstract
We analyze the total and baryonic acceleration profiles of a set of well-resolved galaxies identified in the eagle suite of hydrodynamic simulations. Our runs start from the same initial conditions but adopt different prescriptions for unresolved stellar and AGN feedback, resulting in diverse populations of galaxies by the present day. Some of them reproduce observed galaxy scaling relations, while others do not. However, regardless of the feedback implementation, all of our galaxies follow closely a simple relationship between the total and baryonic acceleration profiles, consistent with recent observations of rotationally supported galaxies. The relation has small scatter: different feedback implementations – which produce different galaxy populations – mainly shift galaxies along the relation, rather than perpendicular to it. Furthermore, galaxies exhibit a characteristic acceleration, , above which baryons dominate the mass budget, as observed. These observations, consistent with simple modified Newtonian dynamics, can be accommodated within the standard cold dark matter paradigm.
In the cold dark matter (CDM) cosmological model structures form hierarchically through merging and smooth accretion (e.g., Wang et al., 2011). The resulting “dark matter (DM) halos” trap gas which cools and forms stars, providing visible tracers of the underlying DM density field White and Rees (1978); White and Frenk (1991). Understanding the connection between galaxies and their halos is therefore of fundamental importance to galaxy formation models.
Galaxy formation occurs over a broad range of scales, which hampers theoretical progress. Even the most sophisticated numerical simulations available are unable to resolve all relevant scales simultaneously, and must resort to “sub-grid” models that account for unresolved physical process, such as feedback from stars and black holes (e.g., Guedes et al., 2011; Vogelsberger et al., 2014; Schaye et al., 2015; Grand et al., 2017). Sub-grid models are ubiquitous in areas of science that probe multi-scale phenomena. They are essential ingredients in, for example, climate or atmospheric models, and simulations of turbulent flows.
Traditionally the link between galaxies and halos has been expressed in terms of scaling relations between their structural properties; the Tully-Fisher (Tully and Fisher, 1977, TF) and Faber-Jackson Faber and Jackson (1976) relations, in particular, relate the luminosity (or stellar mass) of a galaxy to its dynamics which, in CDM, is largely governed by its DM halo. Galaxy formation models based on CDM do not reproduce these relations unless sub-grid models for unresolved feedback are calibrated to form realistic galaxies when judged according to other diagnostics (e.g., Lacey et al., 2016; Ferrero et al., 2017). It comes as a surprise, then, that observations reveal an even closer coupling between the luminous mass of galaxies and their total dynamical mass. Perhaps most unexpected is the “mass discrepancy-acceleration relation” (MDAR) McGaugh (2004); Janz et al. (2016); Lelli et al. (2017), a tight empirical relation between the radial dependence of the enclosed baryonic-to-dynamical mass ratio and the baryonic acceleration. It has small intrinsic scatter and holds for galaxies of widely varying luminosity and gas fraction. The MDAR may be expressed empirically as McGaugh et al. (2016)
| (1) |
where and are, respectively, the acceleration and enclosed mass profiles.
It has been claimed (see Milgrom, 2016, and discussion therein) that the small scatter in the MDAR is inconsistent with hierarchical galaxy formation models, in which galaxies exhibit a broad range of properties even for halos of fixed mass. Furthermore, the MDAR implies a characteristic acceleration () above which each galaxy’s dynamics can be determined by the observed light alone.
Why would baryons and dark matter “conspire” to produce a characteristic physical scale? One possibility is that galaxies adhere to modified Newtonian dynamics (although see Kaplinghat and Turner (2002); Navarro et al. (2016) for an explanation within the CDM framework). However, theoretical studies suggest that the MDAR arises naturally in CDM models of galaxy formation, provided they also match observed galaxy scaling relations van den Bosch and Dalcanton (2000); Di Cintio and Lelli (2016); Santos-Santos et al. (2016); Keller and Wadsley (2017); Desmond (2017). In this letter we address these issues using a suite of simulations drawn from the eagle Project Schaye et al. (2015). Our simulations vary the subgrid feedback in a way that modifies the end product of galaxy formation, enabling us to robustly assess the MDAR for a range of galaxy formation “models”.
The eagle Simulations.— Our analysis focuses on halos and their central galaxies identified in a subset of the “intermediate resolution” eagle simulations Schaye et al. (2015); Crain et al. (2015). These include periodic volumes of side-length and comoving Mpc sampled with, respectively, and particles of gas and DM. The respective particle masses are and ; the (Plummer-equivalent) softening length is physical kpc below , and 2.66 comoving kpc at higher redshift. Each volume was also carried out using only DM, with and . In all runs, DM particles were assigned unique integer IDs; we use the same IDs for particles in runs that start from the same ICs. DM halos can then be matched across different simulations by identifying halos with common DM particles. Cosmological parameters are those inferred by the Planck Collaboration Planck Collaboration et al. (2014).
The simulations were performed with a version of the N-body hydrodynamics code gadget3 Springel (2005) incorporating a modified hydrodynamic scheme, time-stepping criteria and subgrid physics modules (see Schaye et al., 2015, for details). Runs of a given boxsize start from the same initial conditions but adopt different values of the subgrid parameters. As a result, some accurately reproduce a diverse set of observations of the galaxy population (such as the stellar mass function, galaxy shapes and their relationship to stellar mass), whereas others do not.
As discussed by Schaye et al. (2015), calibration of the subgrid parameters must be carried out so that simulations reproduce a diagnostic set of observational data. For eagle, this was achieved by calibrating the feedback models (including contributions from both active galactic nuclei, AGN, and stars) so that the observed galaxy stellar mass function and the mass-size relation were recovered. One such model is the “reference” model (hereafter REF; Schaye et al. (2015)). Variations of REF systematically changing the subgrid parameters were also carried out Crain et al. (2015). These include runs with weak (WeakFB) or strong (StrongFB) stellar feedback, one with no AGN feedback (NoAGN), and another with only AGN feedback but none from stars (OnlyAGN). The resulting galaxy properties depend sensitively on these feedback choices.
Analysis: Halo Finding and Selection.— We use subfind Springel et al. (2001); Dolag et al. (2009) to identify DM halos and their central galaxies (see Schaye et al. (2015) for details). The position of the halo particle with the minimum potential energy defines the halo and galaxy center. The halo’s virial mass, , is defined as that enclosed by a sphere of mean density surrounding each halo center, where is the critical density. This implicitly defines the virial radius through . We focus our analysis on central galaxies whose DM halos are resolved with at least particles. We impose no isolation or relaxation criteria.
We also include isolated galaxies (that lie beyond from any halo with , but within 3 Mpc from their barycenter) identified in the level-1 apostle simulations (see Sawala et al. (2016); Fattahi et al. (2016) for details of the apostle Project), which used the eagle subgrid model with REF parameters. In total, our galaxies span the (stellar) mass range .
Radial Mass profiles of Baryons and Dark Matter.— The acceleration profile due to component is computed as
| (2) |
where and are the corresponding circular velocity and enclosed mass profiles, and is Newton’s constant. We compute using logarithmically-spaced radial bins with fixed separation, , spanning (the minimum resolved spatial scale) to (this aperture encloses, on average, 95% of a galaxy’s stellar mass; we have verified that our results are robust to reasonable changes in ).
For each galaxy we also record a few diagnostic quantities. Its stellar mass, , is defined as the total mass of stars gravitationally bound to the central galaxy; the stellar half-mass radius, , is defined by .
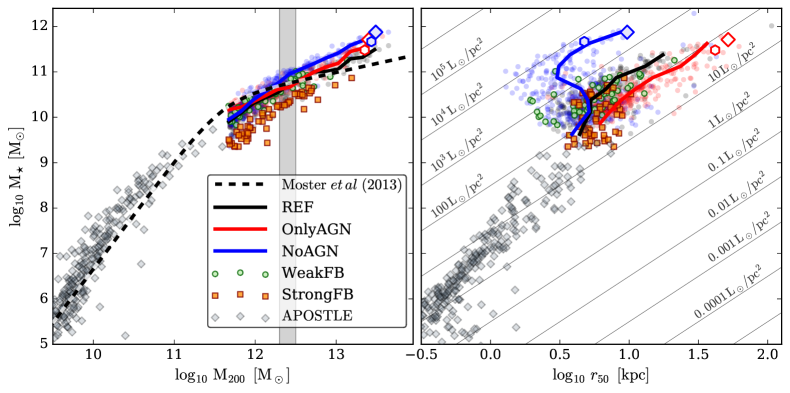
Results.— The leftmost panel of Figure 1 plots galaxy stellar mass versus halo virial mass. Solid lines show the median trends for the 50 Mpc cubes (REF, NoAGN and OnlyAGN). Individual galaxies are shown as faint circles of corresponding color. Additional runs with strong and weak stellar feedback are also shown, along with apostle galaxies (in these cases only individual halos are plotted). The dashed line shows the relation inferred from abundance matching on data by Moster et al. (2013). The right-hand panel shows, using the same color scheme, the stellar mass versus half (stellar) mass radius. The diagonals indicate lines of constant surface brightness.
Different subgrid models produce different galaxy populations. For a given halo mass the median galaxy stellar mass spans a factor of between the extremes (compare NoAGN and StrongFB in the left-most panel). Galaxy sizes also differ, particularly for the runs without (NoAGN) and with only (OnlyAGN) AGN feedback. For , for example, galaxy half-mass radii are roughly an order of magnitude smaller when AGN feedback is ignored.
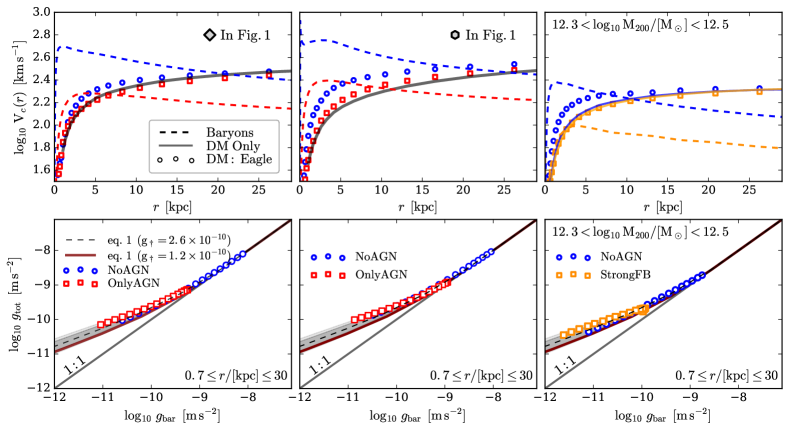
Figure 2 (upper panels) provides a few examples of the circular velocity profiles of baryons (dashed curves) and dark matter (open symbols) for several eagle galaxies. The left and middle panels show two massive galaxies that were cross-matched in the NoAGN and OnlyAGN runs (highlighted as outsized points in Figure 1). Because they inhabit the same halo their merger histories are similar, but their stellar masses, and sizes differ noticeably as a result of differing feedback processes. Each galaxy’s DM distribution reflects its response to galaxy formation: the more massive the central galaxy, the more concentrated its DM halo. The effect is, however, weak. The dark grey line in each panel shows, for comparison, the circular velocity curve of the same halo in the corresponding DM-only simulation.
The resulting rotation curves show a clear transition from baryon to dark matter dominated regimes, suggesting that careful calibration of subgrid models is needed to produce galaxies with realistic mass profiles. Despite these structural differences, all four galaxies nevertheless follow closely the same relation between the total acceleration and the acceleration due to baryons (lower panels). Galaxies in the NoAGN run, which are more massive and more compact than those in OnlyAGN, populate the high acceleration regime of the relation, indicating that they are baryon dominated over a larger radial extent. When included, AGN feedback periodically quenches star formation resulting in less compact and lower mass central galaxies that are DM dominated over a large radial range.
The right-hand panels of Figure 2 show another example. Here we select all halos from NoAGN and StrongFB whose masses lie in the range (vertical shaded band in the left panel of Figure 1) and plot their median circular velocity and acceleration profiles. These galaxies have stellar masses that differ, on average, by a factor of depending on the feedback implementation, but inhabit halos of comparable DM mass. As before, solid curves show the median dark matter mass profile for the same halos identified in the corresponding DM-only simulation; open symbols show measured directly in the eagle runs. The suppression of star formation by strong feedback results in considerably less massive galaxies that are dark matter dominated at most resolved radii. Nevertheless, both sets of galaxies follow the acceleration relation given by eq. 1.
In all cases, different feedback models produce galaxies that move along the MDAR rather than perpendicular to it, resulting in small scatter. It is easy to see why. Consider an arbitrary galactic radius at which the total and baryonic accelerations are related by eq. 1. Changing the enclosed baryon mass within this radius by a factor shifts points horizontally to , but also vertically to . As a result, galaxies of different stellar mass or size that inhabit similar halos tend to move diagonally in the space of versus . The shaded regions in the lower panels of Figure 2 indicate the scatter expected for enclosed baryon masses that differ from eq. 1 (with ) by factors of (light shaded region) and (darker region).
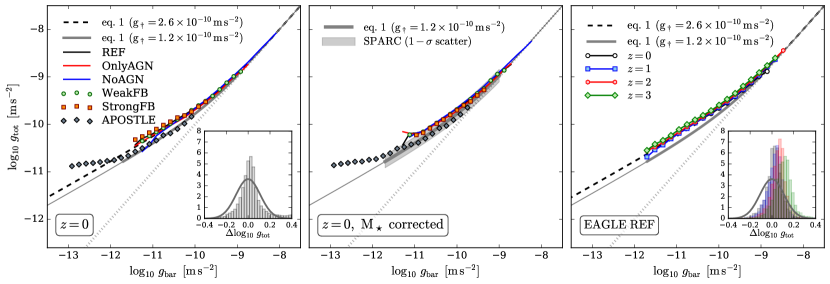
Figure 3 (left) shows the total versus baryonic acceleration for all () galaxies in all simulations. For each run we show the average trends either as solid lines (REF, OnlyAGN and NoAGN) or heavy symbols (WeakFB, StrongFB and apostle). The dashed line describes the numerical data remarkably well, even for models whose subgrid physics were not tuned to match observational constraints. The inset panel plots the residual scatter around this line. Despite the wide range of galaxy properties it is smaller ( dex; see also Keller and Wadsley (2017)) than that of the best available observational data ( dex), indicated by the solid line McGaugh et al. (2016).
Note too that the acceleration relation persists at high redshift, where galaxies are more likely to be actively merging. The right-hand panel of Figure 3 shows the acceleration relation for galaxy progenitors in our REF model at four higher redshifts. Regardless of , the mean relations are very similar. The residuals are also small (inset panel), but show evidence of a slight but systematic redshift dependence.
Eq. 1 describes all simulations remarkably well, provided (dashed line). This is a factor of 2.2 larger than that obtained by McGaugh et al. (2016) from observations of rotationally supported galaxies. This discrepancy reflects the fact that, regardless of subgrid parameters, eagle systematically underpredicts the stellar content of halos near the knee of the relation, where halos are most abundant. As a result, baryonic accelerations, at fixed , are smaller than observed. The middle panel of Figure 3 shows the average MDAR for all simulations after rescaling all galaxy masses to match the derived from abundance matching Moster et al. (2013). All runs are now consistent with the observed relation to within the observational scatter (shown as a thick grey line and shaded region).
Discussion and Summary.— We analyzed a suite of simulations from the eagle Project that adopt widely varying subgrid parameters. Some simulations yield populations of galaxies that differ systematically from observed galaxy scaling relations. Nevertheless, all galaxies follow a simple relationship between their total and baryonic acceleration profiles, regardless of the feedback implementation. Different feedback prescriptions, which result in different galaxy populations, cause galaxies to move along the MDAR rather than perpendicular to it, yielding small scatter.
We note, however, that the total to baryonic acceleration relation depends slightly but systematically on the subgrid model. For example, the StrongFB and NoAGN models are, at low acceleration, noticeably different: the former lies slightly above the best-fitting eq. 1, the latter slightly below. The differences however are small and within the observational scatter. The radial acceleration relation given by eq. 1 is, therefore, very forgiving: only large departures from any sensible galaxy-halo scaling relations lead to noticeable systematics. The “small” observed scatter in the MDAR is, in fact, quite large, and is unlikely to provide useful constraints on sub-grid models for galaxy formation.
We thank Lydia Heck and Peter Draper, whose technical support and expertise made this project possible, and our referees for useful reports. ADL is supported by a COFUND Junior Research Fellowship; RAC is a Royal Society University Research Fellow. JS acknowledges support from the Netherlands Organisation for Scientific Research (NWO), through VICI grant 639.043.409, and the European Research Council under the European Union’s Seventh Framework Programme (FP7/2007- 2013) / ERC Grant agreement 278594-GasAroundGalaxies. This work was supported by the Science and Technology Facilities Council (grant number ST/F001166/1); European Research Council (grant numbers GA 267291 “Cosmiway”). Computing resources were supplied bt the DiRAC Data Centric system at Durham University, operated by the Institute for Computational Cosmology on behalf of the STFC DiRAC HPC Facility (www.dirac.ac.uk). This equipment was funded by BIS National E-infrastructure capital grant ST/K00042X/1, STFC capital grant ST/H008519/1, and STFC DiRAC Operations grant ST/K003267/1 and Durham University. DiRAC is part of the National E-Infrastructure. We also acknowledge PRACE for granting us access to the Curie machine based in France at TGCC, CEA, Bruyères-le-Châtel.
References
- Wang et al. (2011) J. Wang, J. F. Navarro, C. S. Frenk, S. D. M. White, V. Springel, A. Jenkins, A. Helmi, A. Ludlow, and M. Vogelsberger, MNRAS 413, 1373 (2011), arXiv:1008.5114 [astro-ph.CO] .
- White and Rees (1978) S. D. M. White and M. J. Rees, MNRAS 183, 341 (1978).
- White and Frenk (1991) S. D. M. White and C. S. Frenk, Astrophys. J. 379, 52 (1991).
- Guedes et al. (2011) J. Guedes, S. Callegari, P. Madau, and L. Mayer, Astrophys. J. 742, 76 (2011), arXiv:1103.6030 .
- Vogelsberger et al. (2014) M. Vogelsberger, S. Genel, V. Springel, P. Torrey, D. Sijacki, D. Xu, G. Snyder, D. Nelson, and L. Hernquist, MNRAS 444, 1518 (2014), arXiv:1405.2921 .
- Schaye et al. (2015) J. Schaye, R. A. Crain, R. G. Bower, M. Furlong, M. Schaller, T. Theuns, C. Dalla Vecchia, C. S. Frenk, I. G. McCarthy, J. C. Helly, A. Jenkins, Y. M. Rosas-Guevara, S. D. M. White, M. Baes, C. M. Booth, P. Camps, J. F. Navarro, Y. Qu, A. Rahmati, T. Sawala, P. A. Thomas, and J. Trayford, MNRAS 446, 521 (2015), arXiv:1407.7040 .
- Grand et al. (2017) R. J. J. Grand, F. A. Gómez, F. Marinacci, R. Pakmor, V. Springel, D. J. R. Campbell, C. S. Frenk, A. Jenkins, and S. D. M. White, MNRAS (2017), 10.1093/mnras/stx071, arXiv:1610.01159 .
- Tully and Fisher (1977) R. B. Tully and J. R. Fisher, A&A 54, 661 (1977).
- Faber and Jackson (1976) S. M. Faber and R. E. Jackson, Astrophys. J. 204, 668 (1976).
- Lacey et al. (2016) C. G. Lacey, C. M. Baugh, C. S. Frenk, A. J. Benson, R. G. Bower, S. Cole, V. Gonzalez-Perez, J. C. Helly, C. D. P. Lagos, and P. D. Mitchell, MNRAS 462, 3854 (2016), arXiv:1509.08473 .
- Ferrero et al. (2017) I. Ferrero, J. F. Navarro, M. G. Abadi, L. V. Sales, R. G. Bower, R. A. Crain, C. S. Frenk, M. Schaller, J. Schaye, and T. Theuns, MNRAS 464, 4736 (2017), arXiv:1607.03100 .
- McGaugh (2004) S. S. McGaugh, Astrophys. J. 609, 652 (2004), astro-ph/0403610 .
- Janz et al. (2016) J. Janz, M. Cappellari, A. J. Romanowsky, L. Ciotti, A. Alabi, and D. A. Forbes, MNRAS 461, 2367 (2016), arXiv:1606.05003 .
- Lelli et al. (2017) F. Lelli, S. S. McGaugh, J. M. Schombert, and M. S. Pawlowski, Astrophys. J. 836, 152 (2017), arXiv:1610.08981 .
- McGaugh et al. (2016) S. S. McGaugh, F. Lelli, and J. M. Schombert, Physical Review Letters 117, 201101 (2016), arXiv:1609.05917 .
- Moster et al. (2013) B. P. Moster, T. Naab, and S. D. M. White, MNRAS 428, 3121 (2013), arXiv:1205.5807 .
- Milgrom (2016) M. Milgrom, ArXiv e-prints (2016), arXiv:1609.06642 .
- Kaplinghat and Turner (2002) M. Kaplinghat and M. Turner, ApJL 569, L19 (2002), astro-ph/0107284 .
- Navarro et al. (2016) J. F. Navarro, A. Benítez-Llambay, A. Fattahi, C. S. Frenk, A. D. Ludlow, K. A. Oman, M. Schaller, and T. Theuns, ArXiv e-prints (2016), arXiv:1612.06329 .
- van den Bosch and Dalcanton (2000) F. C. van den Bosch and J. J. Dalcanton, Astrophys. J. 534, 146 (2000), astro-ph/9912004 .
- Di Cintio and Lelli (2016) A. Di Cintio and F. Lelli, MNRAS 456, L127 (2016), arXiv:1511.06616 .
- Santos-Santos et al. (2016) I. M. Santos-Santos, C. B. Brook, G. Stinson, A. Di Cintio, J. Wadsley, R. Domínguez-Tenreiro, S. Gottlöber, and G. Yepes, MNRAS 455, 476 (2016), arXiv:1510.02474 .
- Keller and Wadsley (2017) B. W. Keller and J. W. Wadsley, ApJL 835, L17 (2017), arXiv:1610.06183 .
- Desmond (2017) H. Desmond, MNRAS 464, 4160 (2017), arXiv:1607.01800 .
- Crain et al. (2015) R. A. Crain, J. Schaye, R. G. Bower, M. Furlong, M. Schaller, T. Theuns, C. Dalla Vecchia, C. S. Frenk, I. G. McCarthy, J. C. Helly, A. Jenkins, Y. M. Rosas-Guevara, S. D. M. White, and J. W. Trayford, MNRAS 450, 1937 (2015), arXiv:1501.01311 .
- Planck Collaboration et al. (2014) Planck Collaboration, P. A. R. Ade, N. Aghanim, C. Armitage-Caplan, M. Arnaud, M. Ashdown, F. Atrio-Barandela, J. Aumont, C. Baccigalupi, A. J. Banday, and et al., A&A 571, A16 (2014), arXiv:1303.5076 .
- Springel (2005) V. Springel, MNRAS 364, 1105 (2005), astro-ph/0505010 .
- Springel et al. (2001) V. Springel, S. D. M. White, G. Tormen, and G. Kauffmann, MNRAS 328, 726 (2001), astro-ph/0012055 .
- Dolag et al. (2009) K. Dolag, S. Borgani, G. Murante, and V. Springel, MNRAS 399, 497 (2009), arXiv:0808.3401 .
- Sawala et al. (2016) T. Sawala, C. S. Frenk, A. Fattahi, J. F. Navarro, R. G. Bower, R. A. Crain, C. Dalla Vecchia, M. Furlong, J. C. Helly, A. Jenkins, K. A. Oman, M. Schaller, J. Schaye, T. Theuns, J. Trayford, and S. D. M. White, MNRAS 457, 1931 (2016), arXiv:1511.01098 .
- Fattahi et al. (2016) A. Fattahi, J. F. Navarro, T. Sawala, C. S. Frenk, K. A. Oman, R. A. Crain, M. Furlong, M. Schaller, J. Schaye, T. Theuns, and A. Jenkins, MNRAS 457, 844 (2016), arXiv:1507.03643 .