Superconductivity and multiple pressure-induced phases in BaPt2As2
Abstract
The newly discovered BaPt2As2 shows a structural distortion at around 275 K, followed by the emergence of superconductivity at lower temperatures. Here we identify the presence of charge density wave (CDW) order at room temperature and ambient pressure using single crystal x-ray diffraction, with both a superlattice and an incommensurate modulation, where there is a change of the superlattice structure below 275 K. Upon applying pressure, BaPt2As2 shows a rich temperature-pressure phase diagram with multiple pressure-induced transitions at high temperatures, the emergence or disappearance of which are correlated with sudden changes in the superconducting transition temperature . These findings demonstrate that BaPt2As2 is a promising new system for studying competing interactions and the relationship between high-temperature electronic instabilities and superconductivity.
pacs:
71.45.Lr,74.70.Xa,74.25.Dw,74.62.FjI Introduction
The presence of competing interactions and multiple electronic instabilities often leads to emergent phenomena and new phases. In particular, the complex relationship between superconductivity and magnetic or charge order has attracted considerable interest. In many of the high temperature iron pnictide superconductors, the superconductivity occurs in the vicinity of spin-density-wave (SDW) order IronRev ; IronRev2 . Meanwhile upon applying pressure to the heavy fermion superconductor CeCu2Si2 CCSA , evidence was found for superconductivity being in close proximity to multiple instabilities, with one superconducting dome in the vicinity of magnetic order and another near a possible valence instability CCS1998 ; CCSB ; CCSC . The interplay between charge-density-wave (CDW) order and superconductivity has also been of particular interest recently CDWsum1 ; CDW+SC2 , mainly due to the coexistence of these competing phases in some systems, with a similar phase diagram to systems with SDW and superconductivity CuTiSe , as well as the observation of CDW in the high temperature cuprate superconductors. In the cuprates, the role of CDW order in the formation of superconductivity remains a central and open issue cupratesa ; cupratesb ; cupratesc ; cuprates1 ; cuprates2 ; cuprates3 , but the microscopic relationship is still unresolved.
Structural distortions have also been found to occur in various iron based superconductors Ba122SC . For instance, upon lowering the temperature of electron doped BaFe2As2, the symmetry of the crystal lattice is reduced from the four-fold symmetry of the ThCr2Si2 structure, to a two fold symmetric orthorhombic structure, while SDW ordering onsets at lower temperatures Ba122edop ; Ba122edop2 . There is an increasing body of evidence that this distortion does not arise due to phonons Ba122nophon , but is from an electronic instablity, the nematic order, which may be driven by either spin or orbital/charge fluctuations IronSCNemRev . The suppression of both the nematicity and SDW ordering in the region of the superconducting dome, again indicates the importance of understanding the relationship between the various ordered phases and underlying interactions. On the other hand, there also exist some non-iron based 122 pnictide superconductors (Ba or Sr, transition metal and pnictogen) which undergo structural distortions upon cooling BaNiAs ; SrPtSb ; SPA SC . A comparison with the iron based materials may provide crucial insights into the roles of various interactions and the resulting collective phenomena.
Unlike the 122 iron pnictide superconductors which crystallize in the ThCr2Si2 structure (), SrPt2As2 forms in the CaBe2Ge2-type structure () at high temperatures. Both are layered tetragonal structures but they have different stacking of the layers of transition metal and As atoms along the axis. A further difference from the iron pnictides is that in the Pt based materials, spin fluctuations are not generally expected to play a significant role. Below = 470 K, the crystal structure of SrPt2As2 undergoes an orthorhombic distortion and CDW ordering Struc old ; SPA R ; SPA TEM ; SPA NMR , with a superconducting transition at a lower temperature of 5.2 KSPA SC . Similarly in the newly discovered BaPt2As2 with a resistive transition at = 1.67 K BPAJWB , a first order phase transition appears at about 275 K, at which a structural phase transition from the tetragonal CaBe2Ge2-type structure to an orthorhombic structure was found using powder x-ray diffraction (XRD) BPAJWB . In this article, we demonstrate using single crystal XRD measurements that a CDW state already exists at room temperature in BaPt2As2 and the structural transition at K corresponds to a change in the CDW superlattice. To study the relationship between superconductivity and the CDW state, we performed resistivity measurements under pressure, which reveal a rich temperature-pressure phase diagram with multiple pressure-induced transitions, the emergence of which are correlated with sudden changes in .
II Experimental Methods
Single crystals of BaPt2As2 were synthesised using a self-flux method described in Ref BPAJWB, . Resistivity measurements under pressure were carried out using a piston-cylinder-type pressure cell up to 27 kbar, and Daphne 7373 was used as the pressure transmitting medium, to ensure hydrostaticity. The applied pressure was determined by the shift in of a high quality Pb single crystal. Measurements were performed using a Physical Property Measurement System (Quantum Design PPMS-14T) in the temperature range of 2 K to 300 K, while measurements from 0.3 K to 5 K were performed using a 3He refrigerator. Single-crystal XRD from room temperature to 100 K was carried out on a STOE IPDS II diffractometer at the Argonne National Laboratory, using an Mo source ( Å). Reciprocal space reconstruction of the single crystal XRD data was performed with the software X-Area.
III Results
III.1 Single crystal x-ray diffraction
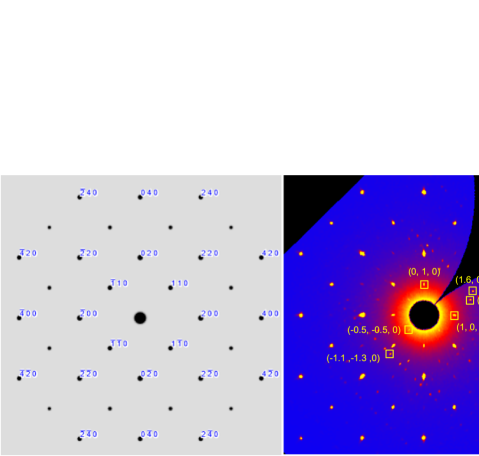
A simulation of the diffraction peaks in the () plane for the tetragonal CaBe2Ge2-type structure () is shown in Fig.1(a), while the reciprocal space reconstruction of single crystal XRD data at 300 K and 100 K are shown in Figs.1 (b) and (c) respectively. Reflections are labeled with the Miller indices of the CaBe2Ge2-type structure ().
In the previous powder XRD measurements BPAJWB , we reported a structural phase transition at 275 K from a tetragonal CaBe2Ge2-type structure to an orthorhombic one. Based on the current single crystal XRD results, it should be noted that neither the reflections at 300 K nor 100 K could be satisfactorily indexed with a perfect CaBe2Ge2-type crystal structure. From comparing the experimental data at both 300 K and 100 K with the simulated reflections, we observe a number of additional peaks arising from complex CDW modulations. If we index the single crystal XRD data by introducing an orthorhombic distortion, the lattice parameters at 300 K are Å, Å and Å, while at 100 K, Å, Å and Å. These results indicate that even at room temperature, the CDW modulations induce a small difference in and , which becomes larger below 280 K. Subsequent analysis of the data at 300 K reveals peaks corresponding to 222 superlattice structure, where the unit cell is doubled in all directions, along with an incommensurate modulation . Reflections which are forbidden for the CaBe2Ge2-type structure such as and and the half fractional peaks such as arise from the 222 superlattice structure while the peaks at the position of around the superlattice peaks arise from the incommensurate modulation. A comparison of the data from 300 K to 285 K shows no change in the structure of BaPt2As2. From 280 K to 100 K, BaPt2As2 enters a new phase in which the symmetry further lowers to a 662 superlattice structure while the incommensurate modulation remains the same, as indicated by the appearance of new fractional peaks such as and . Therefore these results demonstrate that the CDW state is already present at room temperature, but there is a change in CDW structure below 280 K, along with an increased orthorhombic distortion.
III.2 Resistivity under pressure
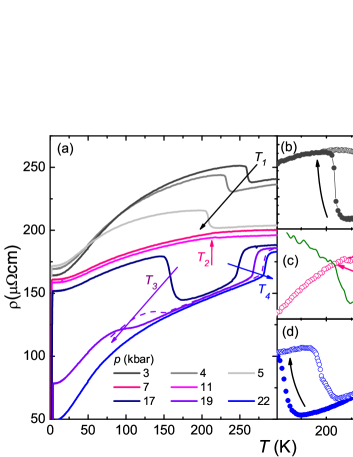
The temperature-pressure phase diagram of BaPt2As2 was determined by measuring the resistivity under pressure. As shown in Fig. 2(a), at kbar, there is a sudden increase of the resistivity upon cooling at about K, which is similar to the previously reported results at ambient pressureBPAJWB and corresponds to a change of the CDW structure. With increasing pressure, the temperature of this transition decreases, before abruptly disappearing above kbar. After disappears, a new transition labelled as is observed, where there is only a small anomaly in the resistivity and little change with increasing pressure. For pressures greater than kbar, disappears and two new transitions emerge at and , with the former corresponding to an increase of the resistivity upon cooling while the latter shows a sudden decrease. These transitions have a different pressure dependence with the lower transition being rapidly suppressed with increasing pressure, while increases with pressure. Note that apart from , all the transitions display pronounced hysteresis, as shown in Figs.2(b)-(d), indicating a first-order nature. It can also be seen that there is an increase in resistivity at and while it drops at .
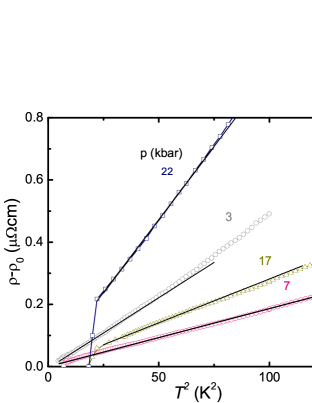
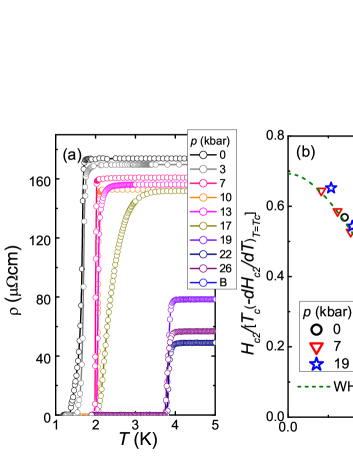
Figure 3(a) displays the resistivity under pressure at low temperatures, in the vicinity of the superconducting transitions. At ambient pressure, is about 1.6 K, determined from where the resistivity reaches of the normal state value cm, similar to that previously reportedBPAJWB . With increasing pressure, the superconducting transition sharpens and undergoes a moderate enhancement at around 7 kbar which is close to , to around 2 K, along with a small decrease of . Further increasing the pressure up to 13 kbar results in little change of . However, upon applying pressures greater than 13 kbar, there is another jump in which is larger in size, reaching a near constant value above 17 kbar. The superconducting transition at 17 kbar is significantly broader than that at both lower and higher pressures, which may be due to a pressure inhomogeneity, leading to the coexistence of both superconducting phases. The newly emerged superconducting phase has the highest 3.8 K, the lowest residual resistivity in the normal state, and changes little with pressure up to 26 kbar. The upper critical field at different pressures is shown in Fig. 3(b). The values of were measured in three regions of the temperature-pressure phase diagram (0, 7 and 19 kbar), and were normalized by the product of and the derivative of near . When the normalized is plotted as a function of , all the data falls on one curve, in good agreement with the orbital limited values of calculated using the Werthamer-Helfand-Hohenberg (WHH) model shown by the dashed line WHH3 . This suggests that there is no change of the superconducting pairing state under pressure and that orbital limiting rather than Pauli limiting is the dominant pair breaking mechanism. Meanwhile as displayed in Fig. 4, the low temperature normal state resistivity could be well fitted with Fermi liquid behavior, .
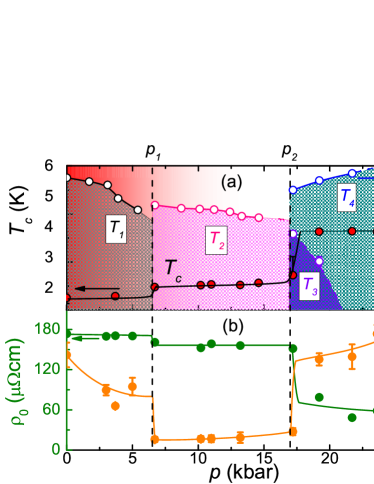
Figure 5(a) displays the temperature-pressure phase diagram obtained from resistivity measurements. Two abrupt enhancements of occur under pressure, both of which clearly coincide with changes in the high temperature phase transitions. At 7 kbar, the CDW transition at disappears and a new transition is observed. This change is accompanied by an enhancement of . Upon further increasing the applied pressure, there is little change of up to kbar, where the transition at is no longer observed and two new phase transitions emerge. The transition at decreases with increasing pressure before being suppressed at less than 22 kbar, while increases with pressure, reaching 290 K at 24 kbar. The appearance of these transitions is accompanied by another pronounced enhancement of by almost a factor of two. The critical pressure for the emergence of and is slighty lower than that corresponding to the jump in . This may be due to the variation in the pressure transmitted by the Daphne 7373 medium with temperature, which can cause a pressure increase of around 1-2 kbar between 300 K and low temperatures DaphRef . Furthermore, the results from fitting the resistivity in the normal state are shown in Fig. 5(b). Each step like increase of coincides with a drop in , with a small decrease at the disappearance of and a larger drop at the emergence of and . Meanwhile the resistivity coefficient undergoes a sharp drop at followed by a sudden increase at . Furthermore, neither or display any noticeable anomaly upon the disappearance of the transition at .
IV Discussion and summary
The above results demonstrate an intricate relationship between the superconductivity and the high temperature transitions in BaPt2As2. The nature of the transitions at , and are yet to be uncovered. In comparison, SrPt2As2 undergoes a structural phase transition below K, from a tetragonal to orthorhombic structure Struc old , with two incommensurate CDW modulations emerging SPA R ; SPA TEM . However, in BaPt2As2 at ambient pressure the orthorhombic distortion and CDW modulation already exist above and this transition corresponds to a change of the periodicity of the superlattice. Furthermore, there is a sudden increase in the resistivity at as in the case of the structural transition in SrNi2P2 SrNiP , whereas there is a drop in the resistivity at in SrPt2As2. However, the behaviour of BaPt2As2 above 22 kbar more strongly resembles that of SrPt2As2, since we observe a drop in the resistivity at and there is a comparable value of .
If then the transition under pressure at is similar to that of SrPt2As2 at ambient pressure, the differences in the CDW modulation and high temperature crystal structures may explain the different behavior of the resistivity seen at and . This suggests the possibility that the CDW state below disappears at , above which only a weak anomaly at is observed. Furthermore, it is not clear whether the CDW state observed at ambient pressure and room temperature persists upon the application of pressure and it may be that the transition at lies beneath a CDW transition at higher temperatures. At a different CDW state may emerge. However, while CDW states generally compete with superconductivity, in this instance the emergence of the transition at leads to a significant enhancement of , rather than a decrease. The dramatic change in both and the coefficient at suggests this may correspond to a sudden change in the electronic structure and Fermi surface topology. Such changes may lead to an enhanced density of states, which in turn may cause the significant increase of and .
The transition at , which appears under up to around 19 kbar, may then correspond to a further lowering of the crystal symmetry or a change in the modulation vector q of the CDW state. A change of q can lead to different behavior of the resistivity since this changes the reconstructed Fermi surface, with the CDW gap opening across different regions. However for these scenarios, it would be unusual that there is little change in upon the disappearance of . As previously discussed, at ambient pressure there is a structural distortion at corresponding to a significantly increased orthorhombicity. Since both and have a similar first order nature, whether these transitions correspond to changes in either the crystal symmetry or structural parameters needs to be checked with XRD measurements under pressure. All these results suggest the presence of both structural and electronic instabilities in the temperature-pressure phase diagram. In light of the recent evidence that the nematic order in the iron pnictide based superconductors is driven by electronic rather than structural instabilities IronSCNemRev , it will be of interest to determine whether any of the transitions or structural changes in BaPt2As2 also have an electronic origin. The relationship between the high temperature transitions and the superconductivity also needs to be further investigated and compared to both the cuprate and iron based materials, but the significantly lower values of may be a result of the lack of a spin fluctuation mediated pairing mechanism.
In conclusion, using single crystal XRD measurements we have identified that a CDW state exists in BaPt2As2 in ambient conditions, and that the transition at K corresponds to a change of the superlattice structure. The application of pressure results in a rich phase diagram. Pressure suppresses the CDW transition at until it disappears at around = 7 kbar, which leads to an enhancement of . Upon further increasing the pressure, new high temperature transitions are observed in the resistivity, which are correlated with an additional increase of . Since these results indicate the presence of multiple instabilities at high temperatures, BaPt2As2 may provide a platform for studying the competition between different interactions and their interplay with superconductivity. Further experiments such as NMR and XRD under pressure, as well as theoretical calculations are needed to characterize the origin of these transitions and elucidate the mechanisms which lead to these exotic behaviors.
Acknowledgements.
We thank C. Cao for interesting discussions. The work at Zhejiang University was supported by the National Natural Science Foundation of China (No.11474251 and No.11374257), National Key R&D Program of the MOST of China (No. 2016YFA0300202) and the Science Challenge Program of China. The work at Argonne was supported by the Office of Science, Office of Basic Energy Sciences, Division of Materials Sciences, US Department of Energy, under contract DE-AC02-06CH11357 (BES-DMSE).References
- (1) J. Paglione and R. L. Greene, High-temperature superconductivity in iron-based materials. Nat. Phys. 6, 645-658 (2010).
- (2) X. H. Chen, P. C. Dai, D. L. Feng, T. Xiang and F. -C. Zhang, Iron-based high transition temperature superconductors. Natl. Sci. Rev. 1, 371-395 (2014).
- (3) F. Steglich, J. Aarts, C. D. Bredl, W. Lieke, D. Meschede, W. Franz, and H. Schäfer, Superconductivity in the Presence of Strong Pauli Paramagnetism: Ce. Phys. Rev. Lett. 43, 1892-1896 (1979).
- (4) P. Gegenwart, C. Langhammer, C. Geibel, R. Helfrich, M. Lang, G. Sparn, F. Steglich, R. Horn, L. Donnevert, A. Link, and W. Assmus, Breakup of Heavy Fermions on the Brink of “Phase A” in CeCu2Si2. Phys. Rev. Lett. 81, 1501 (1998).
- (5) H. Q. Yuan, F. M. Grosche, M. Deppe, C. Geibel, G. Sparn, and F. Steglich, Observation of two distinct superconducting phases in Ce. Science 302, 2104-2107 (2003).
- (6) A. T. Holmes, D.Jaccard and K. Miyake, Signatures of valence fluctuations in CeCu2Si2 under high pressure, Phys. Rev. B 69, 024508 (2004).
- (7) For a review, see A. M. Gabovich, A. I. Voitenko, and M. Ausloos, Charge- and spin-density waves in existing superconductors: competition between Cooper pairing and Peierls or excitonic instabilities, Phys. Rep. 367, 583 (2002).
- (8) M. Hoesch et al., Splitting in the Fermi surface of ZrTe3: A surface charge density wave system. Phys. Rev. B 80, 075423 (2009).
- (9) E. Morosan et al., Superconductivity in CuxTiSe2, Nat. Phys. 2, 544 (2006).
- (10) J. M. Tranquada et al., Evidence for stripe correlations of spins and holes in copper oxide superconductors, Nature 375, 561-563 (1995).
- (11) T. Wu et al., Magnetic-field-induced charge-stripe order in the high-temperature superconductor YBa2Cu3Oy, Nature 477, 191-194 (2011).
- (12) G. Ghiringhelli et al., Long-Range Incommensurate Charge Fluctuations in (Y,Nd)Ba2Cu3O6+x, Science 337, 821-825 (2012)
- (13) R. Comin et al., Symmetry of charge order in cuprates, Nature Materials 14, 796-800 (2015).
- (14) Y. X. Wang et al., Enhancement of superconductivity at the onset of charge-density-wave order in a metal, Phys. Rev. B 92, 125108 (2015).
- (15) H. Freire et al., Renormalization group analysis of the pair-density-wave and charge order within the fermionic hot-spot model for cuprate superconductors. Phys. Rev. B 92, 045132 (2015).
- (16) M. Rotter, M. Tegel, and D. Johrendt, Superconductivity at 38 K in the Iron Arsenide (Ba1−xKx)Fe2As2. Phys. Rev. Lett 101, 107006 (2008).
- (17) M. Yi et al., Symmetry-breaking orbital anisotropy observed for detwinned Ba(Fe1−xCox)2As2 above the spin density wave transition, Proc. Natl. Acad. Sci. USA 108, 6878-6883 (2011).
- (18) M. G. Kim et al., Character of the structural and magnetic phase transitions in the parent and electron-doped BaFe2As2 compounds, Phys. Rev. B 83, 134522 (2011).
- (19) J-H. Chu et al., Divergent Nematic Susceptibility in an Iron Arsenide Superconductor, Science 337, 710 (2012).
- (20) R. M. Fernandes, A. V. Chubukov and J. Schmalian, What drives nematic order in iron-based superconductors?, Nature Phys. 10, 97-104 (2014).
- (21) F. Ronning, N. Kurita, E. D. Bauer, B. L. Scott, T. Park, T. Klimczuk, R. Movshovich, and J. D. Thompson, The first order phase transition and superconductivity in BaNi2As2 single crystals. J. Phys.: Condens. Matter 20, 342203 (2008).
- (22) K. Kudo et al., Coexistence of Superconductivity and Charge Density Wave in SrPt2As2. J. Phys. Soc. Jpn 79, 123710 (2010).
- (23) M. Imai et al., Superconductivity in 122 antimonide SrPt2Sb2 Supercond. Sci. Technol. 26, 075001 (2013).
- (24) A. F. Fanget al., Single-crystal growth and optical conductivity of SrPt2As2 superconductors, Phys. Rev. B 85, 184520 (2012).
- (25) A. Imre et al., Modulated crystal structures and phase transitions - The compounds SrPt2A and EuPt2As2. Z. Anorg. Allg. Chem. 633, 2037 (2007).
- (26) W. Li et al., Two-coupled structural modulations in charge-density-wave state of SrPt2As2 superconductor, Chin. Phys. B 23, 086103 (2014).
- (27) S. Kawasaki et al., Coexistence of multiple charge-density waves and superconductivity in SrPt2A revealed by 75As-NMR/NQR and 195Pt-NMR, Phys. Rev. B 91, 060510(R) (2015).
- (28) W. B. Jiang et al., Superconductivity and structural distortion in BaPt2As2, J. Phys.: Condens. Matter 27, 022202 (2015).
- (29) N . R.Werthamer, E. Helfand, and P. C. Hohenberg, Temperature and Purity Dependence of the Superconducting Critical Field, . III. Electron Spin and Spin-Orbit Effects, Phys. Rev. 147, 295 (1965).
- (30) K. Murata, H. Yoshino, H. O. Yadav, Y. Honda, and N. Shirakawa, Pt resistor thermometry and pressure calibration in a clamped pressure cell with the medium, Daphne 7373, Rev. Sci. Instrum. 68, 2490 (1997).
- (31) F. Ronning, E. D. Bauer, T. Park, S.-H. Baek, H. Sakai, and J. D. Thompson, Superconductivity and the effects of pressure and structure in single-crystalline SrNi2P2, Phys. Rev. B 79, 134507 (2009).