1]P.N. Lebedev Institute, Leninsky prospect 53, 117924 Moscow, Russia
shaul@sci.lebedev.ru
EAS data at the mountain level and a shape of the CR spectrum beyond the break.
Abstract
In the most works which deal with EAS the CR energy spectrum is deduced by means of the model defined dependence . An electron total number is evaluated by integration of the NKG-function f(r). This algorithm breaks down for young EAS with age parameter . This work shows, that part of the young EAS becomes large in the range , it cause to divergency of the integral for them and distorts the shape of EAS (CR) spectrum. A final analysis of the experimental data permits to conclude that EAS spectrum has local maximum at , which results in a decrease of the EAS spectrum slope for (inverse break or “knee”). A local maximum can arise because of the additional CR component in the range PeV.
1 Introduction
A total electron number spectrum is analyzed for EAS (extensive air showers), detected at Tien Shan altitude (685 g/cm2) in experiment “Hadron” (Abdrashitov et al.,, 1986). The range under study involves EAS spectra break at and the main aim of this work is to investigate the spectrum shape beyond the break.
A peculiarity in EAS spectrum is often named as “knee”, implying that an inverse changing of EAS spectrum slope is observed beyond the break. A value of this changing is differ in the dissimilar experiments, i.e. depends of the detecting level, installation design, in particular the kind of detectors and them separation, and methods of estimation.
It will be shown that a peculiarity vary in shape to comparison with one, received in (Nesterova et al.,, 1995), if dependence of the EAS age parameter s is taken into account. A considerable increase of the young EAS part with a small s can decreases the EAS intensity for a large , that cause to maximum formation in EAS spectrum at .
2 Experimental results and methodic.
The total electron number as usual is determined by integral:
| (1) |
where r is a distance from EAS axis and
| (2) |
is NKG (Nishimura-Kamata-Greysen) functions, - Molier radius and a normalized coefficient
| (3) |
LDF (lateral distribution function) is defined by the follow expression:
| (4) |
In a frame of this approximation the values of the individual NKG-function are determined by an estimation of the parameter (LDF slope) and a normalization to a sum of the experimental densities in the scintillator detectors.
An algorithm for estimation cited above is true for EAS with s-parameter or more, but it breaks down at , as in that case and an integral in Eq. (1) is diverged. A pole in isn’t a physical one and to get rid of the divergency one must introduce a cut-off for the in area close to . is defined by the numerical integration in that case (Shaulov,, 1996). A cut-off radius is selected of order m.
As usual EAS part with is negligible but it increases with in particular beyond the break for (Cherdyntceva et al.,, 1999).
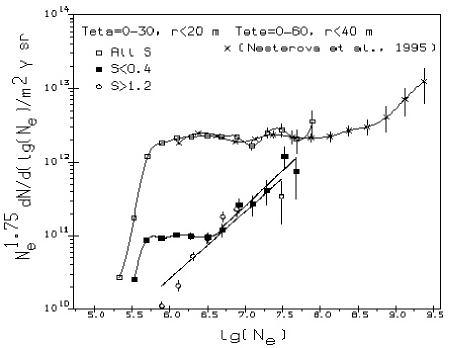
An all EAS spectrum is compared with one’s for the most young EAS with and the most old with . The spectra are multiplied by , At the left of Figure everything spectra are limited by the EAS detecting threshold.
A s-parameter distribution is changed above the break, as EAS part with increases from for up to for . At the same range the part of old EAS is increased too and it is worthy to empathize that them part for small is negligible. The last circumstance explaines an increase of the s-parameter average value for (Cherdyntceva et al.,, 1999).
A EAS spectrum from (Nesterova et al.,, 1995) is shown in Fig. 1 too. It was received with much more EAS statistic by means of increase the selection radius from m up to m and range zenith angles up to . Attention is drawn to the fact that an EAS intensity increase for may be connected with young EAS to a large degree.
NKG cut-off in range m for EAS with decreases the average value and changes the spectrum shape. The resulting CR energy spectrum is shown in Fig. 2 in comparison with AGASA one (Takeda et al.,, 1998). A conversion from to energy was made in response to quasi-scaling model (Erlykin,, 1986) by means of expression PeV.
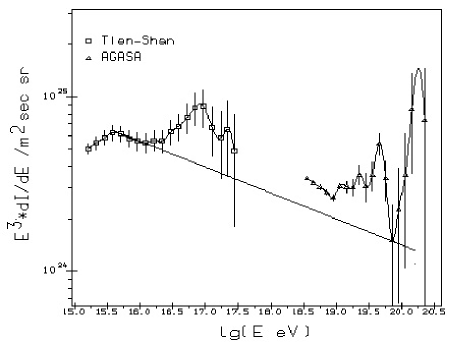
NKG limitation near the EAS axis decreases and causes to maximum formation at energy eV. In addition the intensities of the two spectra (Tien Shan and AGASA) were brought into coincidence in the intermediate area. Furthermore a resemblance between these parts of CR spectra in the ranges eV and eV can discussed.
3 Discussion
A true reconstruction of the original shape for CR spectrum is of the utmost significance for the “knee” interpretation. Initially the “knee” model was based on two assumptions: i) a break in the CR nuclear spectra occurs at a value of the magnetic rigidity PV, ii) protons are the dominant CR component () up to energies in few PeV. A very simple “knee” explanation results in this case. A break in CR spectrum is connected with one in protons component and “knee” is formed by more heavier nuclei.
This model breaks down if the experimental results, which were received in succeeding years, are taken into account.
The direct measurements (Grigorov et al.,, 1970; Burnett et al.,, 1983, 1995) have shown that protons part isn’t exceed even at energies in hundreds TeV and continues to decrease up to the break in accordance with EAS data (Chatelet et al.,, 1991). It was confirmed by investigation of the spectrum for EAS with families in experiment “Hadron”, in which a small value of the magnetic rigidity for break in nuclear spectra was received PV (Shaulov,, 1999).
A model with break for PV only can’t be true, because it gives too heavy CR composition for high energies. It seams that a situation is saved by another experiment “Hadron” result about arising of the additional component in CR, consisting mainly from protons, beyond the CR spectrum break (Shaulov,, 2001). The data of this work about EAS spectrum shape agree well with such conclusion.
It means that transformed “knee” model consists from break in nuclear spectra for the magnetic rigidity PV and a contribution of the additional CR component in the radiation for energies PeV.
The absence of this maximum or them more small value in CR spectrum ( eV) for the measurements at sea level may be explained by the large separation between detectors in the installation with large square, that can cause to the loss of the most young EAS, or the difference of this component absorption in the atmosphere in comparison with nuclei one’s.
Acknowledgements.
I am thanks all experiment “Hadron” participants, which heavy-duty operation permits to receive these experimental data.References
- Abdrashitov et al., (1986) Abdrashitov S. F. et al., Installation “Hadron” for an investigation of the primary CR and characteristics of the nuclear interactions in the atmosphere by EAS, EC and Cherencov light methods, Izv. AN USSR, ser. fiz., 1986, v. 50, N11, p. 2203-2207
- Nesterova et al., (1995) Nesterova N.M., Chubenko A.P., Djatlov P.A. , Vildanova L.I., The primary cosmic ray spectrum at eV and its peculiarity above eV according to Tien-Shan data, in Proc. 24th ICRC, Roma, Italy, v. 2 (1995) 748
- Shaulov, (1996) Shaulov S. B., A method of the EAS characteristics determination in the EAS associated with families and scaling violation, Preprint FIAN N60, Moscow, 1996, p. 3-37 \balance/
- Cherdyntceva et al., (1999) Cherdyntceva K. V., Chubenko A. P., Nesterova N. M., Pavluchenko V. P., Shaulov S. B., A changing of the -family and EAS in range , Preprint FIAN N7, 1999, 3-15
- Takeda et al., (1998) Takeda M., Hayashida N., Honda K. et al., Extension of the cosmic-ray energy spectrum beyond the predicted Greizen-Zatsepin-Kuz’min cutoff, Phys. Rev. Letters, vol. 81, N6, 1998, pp. 1163-1166
- Erlykin, (1986) Erlykin A. D., A many-dimensional analysis of the hadron cascades in atmosphere for nuclear and astrophysical CR investigations, Doctor diss., FIAN, Moscow, 1986
- Grigorov et al., (1970) Grigorov N. L., Nesterov V. E., Rapoport I. D. et al., Investigation of the PCR high and superhigh energy spectrum at cosmic stations “Proton”, Nuclear Physics, 1970, II, N5, p. 1058-1069
- Burnett et al., (1983) Burnett T.H., Dake S., Fuki M. et al., Proton and Helium energy spectra above 1 TeV for primary cosmic rays, Phys. Rev. Lett.,51, N11 (1983) 1010-1013;
- Burnett et al., (1995) JACEE collaboration, Energy spectra and elemental composition of nuclei above 100 TeV from a series of the JACEE balloon flight, in Proc. 24th ICRC, Roma, Italy, v.2, 1995, p. 707
- Chatelet et al., (1991) Chatelet E., Danilova T.V., Erlykin A.D., Pavluchenko V.P., Procureur J., Re-analysis of the primary mass composition in the “knee region” on the basis of the Tien-Shan data and the independent-nucleon model of A-A interactions, J.Phys. G:Nucl. Part. Phys., 17(1991)1427-1439
- Shaulov, (1999) Shaulov S. B., CR composition in area of “knee” and a contribution of the single, close source, Preprint FIAN N8, Moscow 1999
- Shaulov, (2001) Shaulov S. B., Experimental evidences of two component model for CR composition around the “knee”, this conference, 2001