Thermodynamic Anomaly Above the Superconducting Critical Temperature in the Quasi One-Dimensional Superconductor Ta4Pd3Te16
Abstract
We study the intrinsic transport anisotropy and fermiology of the quasi one-dimensional superconductor Ta4Pd3Te16. Below K we detect a thermodynamic phase transition that predominantly affects the conductivity perpendicular to the quasi one-dimensional chains, consistent with a thermodynamic transition related to the presence of charge order that precedes superconductivity. Remarkably the Fermi surface pockets detected by de Haas-van Alphen (dHvA) oscillations are unaffected by this transition, suggesting that the ordered state does not break any translational symmetries but rather alters the scattering of the quasiparticles themselves.
pacs:
74.70.-b,74.25.Jb, 71.18.+y, 74.25.BtI Introduction
Superconducting materials with extreme anisotropies in their electronic normal state behavior are of immense interest for studying the relationship between dimensionality, broken symmetry, and unconventional mechanisms of superconductivity. For example, both cuprate and iron-pnictide superconductors are proximal to magnetic and possibly “nematic” orders Hinkov_2008 ; Fernandes_2014 . In the case of the cuprates, the recent discovery of charge density order has ignited debate as to whether such thermodynamic phases are competing, causal, or benignly coincident with superconductivity Wu2011 ; Christensen2016 ; badoux2016 . This ground-state electronic competition is particularly important in quasi-one dimensional (q1D) systems Peierls1930 ; Pouget2016 , which often show charge order and also exhibit unconventional superconductivity. Recently, the q1D ternary superconductor Ta4Pd3Te16 (TPT) has been suggested to be proximal to quantum ordered states and a possible host for unconventional superconductivity pan_nodal_2014 ; jiao_superconductivity_2014 ; du_anisotropic_2015 .
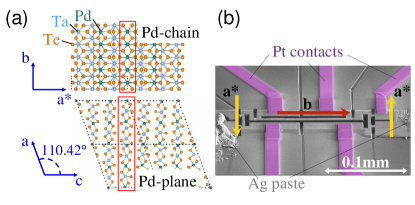
TPT is a layered material with a monoclinic crystal structure mar_synthesis_1991 . The high-conductivity direction coincides with the axis, parallel to the PdTe2-chains lying within flat layers separated by TaTe3 chains and Ta2Te4 double chains (see Fig 1a). Well-studied q1D systems like the organic TMTSF-PF6 Dressel2007 or purple bronze Li0.9Mo6O17 Wakeham2011 possess complex phase diagrams with evidences of a spin or charge density wave instability Pouget2016 . However, despite several recent studies, TPT has not shown unambiguous evidence of an instability competing with its SC phase. This may be because TPT is significantly more isotropic: although direct resistivity measurements have been unavailable until this study, measurements of the upper critical field have given indirect evidence that the electronic anisotropy in this compound is relatively weak pan_nodal_2014 ; jiao_superconductivity_2014 . Recent density functional theory (DFT) calculations predict that the system is multi-band in nature singh_multiband_2014 , showing a combination of q2D, 3D and several q1D bands at the Fermi level that could account for earlier evidence of unconventional behavior in the thermal conductivity and heat capacity pan_nodal_2014 ; jiao_superconductivity_2014 . Aside from superconductivity, no other bulk properties show clear thermodynamic evidence for an additional order parameter, raising the possibility that there may not be any other broken symmetry proximal to superconductivity. It is therefore important to determine the underlying Fermi surface as well as the intrinsic electronic anisotropy in order to understand the apparent absence of other ordered states in the case of TPT.
In this work we report the existence of a thermodynamic transition above the superconducting critical temperature (), indicative of a nearby phase instability in TPT. By employing torque magnetometry and magnetotransport, we observed de Haas-van Alphen (dHvA) oscillations that confirm the multi-band nature of TPT’s bulk Fermi surface. Using focused ion beam (FIB) microstructuring, we fabricated devices enabling measurements of the resistivity along the inter-chain () and interlayer () directions (see Fig. 1a). Remarkably, the anomaly is only pronounced in the transport channel perpendicular to the chains setting in at K, but is quite subtle in all other directions. Finally, there is no change in the dHvA frequency observed across , suggesting that the Fermi surface experiences no reconstruction at this temperature. We discuss possible explanations for the observed anomaly and its relationship to superconductivity, and in particular whether marks the onset of charge density wave (CDW) fluctuations or a thermodynamic phase transition corresponding to an incommensurate-to-commensurate CDW lattice lock-in.
II Experimental and Calculational Methods
Single crystals of TPT were grown using a self-flux with excess tellurium at temperatures as high as ∘C, similar to the method reported by Jiao et al. jiao_superconductivity_2014 . High-resolution single-crystal X-ray diffraction was performed at the Advanced Light Source (ALS) at Lawrence Berkeley National Laboratory that confirmed the quality of the crystals and their orientation. Hence, contributions from impurity phases to the magnetic quantum oscillation data presented in the following can be ruled out.
Electrical transport devices were prepared by FIB etching and in situ deposition of platinum or gold contacts onto thin flakes of TPT, cleaved from the as-grown needle-like crystals. Sample sizes were a few micrometers in thickness and a couple of hundred micrometers in length. Low-ohmic contacts with contact resistances on the order of were achieved. A device that has been microstructured to measure -axis and -axis conductivity is shown in Fig. 1b.
Magnetic torque and magnetotransport experiments were performed in fields up to T at the National High-Magnetic Field Laboratory (NHMFL) in Tallahassee, Florida. Both piezoresistive microcantilevers from SEIKO and capacitive cantilevers built by NHMFL were used as torque magnetometers. Further torque and magnetotransport measurements were performed in a Cryogenic Limited T cryogen free magnet system.
Fully-relativistic first-principles calculations were performed using Density Functional Theory (DFT) under the local density approximation (LDA) perdew1981 and implemented using the Quantum Espresso software giannozzi2009 . Starting from the experimental crystal lattice parameters, all internal atomic positions were allowed to relax until interatomic forces were less than meVÅ. High-resolution Fermi surface data were obtained by non-self-consistent calculations on a -point grid in the first Brillouin zone and were plotted using XCrySDen Kokalj1999 . The dHvA simulation curves were calculated using the Supercell K-space Extremal Area Finder (SKEAF) code rourke2012 .
III Magnetotransport and Magnetic Susceptibility
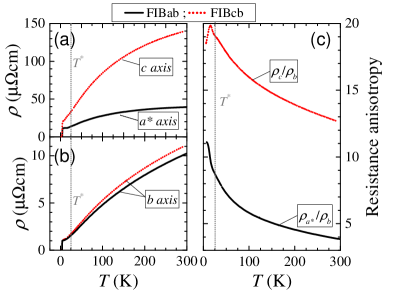
Figures 2a and 2b show the resistivity, measured with an applied current along the three crystallographic directions, as a direct measure of the transport anisotropy. We microstructured two devices: one made to measure the and directions simultaneously, denoted FIBab (shown in Fig. 1b), and the other measuring the and crystallographic directions simultaneously, denoted FIBcb. Note that FIBab and FIBcb, which are cut from crystals belonging to the same batch, have highly reproducible -axis resistivity , indicating homogeneity within the batch. The resistivity anisotropy grows monotonically as the temperature is lowered: at room temperature the resistivity ratios , while at low temperature (just above K), , as shown in Fig. 2c. Due to possible mixing between different conduction channels, these ratios are lower bounds of the intrinsic resistivity anisotropies. Evidently, the system becomes much more conductive along the -axis than along any other axis, suggesting that scattering becomes significantly suppressed along the chains. We find that both the temperature dependence of both and of show shallow kinks at K followed by peaks above .
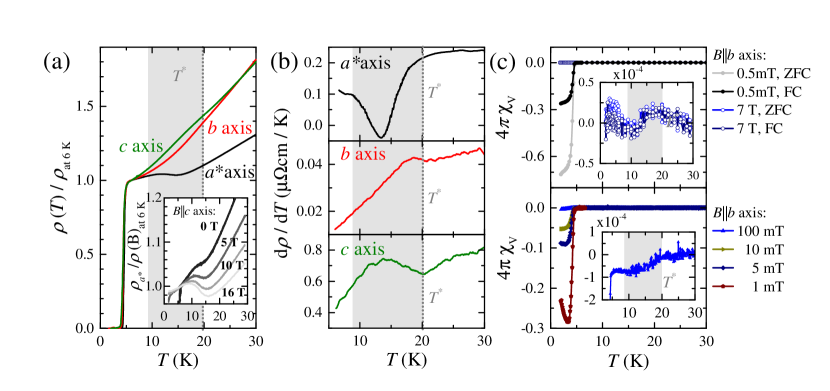
As can be seen in Fig. 3a, which shows the resistivity normalized to the K value for all three channels, this peak is related to a resistivity anomaly which is most pronounced in . In contrast, the data for and show very weak features in this region. On taking the derivative (), shown in Fig. 3, we see that all crystallographic directions exhibit an anomaly within a few Kelvin of . The grey shaded area in Fig. 3 highlights the temperature range, K within which we observe deviations from normal metallic behavior. For the -direction we find a clear minimum at K but a broad onset starting slightly above . Along the -direction we find a weak change in slope accompanied by a peak slightly below . Similarly, a peak develops for below with its maximum at K. Given that the conductivity along is over ten times greater than that along at these temperatures (see Fig. 2c) it seems unlikely that this feature is exclusively due to mixing of with ; rather, it is intrinsic, albeit weak enough to have been overlooked in previous measurements. We find that the anomaly is independent of the substrate (either sapphire or silicon), sample thickness (ranging from m to 1 m) and attachment method (either glue or van der Waals attraction). We can therefore rule out any substrate strain effects as a cause of the observed features.
The derivatives and are strongly linear at , consistent with the onset of Fermi liquid-like behavior, which may be a precursor to the onset of superconductivity at K. Interestingly, the temperature at which the anomaly occurs is weakly sensitive to the application of magnetic field (inset Fig. 3a), suggesting that it is strongly pinned electronically, or that it is related to the softening of a phonon mode. However, the magnetoresistance is much larger below the anomaly than above, suggesting the carriers are significantly more mobile at . A similar response is observed in the unconventional superconductor BaFe2As2, where a strong scattering channel is gapped out at the Néel transition, strongly enhancing the mobility of the itinerant carriers rotter2008 .
We studied the magnetic volume susceptibility of TPT around for a few dozen co-aligned single crystals with an average width of about m, thickness of m and length of mm, pointing with their directions parallel to the field. In Fig. 3c we show data measured at various magnetic fields, exhibiting strong diamagnetism setting in at the superconducting critical temperature K, with a transition width of about K. The inset of Fig. 3c shows a zoom into the data recorded at a fields of and T. Below K there is a broad anomaly, manifested as a reduction in the magnetic susceptibility, followed by a subtle paramagnetic increase, before the superconducting transition sets in. Such a paramagnetic enhancement is a prominent feature known, for example from cuprate superconductors due to the onset of fluctuations in the vicinity of related to low dimensionality or granularityWohlleben1991 . We also observed a similar decrease of for a separated single crystal (see insert in the lower panel of Fig. 3c).
In the simplest model, the strong reduction above the superconducting transition can be attributed to a decrease in the electronic density of states or, equivalently, a decrease in the electronic effective mass (note that this is consistent with the enhanced mobility we observe). The consistency between transport and susceptibility data is strong evidence that the anomaly is a true thermodynamic transition, indicative of a substantial change in the electronic properties of the system.
IV Magnetic Quantum oscillations and DFT band structure
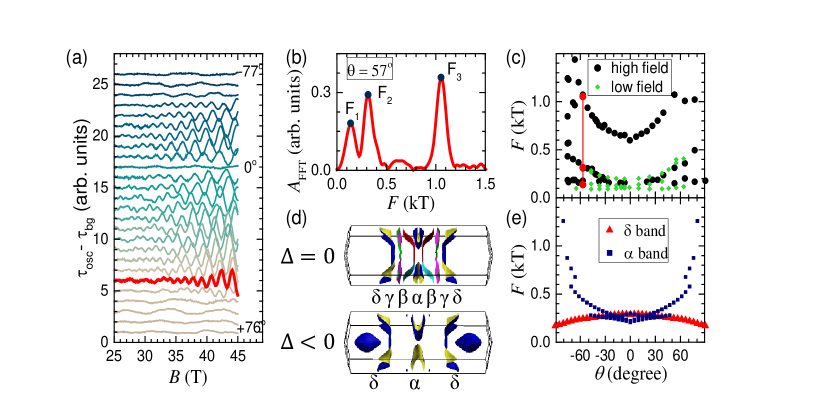
In order to better understand the low-temperature ground state, we study the Fermi surface by measuring magnetic quantum oscillations in high-purity crystals. Background-subtracted de Haas-van Alphen (dHvA) oscillations, recorded in a DC magnetic field at K, are shown in Fig. 4a. Multiple frequencies superimposed on a quadratic-in-field magnetic background torque, are observed. Fast Fourier transforms (FFTs) of the data for each angle ( defined to have the applied magnetic field, , parallel to the -axis) as shown in Fig. 4b for , provide access to the angle dependence of the various frequencies. In Fig. 4c we show the angle dependence of the major frequency peaks for two separate experiments: in low fields, T (green diamonds), and in fields between T (black circles). In the high-field data at least three distinct frequencies are discernible, labeled , , and . However, only and were discernible in fields below T. We therefore screened three different growth batches and only observed contributions from and .
As the field orientation is tilted away from , the smallest frequency stays relatively unaffected, indicative of a three-dimensional (3D) Fermi surface. At T the oscillation period for a frequency of about T can be estimated to T precision. Therefore, for a field window of T at most four maxima can be observed, reducing the reliability of FFT analysis for such low frequencies. By contrast, and trace a trajectory that tracks the perpendicular component of field , indicative of a quasi-two-dimensional (q2D) Fermi surface pocket. was only clearly visible in the high magnetic field data; it appeared close to the background noise level for the lowest temperatures in the experiments below T. We reproduced the oscillation spectra for various samples by application of two distinct measurement techniques: capacitive and piezoresistive torque magnetometry. The clear presence of q2D and 3D Fermi surface components can explain the relatively weak anisotropic character of TPT’s transport behavior compared to other q1D materials.
TPT’s Fermi surface predicted by DFT calculations is shown in Fig. 4d. It consists of four distinct bands: a cylindrical band centered around the point, and three q1D bands labeled , , and , respectively. The band shows a strong effect on the position of the chemical potential . By only minor changes in , equivalent to doping holes, this Fermi surface sheet acquires a more complex appearance exhibiting a three-dimensional extension along the direction in the Brillouin zone.
In Fig. 4e we show for comparison the results of DFT calculations for the Fermi surface at zero temperature. With a shift of the chemical potential by meV, our calculations broadly agree with low-frequency oscillations originating from the cylindrical and the 3D-part of the band. However, the higher-frequency oscillation cannot be simultaneously recovered, suggesting that the predicted band structure does not adequately capture the low-temperature ground state. This discrepancy could be evidence for band reconstruction due to density-wave-broken translational symmetry. In addition, it is also possible that is a magnetic breakdown frequency that only appears at high magnetic fields and this is also consistent with a folded Fermi surface at low temperatures.
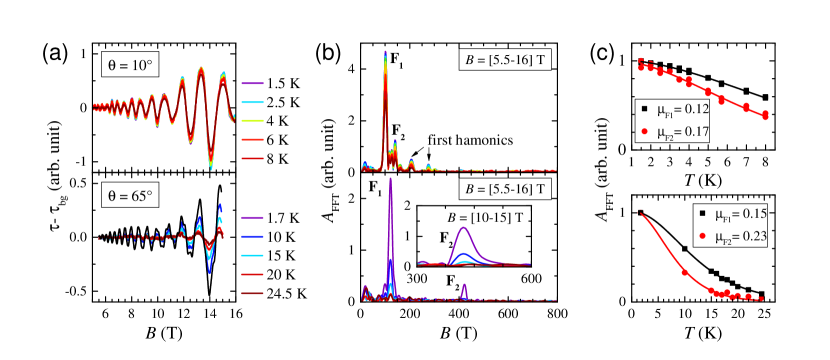
To investigate whether the Fermi surface is affected by the anomaly, we track the dHvA signal to higher temperatures (Fig. 5 lower panels). We are able to resolve clear quantum oscillations in low fields below T. The dHvA oscillation data are presented in Fig. 5a. Though the higher frequency is quickly suppressed with temperature, the 3D pocket at T can be tracked to K (Fig. 5b). We observe no significant changes for this frequency in the FFT spectrum, suggesting that little or no band folding occurs at K. Nevertheless it is possible that this pocket exists at a point in the Brillouin zone that is not reconstructed, this would be difficult to reconcile with our DFT calculations shoenberg_1984 . One scenario, which we discuss below, is that marks an incommensurate-commensurate charge density wave lock-in transition, which requires no additional translational symmetry breaking.
The effective masses of each of the Fermi surface sheets are extracted from fits of the temperature-dependent oscillation amplitude at a constant field orientation to the Lifshitz-Kosevich temperature damping factor , with TK shoenberg_1984 . We find and , with the bare electron mass. The fits are shown in Fig. 5c. The measured and calculated masses are quite similar, suggesting that correlation effects only weakly renormalize the electronic system. The difference between the two values supports the idea that the two Fermi surface sheets are located on different bands.
V Discussion
At present, we cannot conclusively identify the microscopic nature of the thermodynamic anomaly at K. It has long been suspected that owing to its nested Fermi surface, TPT could exhibit a Peierls instability. While low temperature scanning tunneling microscopy measurements appear consistent with this fan_STM_2015 , there have been precious few measurements showing evidence of a transition jiao_superconductivity_2014 ; pan_nodal_2014 ; jiao_multiband_2015 ; chen_raman_2015 ; Li_2016 at , leaving open the interpretation of detected in this study.
On the one hand, it seems unlikely to be purely a CDW transition along the chain direction; the indifference of the quantum oscillation suggests there is no Fermi surface folding across , there is no reported anomaly in heat capacity pan_nodal_2014 , and in any case, the conductivity is enhanced along the chains, whereas one would naively expect it to be strongly suppressed due to the gapping out of the q1D Fermi surface. In the structurally similar rare earth tri-tellurides RTe3 a CDW formation is accompanied by a notably greater conductivity reduction in their inter-chain direction (but this arises from a peculiarity in the Fermi surface geometry that is irrelevant in TPT Monceau12 ; SinchenkoEA15 .) As a test we carried out conductivity calculations at zero temperature, similar to those employed for the RTe3 SinchenkoEA15 , assuming a hypothetical band folding due to a CDW (as reported from STM fan_STM_2015 ). We however find that this single particle model fails to reproduce the observed enhanced effect on the transport channel perpendicular to the chains.
On the other hand, the anomaly may still be related to a Peierls-like Fermi instability, for example it could mark the onset of CDW fluctuations or an incommensurate (ICDW) to commensurate (CCDW) transition. In the former case, such an onset would give a resistivity bump to the direction just as we observe, arising from an enhancement in interchain interactions that lead to repulsion as each chain attempts to order. This is not unprecedented and indeed a similar mechanism as has been observed in the q2D system P4W10O38 SchlenkerEA96 ; NaitoTanaka82 and predicted for NbSe2 FFJvW_NatComms15 ; FFJvW_PRB15 .Despite the fluctuating CDW order being along the -direction chains it would not necessarily give a strong enhancement of the resistivity in this direction. The three-dimensional character of the fluctuations could plausibly have a stronger effect on the inter-chain direction as instantaneous regions of the CDW attempt to order the charge on the neighboring chains. However, this mechanism doesn’t answer the apparent disagreement between the DFT calculations and our observed QOs.
ICDW to CCDW transitions can be driven by an electron-phonon interaction as the ICDW locks into the lattice McMillan76 ; FFJvW_PRL15 , and is known to occur in other compounds including TTF-TCNQ, -TaSe2 and -TaS2 KagoshimaEA76 ; NaitoTanaka82 ; Monceau12 ; FengEA15 . This could account for all our data and was consistent with recent nuclear quadrupole resonance measurements which show a line broadening at , but importantly no new lines (as would be expected for a singular CDW transition). However, this does raise the question of the location of the ICDW transition temperature, which we do not detect. This may be because is higher than the range measured, or sufficiently subtle that we have not been able to detect it. In this case, we suggest that high-resolution x-ray measurements may be able to detect the ICDW, as well as resolve the structural nature of the anomaly.
VI Conclusions
Finally, we point out that there are other possibilities that could be the low temperature ground state (such as a spin-density wave, nematic transition or some other broken symmetry). Nevertheless, we can say with certainty that there is some kind of thermodynamic transition at . Intriguingly, this both cuts off the growth of the transport anisotropy that was growing precipitously until (Fig. 2c), as well as leading to a monotonic dependence before going superconducting (Fig. 3b). It may therefore we inferred that while the thermodynamic nature of may not be directly driving in TPT, it may ‘set the scene’ for conventional superconducting behavior to come about.
VII Acknowledgements
We would like to acknowledge the extremely helpful and efficient collaboration of S. J. Teat and K. J. Gagnon for characterizing and orienting the single crystals at beam line of the Advanced Light Source (ALS) in Berkeley in preparation of the individual experiments. We are grateful for the help of A. Frano in terms of performing measurements of the magnetic susceptibility in a Quantum design SQUID magnetometer in the laboratory of R. J. Birgeneau. We thank K. R. Shirer and M. Baenitz for stimulating discussions. The ALS is supported by the Director, Office of Science, Office of Basic Energy Sciences, of the U. S. Department of Energy under Contract No. DE-AC02-05CH11231. T. H. was supported by the Quantum Materials FWP, U.S. Department of Energy, Office of Basic Energy Sciences, Materials Sciences and Engineering Division, under Contract No. DE-AC02-05CH11231. F. F. acknowledges support from a Lindemann Trust Fellowship of the English Speaking Union. L. B. is supported by DOE-BES through award DE-SC0002613.
References
- [1] V. Hinkov, D. Haug, B. Fauqué, P. Bourges, Y. Sidis, A. Ivanov, C. Bernhard, C. T. Lin, and B. Keimer. Electronic Liquid Crystal State in the High-Temperature Superconductor YBa2Cu3O6.45. Science, 319(5863):597–600, 2008.
- [2] R. M. Fernandes, A. V. Chubukov, and J. Schmalian. What drives nematic order in iron-based superconductors? Nat. Phys., 10:97–104, 2014.
- [3] T. Wu, H. Mayaffre, S. Kramer, M. Horvartic, C. Berthier, W. N. Hardy, R. Liang, D. A. Bonn, and M.-H. Julien. Magnetic-field-induced charge-stripe order in the high-temperature superconductor YBa2Cu3Oy. Nature, 477:191–194, 2011.
- [4] Morten H. Christensen, Henrik Jacobsen, Thomas A. Maier, and Brian M. Andersen. Magnetic fluctuations in pair-density-wave superconductors. Phys. Rev. Lett., 116:167001, Apr 2016.
- [5] S. Badoux, W. Tabis, F. Laliberté, G. Grissonnanche, B. Vignolle, D. Vignolles, J. Béard, D. A. Bonn, W. N. Hardy, R. Liang, N. Doiron-Leyraud, Louis Taillefer, and Cyril Proust. Change of carrier density at the pseudogap critical point of a cuprate superconductor. Nature, 531(7593):210–214, 2016.
- [6] R. Peierls. Zur Theorie der elektrischen und thermischen Leitfähigkeit von Metallen. Ann. Phys., 396(2):121–148, 1930.
- [7] J.-P. Pouget. The Peierls instability and charge density wave in one-dimensional electronic conductors. C. R. Physique, 17(3–4):332 – 356, 2016.
- [8] J. Pan, W. H. Jiao, X. C. Hong, Z. Zhang, L. P. He, P. L. Cai, J. Zhang, G. H. Cao, and S. Y. Li. Nodal superconductivity and superconducting dome in the layered superconductor Ta4Pd3Te16. Phys. Rev. B, 92:180505, Nov 2015.
- [9] W.-H. Jiao, Z.-T. Tang, Y.-L. Sun, Y. Liu, Q. Tao, C.-M. Feng, Y.-W. Zeng, Z.-A. Xu, and G.-H. Cao. Superconductivity in a layered Ta4Pd3Te16 with pdte2 chains. J. Am. Chem. Soc., 136(4):1284–1287, January 2014.
- [10] Z. Du, D. Fang, Z. Wang, Y. Li, G. Du, H. Yang, X. Zhu, and H.-H. Wen. Anisotropic Superconducting Gap and Elongated Vortices with Caroli-De Gennes-Matricon States in the New Superconductor Ta4Pd3Te16. Sci. Rep., 5, 2015.
- [11] A. Mar and J. A. Ibers. Synthesis, crystal structure and electrical conductivity of a new layered ternary telluride Ta4Pd3Te16. J. Chem. Soc., Dalton Trans., S(S):639–641, 1991.
- [12] M. Dressel. Ordering phenomena in quasi-one-dimensional organic conductors. Naturwissenschaften, 94(7):527–541, 2007.
- [13] N. Wakeham, A. F. Bangura, X. Xu, J. F. Mercure, M. Greenblatt, and N. E. Hussey. Gross violation of the wiedemann-franz law in a quasi-one-dimensional conductor. Nat. Comm., 2:396, July 2011.
- [14] D. J. Singh. Multiband superconductivity of Ta4Pd3Te from Te p states. Phys. Rev. B, 90(14):144501, October 2014.
- [15] J. P. Perdew and Alex Zunger. Self-interaction correction to density-functional approximations for many-electron systems. Phys. Rev. B, 23(10):5048–5079, 1981.
- [16] P. Giannozzi, S. Baroni, N. Bonini, M. Calandra, R. Car, C. Cavazzoni, D. Ceresoli, G. L. Chiarotti, M. Cococcioni, I. Dabo, A. D. Corso, S. d. Gironcoli, S. Fabris, G. Fratesi, R. Gebauer, U. Gerstmann, C. Gougoussis, A. Kokalj, M. Lazzeri, L. Martin-Samos, N. Marzari, F. Mauri, R. Mazzarello, S. Paolini, A. Pasquarello, L. Paulatto, C. Sbraccia, S. Scandolo, G. Sclauzero, A. P. Seitsonen, A. Smogunov, P. Umari, and R. M. Wentzcovitch. QUANTUM ESPRESSO: a modular and open-source software project for quantum simulations of materials. J. Phys.: Condens. Matter, 21(39):395502, 2009.
- [17] Anton Kokalj. XCrySDen—a new program for displaying crystalline structures and electron densities. J. Mol. Graph. Mod., 17(3–4):176–179, 1999.
- [18] P. M. C. Rourke and S. R. Julian. Numerical extraction of de Haas–van Alphen frequencies from calculated band energies. Compput. Phys. Commun., 183(2):324–332, 2012.
- [19] M. Rotter, M. Tegel, D. Johrendt, I. Schellenberg, W. Hermes, and R. Pöttgen. Spin-density-wave anomaly at k in the ternary iron arsenide BaFe2As2. Phys. Rev. B, 78(2):020503, 2008.
- [20] D. Wohlleben, M. Esser, P. Freche, E. Zipper, and M. Szopa. Possibility of orbital magnetic phase transitions in mesoscopic metallic rings. Phys. Rev. Lett., 66:3191–3194, Jun 1991.
- [21] D. Shoenberg. Magnetic Oscillations in Metals. Cambridge University Press, 1984. Cambridge Books Online.
- [22] Q. Fan, W. H. Zhang, X. Liu, Y. J. Yan, M. Q. Ren, M. Xia, H. Y. Chen, D: F. Xu, Z. R. Ye, W. H. Jiao, G. H. Cao, B. P. Xie, T. Zhang, and D. L. Feng. Scanning tunneling microscopy study of superconductivity, magnetic vortices, and possible charge-density wave in Ta4Pd3Te16. Phys. Rev. B, 91:104506, 2015.
- [23] W.-H. Jiao, Y. Liu, Y.-K. Li, X.-F. Xu, J.-K. Bao, C.-M. Feng, S. Y. Li, Z.-A. Xu, and G.-H. Cao. Multiband superconductivity in Ta4Pd3Te16 with anisotropic gap structure. J. Phys.: Condens. Matter, 27(32):325701, 2015.
- [24] D. Chen, P. Richard, Z.-D. Song, W.-L. Zhang, S.-F. Wu, W. H. Jiao, Z. Fang, G.-H. Cao, and H. Ding. Raman scattering investigation of the quasi-one-dimensional superconductor Ta4Pd3Te16. J.Phys.: Condensed Matter, 27(49):495701, 2015.
- [25] Z. Li, W. H. Jiao, G. H. Cao, and G. Zheng. Charge fluctuations and nodeless superconductivity in quasi-one-dimensional Ta4Pd3Te16 revealed by 125Te-NMR and 181Ta-NQR. In eprint arXiv:1610.01811v1, 2016.
- [26] P. Monceau. Electronic crystals: an experimental overview. Advances in Physics, 61, 2012.
- [27] A. Sinchenko, P. D. Grigoriev, P. Lejay, O. Leynaud, and P. Monceau. Anisotropy of conductivity in rare-earth tritellurides in the static and sliding states of the CDW. Physica B, 460:21–25, 2015.
- [28] C. Schlenker, C. Hess, C. Le Touze, and J. Dumas. Charge Density Wave Properties of Quasi Low-Dimensional Transition Metal Oxide Bronzes. J. de Physique I, 6:2061–2078, 1996.
- [29] M. Naito and S. Tanaka. Electrical Transport Properties in H-NbS2, -NbSe2, -TaS2 and -TaSe2. J. Phys. Soc. Jap., 51(1):219–227, 1982.
- [30] F. Flicker and J. van Wezel. Charge Order from Orbital Dependent Coupling Evidenced by NbSe2. Nat. Commun., 6:7034, 2015.
- [31] F. Flicker and J. van Wezel. Charge ordering geometries in uniaxially strained NbSe2. Phys. Rev. B, 92:201103, 2015.
- [32] W. L. McMillan. Theory of discommensurations and the commensurate-incommensurate charge-density-wave phase transition. Phys. Rev. B, 14:1496–1502, 1976.
- [33] F. Flicker and J. van Wezel. One-Dimensional Quasicrystals from Incommensurate Charge Order. Phys. Rev. Lett., 115:236401, 2015.
- [34] S. Kagoshima, T. Ishiguro, and A. Hiroyuki. X-ray scattering studies of phonon anomalies and superstructures in TTF-TCNQ. J. Phys. Soc.Jap., 41(6), 1976.
- [35] Y. Feng, J. van Wezel, J. Wang, F. Flicker, D. M. Silevitch, P. B. Littlewood, and T. F. Rosenbaum. Itinerant density wave instabilities at classical and quantum critical points. Nat. Phys., 11:865, 2015.