Attack Analysis Results for Adversarial Engagement 1 of the DARPA Transparent Computing Program
Abstract
This report presents attack analysis results of the first adversarial engagement event stream for the first engagement of the DARPA TC program conducted in October 2016. The analysis was performed by Stony Brook University and University of Illinois at Chicago. The findings in this report are obtained without prior knowledge of the attacks conducted.
1 Engagement 1 Analysis Results: UIC
1.1 Overview
We built a tag- and policy-based analysis system for attack detection and forensic analysis. Our system tracks information flows from sources to sensitive sinks in real time, and raises alarms when the policies are violated. In addition, it keeps a provenance context with every entity in the system. Specifically, provenance context contains a list of the events and relationships that contribute to the existence of an entity. Using such provenance context, we are able to provide an explanation for the raised alarms under the form of dot graphs. During Engagement 1, we successfully detected the attacks on several TA1 traces and produced graphs with details about those attacks.
1.2 Consumed TA1 Data and Challenges
At UIC, we consumed and analyzed CADETS traces for all three scenarios (BOVIA, PANDEX, and Stretch Period).
1.3 Challenges
We faced several challenges due to data formats and lack of documentation about the traces. The data format challenges were especially frustrating, since they required a large amount of effort to debug and fix. More specifically, we spent around 70% on this task alone. We report below details about the most prominent issues that we faced.
1.3.1 Data Format Challenges
CADETS
-
•
Missing IPs. Sometimes, the IP address of a netflow object is not in the definition of the object. Whereas, it is available in EVENT_Socket or other events. Other times, there is no IP address for a netflow object, neither in the definition nor in other related events. We treated these missing IPs as untrusted and consequently had an increase in the false positives number.
-
•
Inconsistent File Object URLs. Some versions of file objects have empty URL while other versions have URL. Other times the URL is missing for all the versions of the file objects. In addition, many file paths are in different fields like [‘‘properties’’][‘‘fdpath’’] or [‘‘properties’’][‘‘upath1’’] while they are expected to be in URL field of file objects.
-
•
Repeated UUIDs. In some cases, the same UUID is used for different objects like a file and a netflow.
-
•
Redundant Data. There are multiple and unnecessary definitions of the same object.
-
•
Unconnected Records. Some events are expected to be connected to netflow or file objects (like recvmsg), but there are no SimpleEdge records for this.
-
•
Missing Subject Names. The process names should be part of their definitions but usually, they can be found in the exec field of other events generated by that process.
-
•
Undefined UUIDs. Some UUIDs are used in events that are not defined in the trace, e.g., sending to a UUID, for which there is not definition.
1.4 Technology Summary
Our system follows a tag- and policy-based approach for attack detection and forensic analysis. In particular, we use tags to track information flow from predefined sources to sensitive sinks. We use 2 types of tags: 1) integrity tags, and 2) confidentiality tags. Every relevant entity in the system being tracked is associated with such tags and they are propagated to new entities as they are consumed from the TA1 traces.
1.4.1 Tags
Integrity tags. Integrity tags represent the degree of trustworthiness of the associated system entity. We use code integrity tags to represent the trustworthiness of programs and code, and data integrity tags to represent the trustworthiness of data. The code integrity tags are as follows:
-
1.
Whitelist. Used to eliminate background noise.
-
2.
Invulnerable. Used for programs that consume often low integrity data (e.g., browser). They can be downgraded when they execute or load low integrity code.
-
3.
Benign+authentic. Used for non malicious programs that are authenticated. These programs can be downgraded when consuming low integrity code or data.
-
4.
Benign. Used for non malicious programs, unless exposed to untrusted code or data.
-
5.
Untrusted. Used for code from untrusted sources.
-
6.
Malicious. Used for programs that exhibit clearly malicious behavior.
The data integrity tags include the last 4 tags of the above list (Benign+authentic, Benign, Untrusted, Malicious).
Confidentiality tags. Confidentiality tags express the degree of secrecy of certain data and the degree of protection they need. They are as follows:
-
1.
Public. Readily available from public sources, no need to protect. Assigned to most code.
-
2.
Private. Data with some privacy concerns, but none too specific. Assigned to most data files and data downloaded from most web sites.
-
3.
Sensitive. Data with specific security or privacy concerns (e.g., server or host configuration files, emails).
-
4.
Secret. Data whose loss can enable impersonation (e.g., /etc/shadow, ssh host or user private keys.
1.4.2 Detection Policies and Forensics
Attack detection is guided by several policies, which make use of tags. These policies may deal with integrity (e.g., raise an alarm if a low integrity file is executed), confidentiality (e.g., raise an alarm if secret information flows to low integrity sockets), or a combination of both (e.g., raise an alarm if an untrusted program reads a secret file and sends it to a low integrity socket).
In addition to the detection policies, our system contains a list of tag propagation policies, or rules, that govern the propagation of tags through the system entities. These rules are specific to each event and are executed as the events are consumed from the TA1 traces.
We have implemented several types of policies, that deal mainly with information flow from secret and sensitive data to untrusted sockets and programs. Our policies make use of an initial of sources (list of IPs that are untrusted, a list of files that are secret) and sinks (list of trusted IP addresses, secret and sensitve files). As the records are consumed we maintain a data structure that represents the system entities and their tags and use it to enforce the policies.
To support forensics, in addition to the tags, we associate a provenance context to each system entity. This context contains all the events and entities that, starting from the sources, contribute to the state of a system entity. This provenance context is propagated forward and augmented, as new events are consumed from the TA1 traces. For instance, if a browser forks a shell, the fork event is added to the provenance context of that shell. If that shell writes to a file, the context of the shell is copied to the context of the file, and the write event is added to the context of the file. Therefore, the context of the file will contain both the fork event and the write event. If that file is executed and a new process is created, its context is copied to the context of the new process, and the execute event is added to it.
Using forward propagation of the provenance context, we are able to immediately obtain the history of events that contributed to an alarm. In particular, for every alarm that is raised, our system processes the provenance context of the entities involved in the alarm and produces a dot file that represents the history of the alarm.
1.5 Results
In this section, we present our results on the CADETS traces. We successfully detected and reconstructed the history of the attacks on the CADETS machines. For each scenario, we attach the graph of the attack. In these graphs, we depict processes by ovals, file objects by rectangles, and sockets by diamonds. We use labeled and directed edges to represent system calls. The direction of the edges represents the direction of information flow, while the number of the edge labels represents the order of the system calls. We note, that for space purposes and readability, we have removed several edges and nodes from the final result. These represent activities that occur at the same time as the attack but are most likely not connected to it.
1.5.1 Bovia Scenario
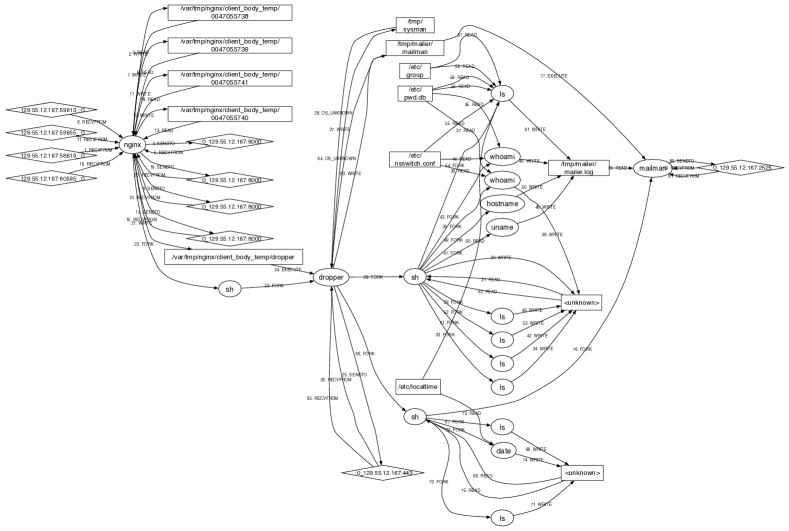
In this scenario, we detected at least two instances of a similar attack, starting from the nginx server. In the first instance, shown in the graph in Figure 1, the nginx server reads from bovia.com at 129.55.12.167:8000 (edge 20) and subsequently writes a file to ./var/tmp/nginx/client_body_temp/dropper, which is then subsequently executed in a new process called dropper (edges 23, 24). The dropper process now communicates with port 443 of bovia.com and subsequently writes a file to /tmp/sysman. Next, the dropper process creates a shell (edge 29), which executes several system commands, including ls, whoami, hostname, uname. Each of these processes writes to the file /tmp/mailer/mailer.log. We believe that their output is redirected to that file. Next, dropper writes to the file /tmp/mailer/mailman, which is subsequently executed (edges 76, 77). The resulting mailman process reads /tmp/mailer/mailer.log (edge 78) and sends its contents to 129.55.12.167:2525 (edges 79, 80, 81).
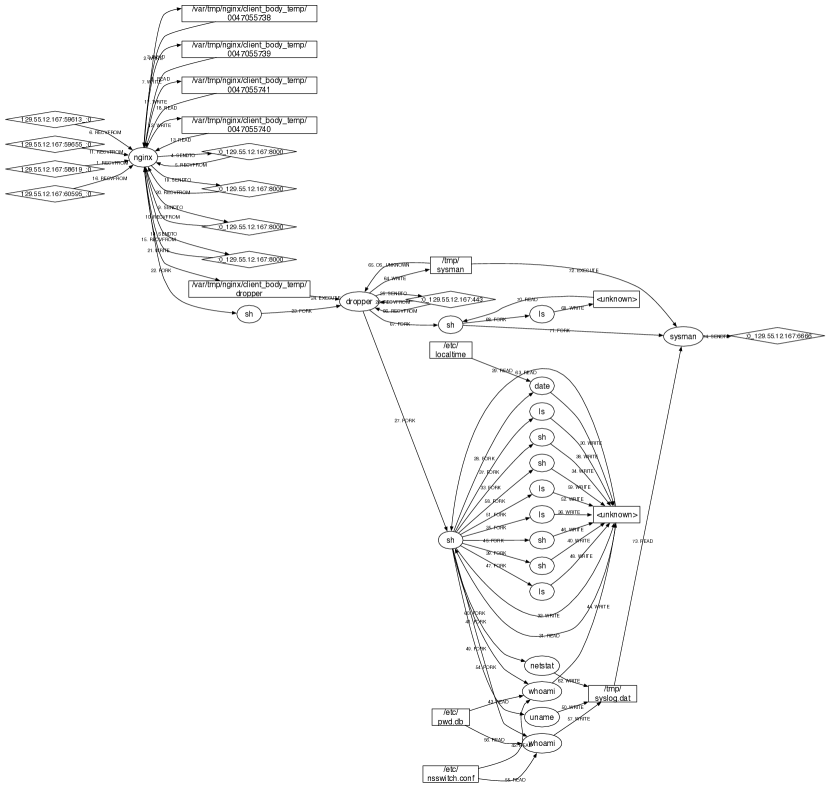
The second attack follows a similar pattern and it is shown in Figure 2. The steps up to the creation of the dropper process are the same. However, in this second attack, dropper first writes to a file /tmp/sysman and then executes that file. A shell is forked from dropper as well and a series of commands are run by it, including ls, whoami, uname, netstat. The output of these commads is written to the file /tmp/syslog.dat, which is later read by the sysman process and exfiltrated to 129.55.12.167:6666.
1.5.2 Pandex Scenario
This attack is shown in Figure 3. The machine has an sshd process running. At some point sshd, which is possibly compromised, forks a bash process, we suspect under the command of the attacker (there is no evidence from the dataset of the actual attack vector, but because of the subsequent events from this shell, we conclude this is an attack). This bash process invokes a series of commands – hostname, whoami, date, ps. These commands are examining the host information.
One of the processes invoked by this bash process is scp, which writes to the file /usr/home/bbn/./archiver. This file will be executed later. We do not see in the trace the IP address from which scp copies this file.
At some later point, the same bash process creates a (sudoed) scp process, which creates a new object (whose attributes are missing in the dataset) and which also downloads a file into location
/var/dropbear_latest/dropbearFREEBSD.tar, which is then uncompressed.
The file dropbearscript is next read by sh, and interprets it. This action creates the process dropbearkey, which writes to /usr/local/etc/dropbear/dropbear_ecdsa_host_key and
/usr/local/etc/dropbear/dropbear_rsa_host_key.
Next, another sudo process created by bash starts another dropbear process which reads these two keys for future use (presumably to assist in connecting to a remote host).
Dropbear next starts a shell, sh, which executes a series of commands ls, bash, uname, ps, all of which write to a file /usr/home/bbn/procstats. Another set of processes are created that run date, ls, netstat, whoami and hostname. They write to another file (presumably a log), but the location and name attributes of this file are missing in the dataset.
In addition, dropbear starts a bash process, which executes the file /usr/home/bbn/./archiver downloaded previously via scp. The resulting process, called archiver, reads the file /usr/home/bbn/procstats, which contains the data output earlier, and exfiltrates this information to 128.55.12.167:2525.
1.5.3 Stretch Period
The results of the stretch period on the CADETS data re shown in Figure 4. In particular, among several normal activities, we notice that the attack involves modifying the nginx server. In particular, we observed that sshd spawns a shell, which is the used to start vi. Vi writes to the file ngx_http_request_body.c (edge 557). Next this file is compiled by make, which creates instances of cc and ld. The end result is the executable /usr/ports/www/nginx/work/nginx-1.10.1/objs/nginx (edges 577-583). Next this file is copied to /usr/local/sbin/nginx (edge 585), probably replacing the original nginx executable. Next,this file is executed and it reads a number of password files /etc/spwd.db, /etc/login.conf.db, etc. We believe that reading these files is probably legitimate behavior, since many programs routinely access those files, to deal with access rights, hence they are not shown on the graph). Next, nginx forks a process procstat, which writes to an unknown file (edges 666,667). This file is later read by nginx (edge 668), and such read is followed by a SendTo event, which sends data (presumably the file’s data) to the IP address 129.55.12.167:1337.
In addition to nginx, we observed a tcpdump process as well running on the machine. This process communicates with unknown IP addresses (probably localhost), which we could not see in the traces, and writes only to /dev/tty. We do not suspect this process to be malicious, unless /dev/tty is somehow used as a channel for data exfiltration. In the trace there is a large number of processes interacting with /dev/tty.
1.5.4 Performance
The following table documents the performance of our system on the different CADETS traces. For each data source, we report the number of CDM records, the duration of the trace in minutes, that is the amount of tracking time, the consumption and analysis time of our system (column Analysis(mins)), as well as the main memory used by our system. As can be noted, our system can consume and analyze the data approximately 20 times faster than the speed at which they are generated (in average, under the conditions of Engagement 1).
| Data | No. Records | Duration(mins) | Analysis(mins) | Memory(MB) |
|---|---|---|---|---|
| Bovia | 24’448’281 | 4736 | 220 | 872 |
| Pandex | 23’801’471 | 4744 | 198 | 955 |
| Stretch | 2’826’453 | 498 | 26 | 125 |
2 Analysis of FiveDirections and TRACE Data: Stony Brook University
The key elements of our approach are described below.
2.1 Space-efficient main memory provenance graph representation
Our subteam is focused on real-time detection and analysis capabilities. We have found that graph databases do not provide adequate performance at the data rates anticipated in TC. Hence we are targeting a main-memory representation of the provenance graph. The goals of this main memory representation are:
-
•
High fidelity provenance tracking: Efficiency or other considerations should not cause unrelated flows to be “mixed up” in the graph. In a forensic analysis, we often do not know that a particular activity was suspicious (or outright malicious) until a long time afterwards. If the graph prematurely conflates data from two sources, it would be difficult to disentangle the flows and accurately identify the root causes or initial triggers.
-
•
Compact yet accurate representation of event data: The representation should not discard event data that may be useful for anomaly detection, forensic analysis, or other tasks that may be performed days, weeks or months after events took place. Our experiments with on-disk graph databases has shown that graph operations would be several orders of magnitude slower than those on main memory data structures. However, given the volume of TA1 data, main memory representations would be overwhelmed unless ultra-compact representations are developed.
-
•
Unified data representation across TA1s: CDM has achieved a level of uniformity at the syntactic level. However, achieving semantic uniformity and consistency across TA1s has proven challenging because of differences in operating systems, instrumentation approaches, and provenance-tracking capabilities across TA1s. At the same time, it is not very practical or effective to develop (or re-implement) analysis algorithms for specific TA1s. For this reason, we translate TA1 data into a common semantic representation (CSR).
2.2 Provenance-based attack detection
Our approach uses provenance for real-time attack detection. Specifically, we assign integrity tags and confidentiality tags to objects (files, IPCs, etc.) and subjects (processes). In the simplest case, there are two levels of integrity: benign, representing data and code from sources that are trusted to be non-malicious, and untrusted, representing code/data from anywhere else. Similarly, two level of confidentiality can be defined in the simplest case: public and private.
Pre-existing objects and subjects are assigned initial tags. Newly created subjects inherit the tags of their parents. Newly created objects inherit the tags of the process creating them. In addition, tags flow with data. For instance, a benign subject will acquire untrusted tag if it reads an object with untrusted tag. Based on these tags, we can raise alarms on several suspicious behaviors:
-
•
Untrusted code execution: This alarm is raised when a subject with higher code integrity loads or executes untrusted code.
-
•
Undesired Subject/Object Downgrading: This alarm is raised when a higher integrity subject or object is downgraded because of a flow from a source of lower integrity. This class captures attacks where (a) a benign process is exploited by untrusted input, or (b) a compromised process corrupts a benign object111Note that objects here need not be files, but can be intranet sites as well. So, it should capture the example of a malicious web site that contains JavaScript that accesses an intranet server. This assumes that the top-level browser does not read any untrusted site, and only subprocesses/units/tabs do, and that these tabs run the malicious JS in question..
-
•
Confidential data leak: An alarm can be raised when untrusted subjects acquire (i.e., read) or exfiltrate (i.e., write) sensitive data.
-
•
Permission changes: When suspicious changes to file permissions occur, e.g., when an untrusted object is made executable, an alarm can be raised222Note that this policy is applicable to file objects, as well as in-memory objects. Normal mmap/mprotects that occur in conjunction with file loading are supposed to be recognized by the input stage, which instead reports a loadlib event..
In our implementation, several additional levels of integrity and confidentiality are used. Moreover, tag assignment, propagation and attack detection are all controlled by provenance policies that are can tuned by a forensic analyst.
2.3 Tag-based forward analysis
This analysis is initiated when an alarm is raised by one of the policies described in the previous section. All subsequent actions performed by the subject involved in the alarm, as well as its descendants, are emitted by the system, and can be used to construct a graph of subsequent activities. In order to fine-tune the subgraph that is emitted, we rely on the customizable policy framework mentioned in the last section. This allows us to “tune out” uninteresting events, such as loads or reads of files with high integrity and low confidentiality.
In the first engagement, most of our successful analyses were based on the untrusted code execution alarm. A secondary policy was defined to cope with instances where provenance is not accurately captured in TA1 data. In such a case, an object may be written, but we may not have the correct provenance, and hence its tag may be incorrect. Our “backup” policy to deal with such instances was to flag execution of a previously written file.
2.4 Performance
2.4.1 Size
Figure 5 shows the sizes and memory used for the data sets we consumed and successfully analyzed. In summary, we make the following observations:
-
•
We first translate CDM into our common semantic representation (CSR), a uniform representation that we use across different OSes. CSR is stored in compressed (gzipped) format. On average, CSR is about 40 times smaller than the binary representation used in CDM.
-
•
On average, we use about one byte of memory per CDM record for data from FiveDirections, and about 4 bytes per CDM record for data from Trace.
| Data set | CDM | CSR | CSR/CDM | Main | Memory/ |
|---|---|---|---|---|---|
| size | Size | ratio | memory | CDM ratio | |
| 5D Bovia | 150 MB | 3 MB | 2.0% | 2.1 MB | 1.4% |
| 5D Pandex | 130 MB | 2.5 MB | 1.9% | 1.7 MB | 1.3% |
| 5D Stretch | 49 MB | 0.8 MB | 1.6% | 0.6 MB | 1.2% |
| 5D Mean | 1.9% | 1.3% | |||
| Trace Bovia | 175 GB | 4.7 GB | 2.7% | 11.3 GB | 6.4% |
| Trace Pandex | 111 GB | 3.9 GB | 3.5% | 5.8 GB | 5.2% |
| Trace Stretch | 13 GB | 0.4GB | 3.1% | 0.7 GB | 5.4% |
| Trace Mean | 3.1% | 5.7% | |||
2.4.2 Runtime
| Data set | CDM | Duration | Graph Construction | Analysis | ||
| Time | Speed-up | Time | Speed-up | |||
| 5D Bovia | 150 MB | 19:43:46 | 0.92s | 77 K | 1.05s | 68 K |
| 5D Pandex | 130 MB | 23:15:42 | 0.75s | 112 K | 0.86s | 97 K |
| 5D Stretch | 49 MB | 06:22:42 | 0.24s | 96 K | 0.27s | 85 K |
| 5D Mean | 95 K | 83 K | ||||
| Trace Bovia | 175 GB | 79:06:39 | 1.22h | 65 K | 2.5h | 32 K |
| Trace Pandex | 111 GB | 79:05:13 | 0.77h | 102 K | 1.73h | 46 K |
| Trace Stretch | 13 GB | 07:59:26 | 333s | 86 K | 375s | 77 K |
| Trace Mean | 84 K | 52 K | ||||
2.4.3 Analysis Selectivity and Automation
In this section, we focus on how much automation is brought to the forensic analysis by our techniques. In particular, attack detection is automated, and it identifies the most suspicious events. Starting from these events, our system performs an automated forward analysis. During this analysis, configurable policies are used to filter out uninteresting events performed by suspect processes (e.g., loads of benign libraries), while retaining significant events. This results in a very small fraction of the CDM events being flagged for further analysis.
In some cases, the filtered event set is small enough to be directly fed into a graph visualization program such as graphviz. In other cases, the number of events is too large, and is subject to further manual analysis. Figure 7 shows how selective these automated processes are. Less than one-thousandth of the CDM events are flagged for further analysis.
| Data set | Number of | Number of | Number of |
| CDM records | Filtered Events | Alarms | |
| 5D Bovia | 1.85 M | 1.6 K | 3 |
| 5D Stretch | 509 K | 0.18 K | 4 |
| Trace Bovia | 2.3 B | 28 K | 12 |
| Trace Pandex | 1.5 B | 25 K | 6 |
| Trace Stretch | 168 M | 4 K | 4 |
Even in those cases where the approach is selective enough to be directly fed into a graph visualization tool, the result of such an automated process will still include some details that are not critical for understanding a scenario. Since one of our goals in this report is to provide graph representations that are easy for TA 5.1 to understand, we performed further interactive filtering and editing (of the above filtered events) to arrive at the graphs shown in the next two sections.
2.5 Analysis of FiveDirections Data
2.5.1 Issues and Challenges
We successfully consumed data from FiveDirections. All three data sets (Bovia, Pandex and Stretch) were successfully consumed. Traces of Bovia and Pandex are divided into multiple topics because of crashes of their system. We are able to reconstruct the Bovia scenario and Stretch scenario. We analyzed the Pandex scenario but there is nothing suspicious in the provided traces.
We encountered several significant difficulties with this data. First, network flows are encoded in CDM in an unusual way that made it difficult to process them correctly, at least in the beginning. This is an instance of the more general problem that CDM provides a syntax without nailing down the semantics. Second, there is an inconsistency in how network I/O is handled, as compared to file I/O. In the case of network connections, only the initial connection operation is reported, but none of the subsequent reads or writes. In contrast, reads and write operations are reported on files, but the open operation goes unreported.
Other difficulties specific to FiveDirections are of greater concern to us going forward. First, access to devices such as the keyboard, camera and microphone are not captured by FiveDirections. Second, activities of system processes seem not to be captured in some cases. The Pandex scenario involves RDP, and it appears that activities initiated through RDP are not recorded by Five Directions. This obviously makes it extremely difficult, if not impossible, to do any meaningful analysis of their Pandex data.
2.5.2 Bovia Scenario
This analysis applies to what we found in the fifth (last) Kafka queue for FiveDirections Bovia data. The starting point of our analysis are the following two alarms generated by our system:
16-09-09 09:28:37.832: Alarm: UntrustedLoad: Object C:\Users\5d_tc\Downloads\firefox\dropperSubject pid=560 C:\Program Files\Mozilla\firefox\firefox.exe
16-09-09 09:55:07.049: Alarm: UntrustedLoad: Object C:\dropperSubject pid=1580 C:\Program Files\Mozilla\firefox\firefox.exe
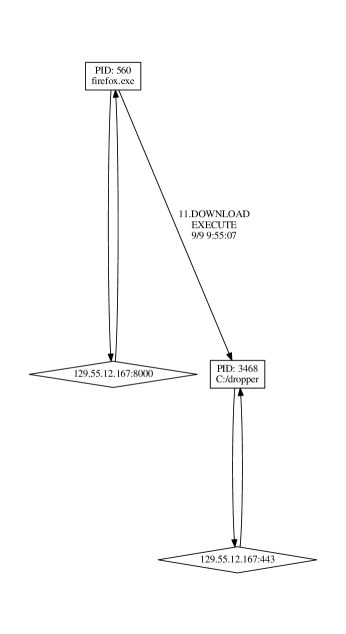
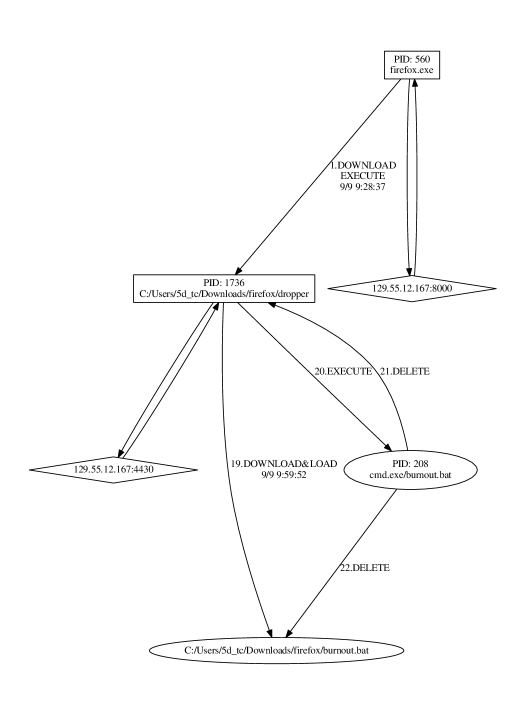
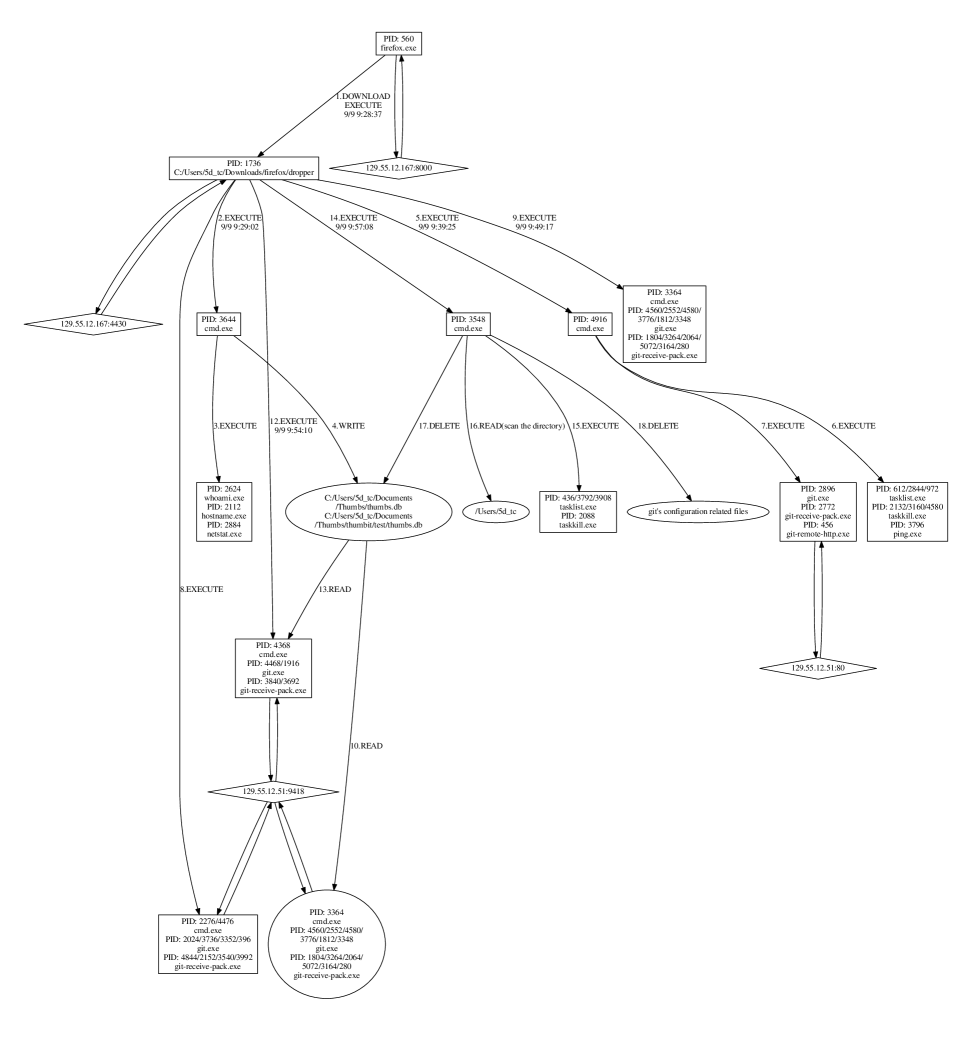
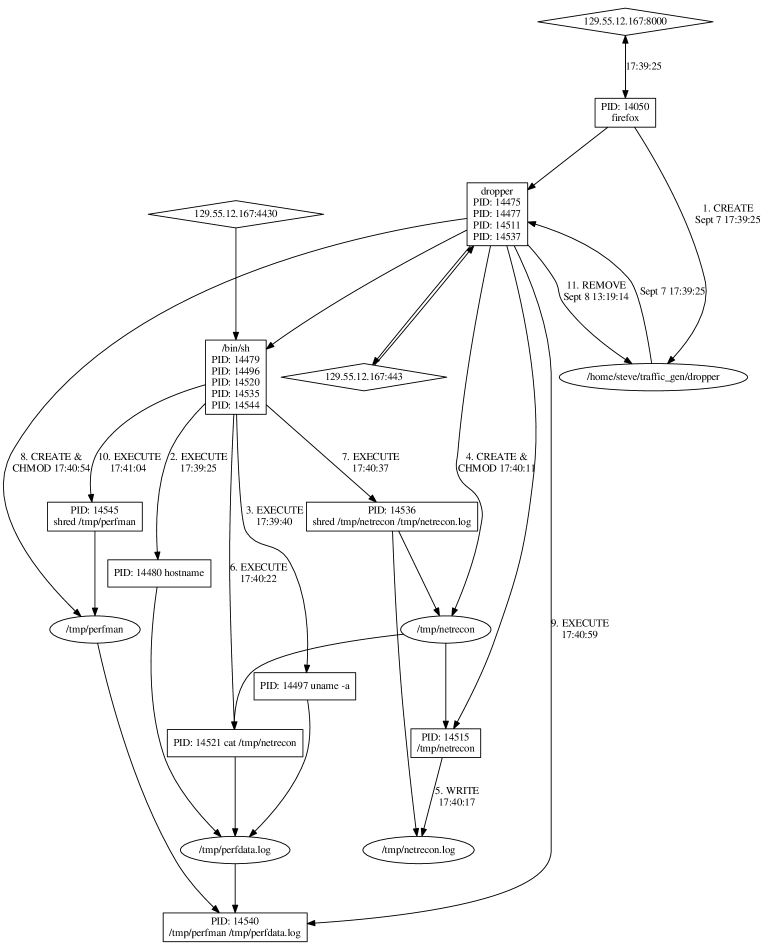
Using forward analysis (as sketched in Section 2.3) from the point of the above alarms, we arrived at the following reconstruction of the attack. The attack lasts for about half an hour. During this period, the attacker seems to engage in 12 interactive sessions over which the attacker invokes over 60 commands that end up executing about 6K to 7K system calls. Figures 8–9 illustrates the steps.
The entry point for the attack is Firefox, which seems to be compromised when visiting the web server at 129.55.12.167 on 9/9/16 at 9:28am. There are connections to this web server from about 3 minutes before this point, with the difference that the last connection before the compromise goes to port 8000 rather than 80. (Because of the lack of granularity in FiveDirections data, we cannot attribute the network source exactly; instead we are hypothesizing that the last connection before the compromise is mostly likely responsible.)
When Firefox is compromised, a malicious program called dropper is downloaded. Firefox then executes dropper. Dropper then invokes cmd.exe 12 times over the next half hour, using it to perform various data gathering and exfiltration tasks, as described further below. Dropper is likely providing a remote interactive shell capability, connecting to 129.55.12.167:4430 to receive commands and executing them via cmd.exe each time.
Some of the cmd.exe sessions last less than a minute, while others last for maybe 10 minutes or more. Some of these sessions invoke PowerShell.exe. Since there are so many cmd.exe sessions, we will summarize the overall activity, instead of discussing each session in detail.
These various cmd.exe sessions collect data in a file called thumbs.db, which is then exfiltrated using git to 129.55.12.51:9418. There is some activity by cmd.exe that looks like an attempt to reconfigure git to connect to the malicious server in the future. Towards the end of the attack, several of git’s configuration related files are cleaned up, presumably to clean up the system and avoid leaving any trails.
Given that the attacker is able to freely access the files used by git, and what appears to be the project directory (Thumb), the attacker could have modified these documents or source code, and pushed them to the repository. However, we cannot find any evidence that this was actually done, as we don’t see source code files or meaningful document files being edited or modified in another way.
In one of the sessions, information gathering commands such as whoami,
hostname and netstat are run, and the results are saved into a file called
C:\Users\5d_tc\Documents\Thumbs\thumbs.db. Sometimes the name changes to
C:\Users\5d_tc\Documents\Thumbs\thumbit\test\thumbs.db. In the end, both
files are removed in order to hide the attacker’s trail.
Another session seems to scan all of the directories under \Users\5d_tc.
This could be a case of an attacker interactively examining the system. We
cannot find any sign of the resulting data being saved to a file or
exfiltrated.
At the very end, dropper downloads a batch file called burnout.bat into Firefox download directory and then executes it. The purpose of this batch file seems to be to delete dropper as well as burnout.bat from the system, thus removing all signs of a break-in.
2.5.3 Pandex Scenario
We were told that RDP played a central role in the Pandex attack. Based on our discussions with FiveDirections, it appears that activities initiated through RDP are not recorded by Five Directions. This obviously makes it extremely difficult, if not impossible, to do any meaningful analysis of their Pandex data.
We fell back on our “backup” detection technique, looking for files that are written during the engagement and then subsequently loaded or executed. Based on our understanding of the rules of engagement, these attacks involve, at some point, downloading a file that is then loaded or executed. While the mechanism for downloading may differ (e.g., download via browser, email, or a remote login session; download of an executable, DLL, or a file taken as input by an interpreter), we did expect there to be malicious executable content that is saved on the disk.
However, we found that none of the files written during the engagement were loaded or executed, not even by interpreters. In fact, we looked at the set of all files written on any of the four Kafka queues for FiveDirections Pandex, and compared it with the list of files executed/loaded across them, and again found no intersection. This could, of course, be the result of above-mentioned gaps in FiveDirections data — files written as a result of an RDP session may not be captured in the data.
As a last resort, we looked at the list of all programs and DLLs loaded or executed in the last Kafka queue for Pandex scenario, and did not find even a single suspicious-looking process.
While our reasons for missing data are speculative, it seems safe to say that there is minimal, if any, trace of attack in this data.
2.5.4 Stretch Scenario
The starting point for our analysis are the following four alarms from one of our detectors. (We enabled only one of our detectors that detects untrusted code execution.)
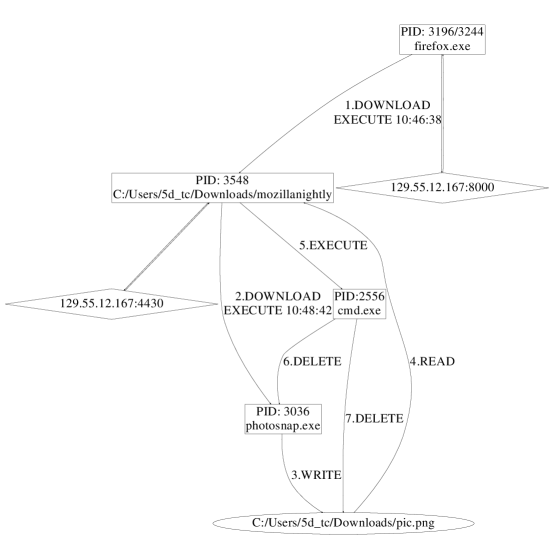
16-09-27 10:46:38.093: Alarm: UntrustedLoad: Object C:\Users\5d_tc\Downloads\mozillanightlySubject pid=3244 C:\Users\5d_tc\Downloads\firefox\firefox.exe
16-09-27 10:48:42.855: Alarm: UntrustedLoad: Object C:\Users\5d_tc\Downloads\photosnap.exeSubject pid=3548 C:\Users\5d_tc\Downloads\mozillanightly
16-09-27 10:48:54.458: Alarm: UntrustedLoad: Object C:\Users\5d_tc\Downloads\mozillanightlySubject pid=3404 C:\Users\5d_tc\Downloads\firefox\firefox.exe
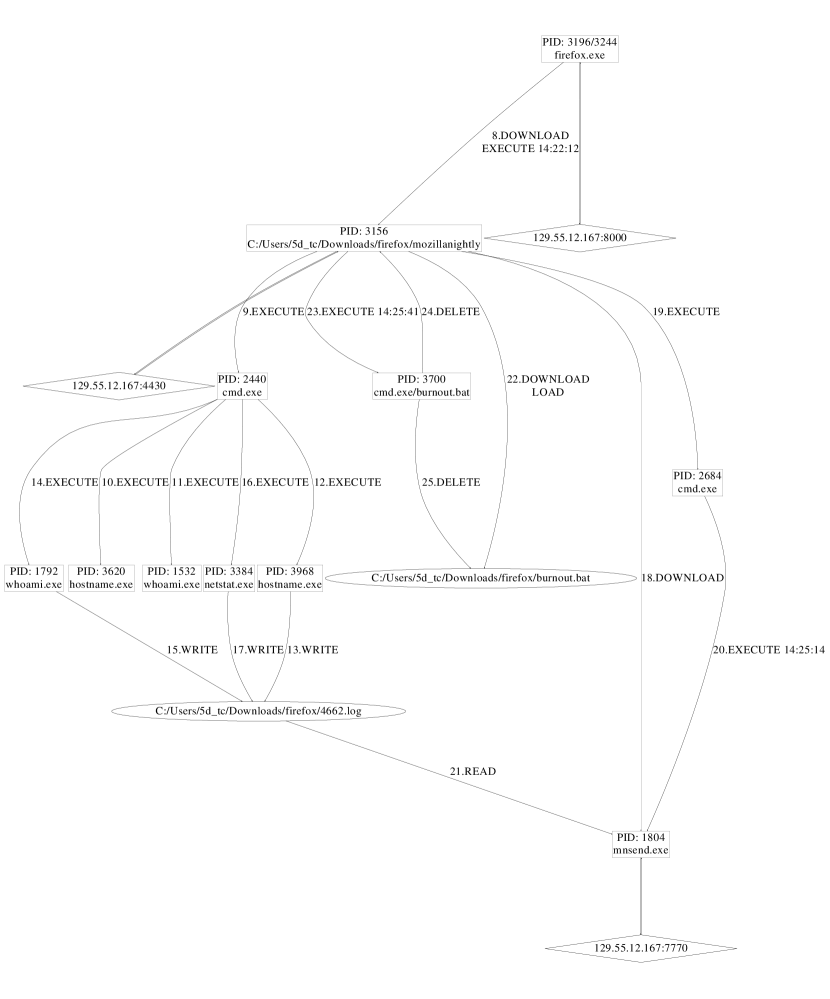
16-09-27 14:22:12.615: Alarm: UntrustedLoad: Object C:\Users\5d_tc\Downloads\firefox\mozillanightlySubject pid=3196 C:\Users\5d_tc\Downloads\firefox\firefox.exe
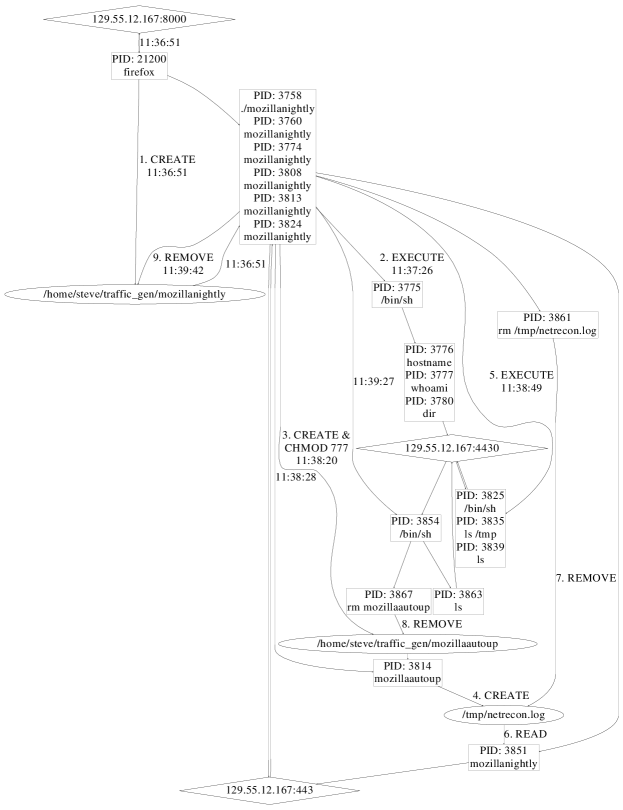
From the alarms, it is clear that two versions of mozillanightly malware are being downloaded. The first version is executed twice, while the second version is executed once. Using forward analysis (as sketched in Section 2.3) from the point of the above alarms, we arrived at the following reconstruction of the attack. Figures 10 and 11 illustrate the steps of this attack.
The attack begins with what seems to be a browser compromise of Firefox at 10:45:38, which causes a malicious executable mozillanightly to be downloaded from IP address 129.55.12.167:8000. There is a second download of malware with the same name at 14:22:12. These are stored in two different places, as shown in Figures 10 and 11.
At 10:47, Firefox executed C:\Users\5d_tc\Downloads\mozillanightly, which
downloads photosnap.exe from 129.55.12.167:4430. Then mozillanightly executes photosnap.exe. Since FiveDirections does not
record device access, there is no direct information about the input to photosnap.exe. However, from the DLLs it loads, we surmise it is either
taking a picture using the camera or performing a screengrab. The results are
saved in a couple of temporary files (img57.tmp and img58.tmp).
Subsequently, the contents of these files seem to be copied over into
C:\Users\5d_tc\Downloads\pic.png, and then this file is sent out to
129.55.12.167:4430. At last, mozillanightly invokes cmd.exe to remove pic.png and photosnap.exe.
At 10:49, Firefox executes C:\Users\5d_tc\Downloads\mozillanightly again,
but nothing special happens in this session. Perhaps the attacker was
interactively examining the system, running commands such as hostname and
whoami, but no files seem to have been created or exfiltrated.
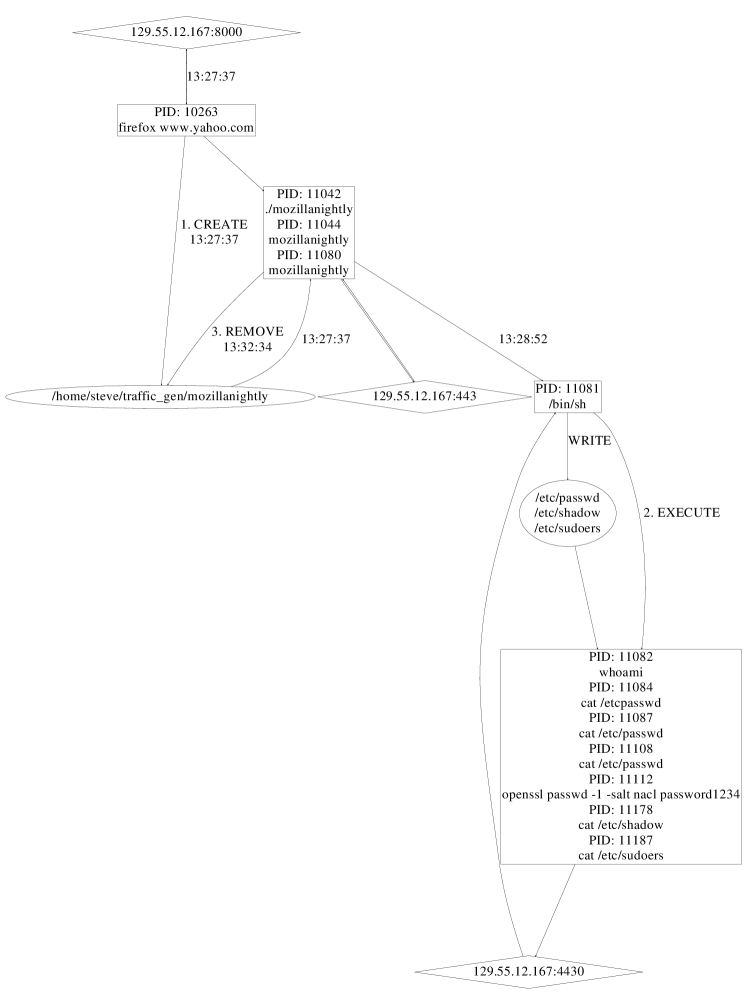
At 14:32, Firefox executes
C:\Users\5d_tc\Downloads\firefox\mozillanightly again, which in turn
invokes cmd.exe to run hostname.exe, whoami.exe and netstat.exe. The results of these commands are written to a file named
C:\Users\5d_tc\Downloads\firefox\4662.log.
Then mozillanightly downloaded
C:\Users\5d_tc\Downloads\firefox\mnsend.exe from 129.55.12.167:4430, and it
invoked cmd.exe to execute mnsend.exe to send 4662.log to
129.55.12.167: 7770, and then it removed 4662.log and mnsend.exe.
At last, mozillanightly downloads
C:\Users\5d_tc\Downloads\firefox\burnout.bat from 129.55.12.167:4430. When
burnout.out executes, it completes the clean up after the attack,
removing C:\Users\5d_tc\Downloads\firefox\mozillanightly and burnout.bat.
2.6 Analysis of Trace Data
2.6.1 Issues and Challenges
We have successfully consumed all three data sets from (Bovia, Pandex and Stretch). We were able to reconstruct all three scenarios and detect the attacks. Consuming the data turned out to be challenging as there were some changes of semantics in the data representation during the engagement compared with the data that we got previously. For example, CREATE events edges that contained file uuid information were switched between toUuid and fromUuid during the engagement.
There were 60 times more memory objects than all the file and netflow objects combined, which created an explosion in the number of events related to them. For example there were 276 million memory objects in the Bovia scenario, even a single event occurrence on each memory object leads to generate approximately 1 billion records (definition of the memory object, event definition and 2 edges), which is almost half the records in the scenario.
Instead of handling stdin, stdout and stderr, they were reported as SrcSink objects with the only indication that they were indeed stdin, stdout and stderr being the file descriptor. Also, there were pipes which were read from but were never written to, which leads us to think of missing information flow from the program’s stdout to pipes. Also, the case where pipes were written to and never read from was seen. This was seen in the attack scenario, in the stretch data, where the program that performed cat operation on the passwd file writes to a pipe and an openssl program also writes to that same pipe, but that pipe was never read from. As a result, this data does not tell us where the information went. Other issues include:
-
•
subjects that did not have proper clone and execve sequences
-
•
multiple unlink operations on the same object
-
•
netflow objects with no IP addresses, and
-
•
declaration of unused subjects/objects.
The only way we found to consume the data was to drop events affected by these issues and also drop SrcSink objects and related events except for the ones related to stdin, stdout and stderr. As a result, significant provenance information may have been lost.
2.6.2 Bovia Scenario
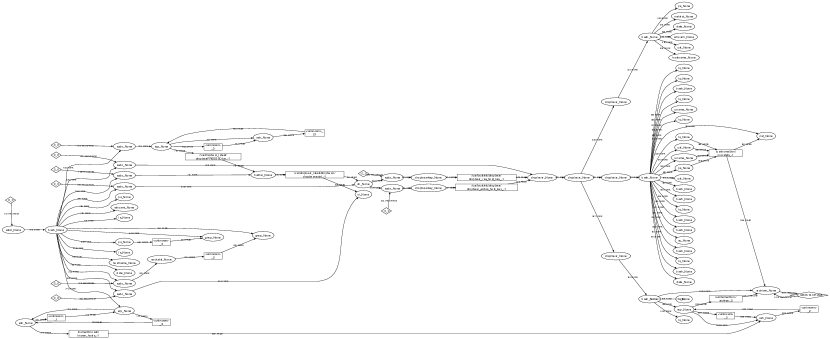
The Bovia scenario covers a period of about 4 days, and consists of four “episodes.” Figures 12–14 illustrate the first three episodes. The last episode is somewhat large, and hence is broken up into two parts in Figures 15 and 16.


2.6.3 Pandex Scenario
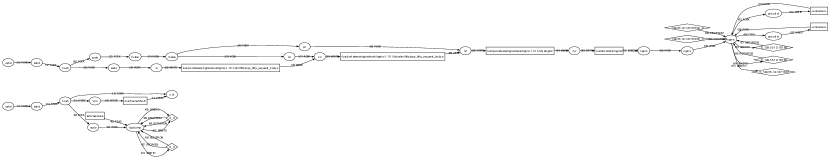
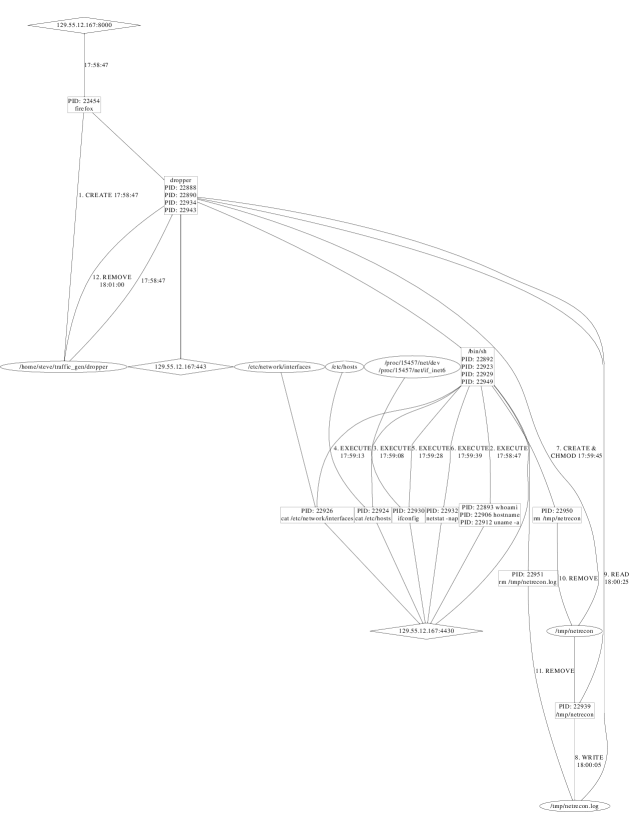
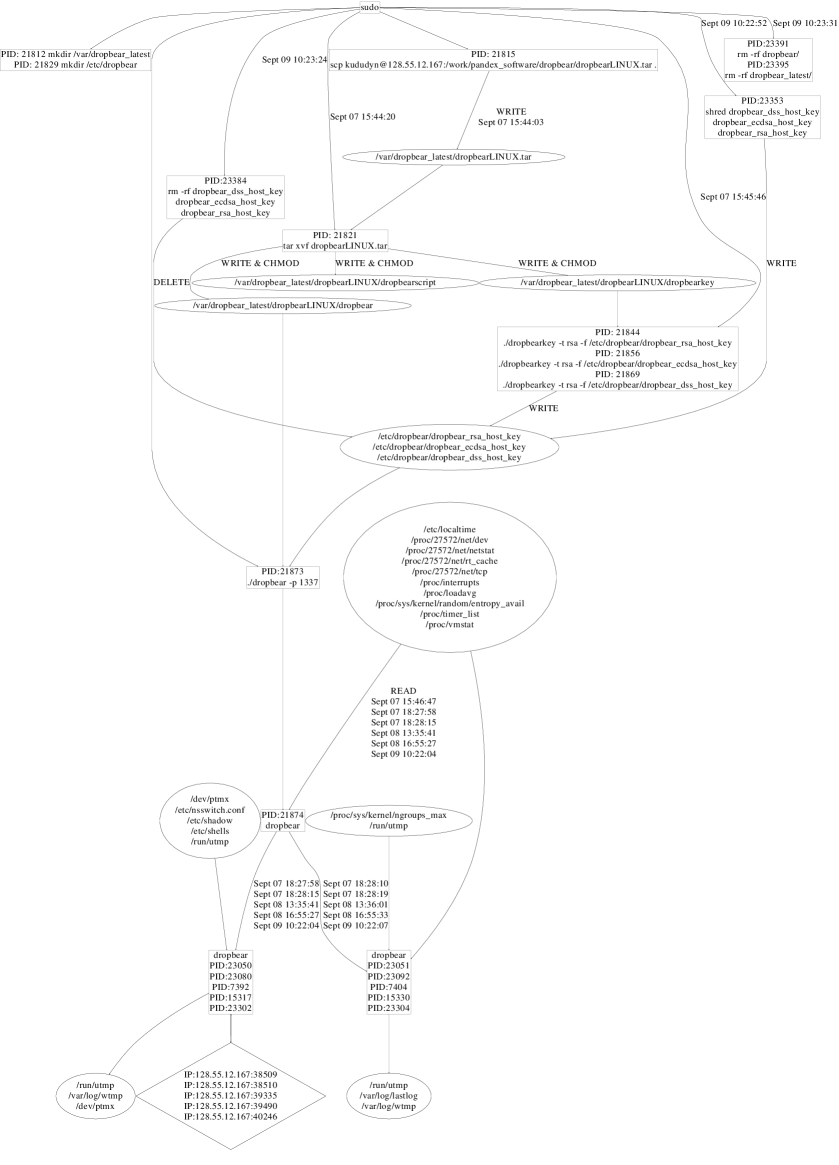
The Pandex scenario covers a period of about 3 days. On 9/7 at 15:44:03, the attacker first creates a directory /var/dropbear_latest and then downloads the file dropbearLINUX.tar to that directory using scp from kududyn@128.55.12.167:/work/pandex_software/dropbear/dropbearLINUX.tar. The attacker performs tar xvf dropbearLINUX.tar, which creates and chmod’s the files dropbearkey, dropbearscript and dropbear. Next, the attacker creates /etc/dropbear directory and executes dropbearkey program, which generates dropbear_rsa_host_key, dropbear_ecdsa_host_key and dropbear_dss_host_key in that directory. The attacker then runs ./dropbear -p 1337, which uses all the three keys generated by dropbearkey program and performs exfiltration. On 9/9 at 10:23:24, the attacker performs a cleanup by running the shred program on the three keys and then performing rm -rf on them. In addition, rm -rf is done on the /etc/dropbear folder and the /var/dropbear_latest folder.
The attack consist of several information gathering sessions, followed by exfiltration. These exfiltrations occur to the following IP addresses at the following times:
-
•
IP:128.55.12.167:38509 on 9/7 18:27:58
-
•
IP:128.55.12.167:38510 on 9/7 18:28:15
-
•
IP:128.55.12.167:39335 on 9/8 13:35:41
-
•
IP:128.55.12.167:39490 on 9/8 16:55:27
-
•
IP:128.55.12.167:40246 on 9/8 10:22:04
The Figure 17 describes the attack.
2.6.4 Stretch Scenario