Direct observation of how the heavy fermion state develops in CeCoIn5
Heavy fermion materials gain high electronic masses and expand Fermi surfaces when the high-temperature localized electrons become itinerant and hybridize with the conduction band at low temperatures. However, despite the common application of this model, direct microscopic verification remains lacking. Here we report high-resolution angle-resolved photoemission spectroscopy measurements on CeCoIn5, a prototypical heavy fermion compound, and reveal the long-sought band hybridization and Fermi surface expansion. Unexpectedly, the localized-to-itinerant transition occurs at surprisingly high temperatures, yet electrons are still largely localized at the lowest temperature. Moreover, crystal field excitations likely play an important role in the anomalous temperature dependence. Our results paint an comprehensive unanticipated experimental picture of the heavy fermion formation in a periodic multi-level Anderson/Kondo lattice, and set the stage for understanding the emergent properties in related materials.
The comparatively high tunability of the heavy fermions in Cerium- and Ytterbium-based rare earth intermetallics makes them attractive systems in the search for emergent phases of matter. This tunability is partially due to the dynamic generation of low energy scales and the concomitant enhancement of the density of states at the Fermi energy (). According to the standard model of heavy fermion behavior, epitomized by the periodic Anderson model in its local moment regime [1], the electrons are localized at high temperatures, while their hybridization with conduction electrons leads to the formation of bands with heavy masses as temperature is lowered and the -electrons become itinerant[2]. Exotic superconductivity, quantum criticality, and magnetic order subsequently emerge from these heavy electrons.
Such a generic picture of the localized-to-itinerant transition has been demonstrated by dynamical mean field calculations[3, 4], which predict a dramatic change of the Fermi surface due to the inclusion of fully itinerant electrons. However, the experimental picture has been puzzling, if not unclear, and direct validation is still lacking [5, 6, 7]. Moreover, previous experimental studies mainly focused on the low-temperature properties, and could not trace how the heavy-electron state is formed through the localized-to-itinerant transition. We take CeCoIn5 (superconducting transition temperature 2.3 K) as an example, since much of our current knowledge on heavy fermion systems comes from the studies of this compound. De Haas-van Alphen (dHvA) [9, 8], optical conductivity[10, 11], and scanning tunneling microscopy (STM) [12, 13, 14] measurements compare well with band calculations that assume fully itinerant electrons [8, 15], but they cannot provide the detailed electronic structure evolution with a sufficient temperature range and momentum resolution. Curious angle-resolved photoemission spectroscopy (ARPES) results [16, 17, 18] have been obtained for CeCoIn5: some suggest the Ce 4 electrons are itinerant up to 105 K [17], while later results suggest they are predominantly localized at 25 K [18]. Moreover, a recent ARPES study on YbRh2Si2 between 90 K and 1 K even challenged this picture — the anticipated Fermi surface change is not found in this temperature range[6]. (see, however, Ref. [19]).
The appearance of various temperature scales in different measurements further complicates the problem. For example, with decreasing temperature, the resistivity of CeCoIn5 first increases and then starts decreasing just below 50 K[20]. This characteristic temperature for the resistivity maximum, , has been associated with the onset of a coherent heavy electron band, and assumed to be close to the Kondo temperature, . Meanwhile, STM found a scaling of the local conductance in CeCoIn5 between 20 and 60 K [12]. Intriguingly, both the Seebeck and the Nernst coefficients exhibit anomalies at 20 K [21]. How the heavy fermion state develops with such perplexing multiple characteristic temperatures, and the role of any other similar energy scale besides , e.g. crystal field excitations, remain matters of debate.
Here, we address these perplexing findings in the prototypical heavy fermion system CeCoIn5. We combine bulk-sensitive soft x-ray ARPES to unravel its three-dimensional (3D) electronic structure, and resonant ARPES to expose the -electron behavior in an extended temperature range with much improved energy resolution. As a result, a comprehensive experimental picture of heavy fermion formation unfolds with unprecedented precision and details. Our data give a microscopic verification of the current model, and help to understand various experimental results. More importantly, we discovered unexpected important behaviors beyond the current model, which further deepens our understanding of heavy fermion systems.
3D Fermi surface and band structure
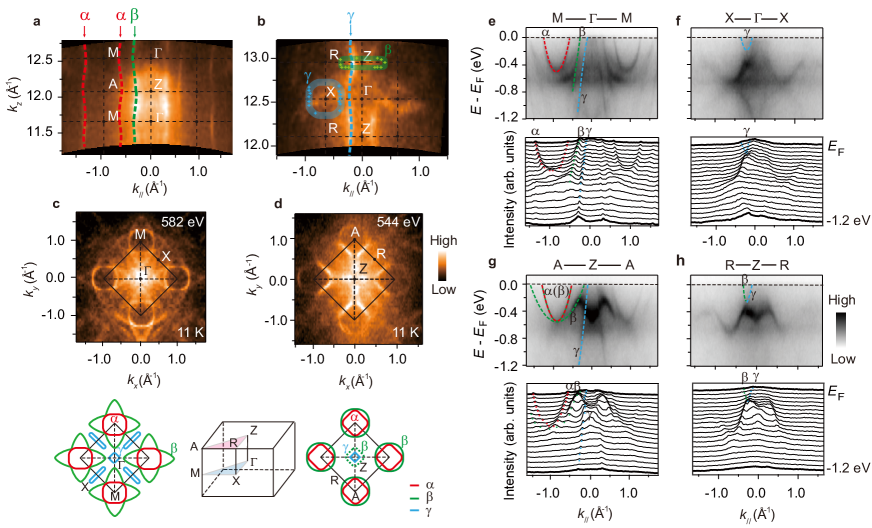
We start by measuring the 3D electronic structure of CeCoIn5 at 11 K with soft x-ray ARPES, whose high out-of-plane momentum () resolution makes it an effective tool for studying more-3D rare-earth compounds [22]. Photoemission intensity maps in the plane and plane of the CeCoIn5 Brillouin zone are shown in Figs. 1a and 1b, respectively.
The Fermi surface in the plane, shown in Fig. 1c, is composed of two electron pockets — a flower-shaped and a rounded pocket — and two hole pockets — a square-like pocket around and a narrow racetrack-shaped pocket around , both attributed to the band (Fig. 1f). As shown by the photoemission intensity plot along the - direction in Fig. 1e, the band is parabolic-like with its bottom 0.45 eV below . In the plane (Fig. 1d), the pocket becomes rounded and the pocket square-like. As shown in Fig. 1g, the band contributes two Fermi crossings along -, one degenerates with the band while the other contributes part of the square-like Fermi surface around .
Our data show that the band is the most two-dimensional (2D). Although the cross-sections of the and Fermi surfaces show weak variation in the plane (Fig. 1a), obvious differences can be observed between the Fermi surface topologies in the and planes. In the cross-section (Fig. 1b), there is a small -derived pocket around and another pocket around contributed by the band, indicating rather 3D characters of these two bands. The shapes of the and pockets qualitatively agree with previous dHvA measurements and calculations [9, 8]. While dHvA provided little information on the band, we find that it contributes a square-like pocket around in the plane, contradicting the calculation which predicts that the Fermi surface does not cross the plane [8]. The difference may arise from the only partially-itinerant electrons, as will be shown later in this paper. The observed quasi-2D electronic structure is consistent with the moderate in-plane vs. out-of-plane anisotropies in the superconducting critical field and magnetic susceptibility [20, 8, 23].
On- and off- resonance ARPES data
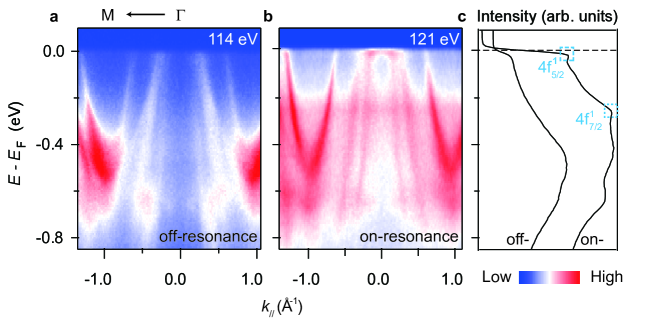
To enhance the electron photoemission matrix element, resonant ARPES measurements were conducted at the Ce 4-4 transition. Figs. 2a and 2b show the photoemission intensities taken off-resonance and on-resonance at 17 K, respectively. Emission from Co 3 and Ce 5 states dominates the off-resonance spectra, while Ce 4 emission is enhanced in the on-resonance data, as also shown by the integrated spectra in Fig. 2c. Two nearly flat features can be observed in the on-resonance data, corresponding to the and states[24, 25]. The feature near is actually the tail of the Kondo resonance peak above .
Temperature dependence of the electrons
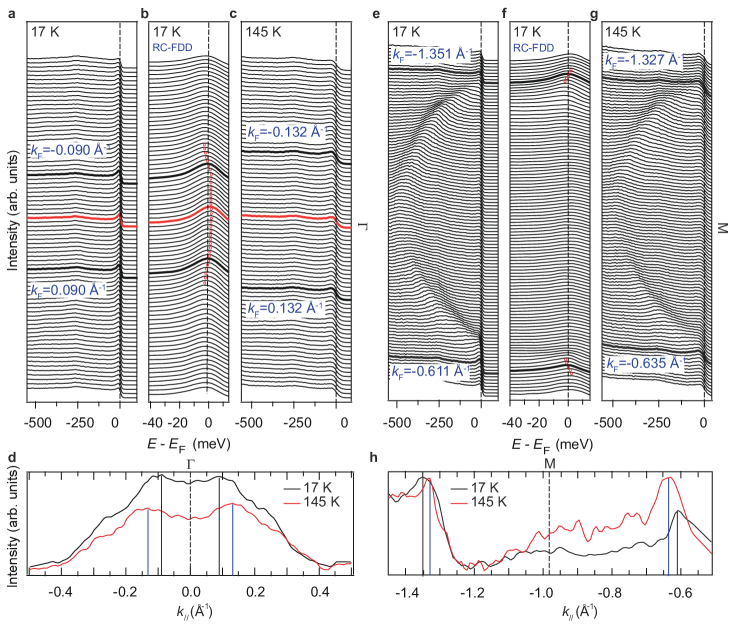
Figure. 3a shows the temperature-evolution of the resonant ARPES data along -. At high temperatures, the photoemission intensity is dominated by the strongly dispersive bands. Upon decreasing temperature, two weakly dispersive -electron features near and -280 meV gradually emerge. The temperature dependence can be further demonstrated by the energy distribution curves (EDCs) at in Fig. 3b. To access features above , the spectra are divided by the resolution-convoluted Fermi-Dirac distribution (RC-FDD) at corresponding temperatures and shown in Fig. 3c. One can identify three features located at 2, 9, and 30 meV above , labeled as , and , respectively. The peak spectral weight gradually increases with decreasing temperature from 190 K to 17 K (Fig. 3d, and caption). The temperature dependencies of the peaks at and appear non-monotonic — they are most prominent at 60 and 120 K, respectively.
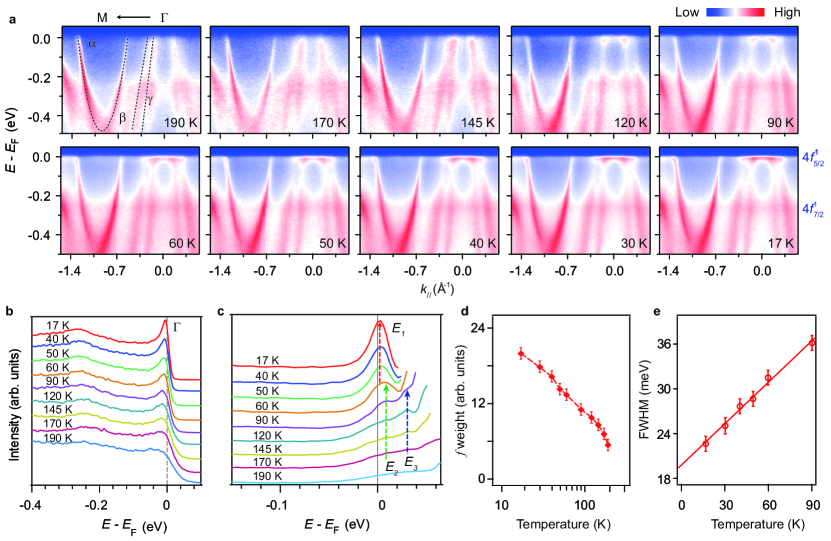
For CeCoIn5, one expects the six-fold degenerate state to be split into three Kramer’s doublets by the tetragonal crystal electric field (CEF). Each excited CEF doublet can participate in Kondo scattering processes and give rise to Kondo resonance satellite peaks shifted from the main Kondo resonance [26]. The peak separations, 7 meV, and 28 meV, are in excellent agreement with the CEF splittings estimated by neutron scattering [27]. Therefore, we conclude that the features found here are crystal-field-split states, with the main Kondo resonance peak at above , as expected for a Ce-based heavy fermion system [28].
It is commonly believed that the localized-to-itinerant transition sets in around , but our results demonstrate that the heavy band formation begins at much higher temperatures than previously conceived. For example, Fig. 3a shows that the feature near is already clearly discernible around 120 K, and Fig. 3d shows that the -electron weight increases upon cooling from the highest measured temperature (190 K). In fact, the extrapolation conducted in Fig. S2 of Supplementary suggests an onset around 27030 K. It is commonly accepted that the CEF splittings can enhance the Kondo temperature when the CEF level separations and Kondo energy scale are comparable [29, 26]. While it has been difficult to unambiguously identify CEF excitations in thermodynamic and transport measurements, particularly for CeCoIn5, our observation of Kondo satellite peaks (Fig. 3c) supports the analysis of the CEF excitations of Bauer et al. [27], and suggest that the CEF excitations are most likely responsible for the observed high onset temperature of the transition in CeCoIn5.
Figure. 3e plots the single-particle scattering rate of the main Kondo resonance, represented by the full-width at half-maximum (FWHM) of the peak at in Fig. 3c. Intriguingly, it shows a linear temperature dependence for K, and the zero-temperature width of 20 meV, obtained through extrapolating the fitting lines, is largely resolution-limited. A -linear scattering rate has been observed in many unconventional superconductors [30, 31, 32], most notably the optimally-doped cuprates[33].
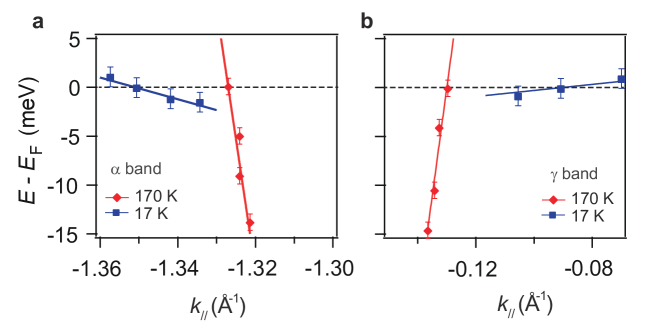
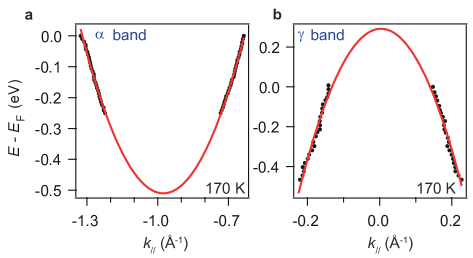
Figures 4a and 4b compare the photoemission intensity maps near taken at 170 K and 17 K, respectively. Clearly, the spectral weight is much enhanced around at low temperature, indicating that the -electrons participate in the Fermi surface formation. Figs. 4c and 4d give a detailed comparison. At 170 K, the bands exhibit almost linear dispersion with large slopes, while at 17 K, all three bands are bent by hybridization with the flat band that becomes coherent at low temperatures, and they become weakly dispersive near . Figs. 4e and 4f zoom into the vicinity of the Fermi crossing of at 60 K and 17 K respectively, where the data have been divided by the corresponding RC-FDDs. Because of the influence of the first excited CEF state, the dispersion above cannot be precisely traced in the 60 K data, however, one can clearly observe the Fermi velocity of decreasing when going from 60 to 17 K. Compared to the high temperature dispersion in Fig. 4c (also see Supplementary Fig. S3), the Fermi velocity of is reduced by a factor of at 17 K. The band behaves similarly, as shown in Figs. 4g-h. We note that due to the overlap of several bands, the hybridization of cannot be resolved, but it is expected to behave similarly to .
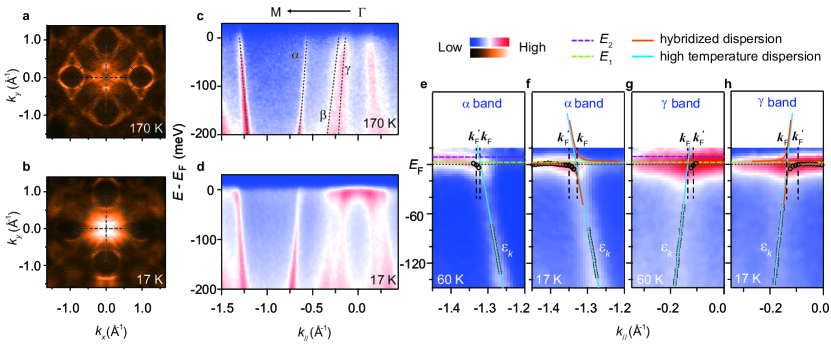
When the electrons are localized at high temperatures, the effective masses of the and bands can be obtained with the parabolic fits shown in Supplementary Fig. S4 of their dispersions over a several hundred meV window, which give = 0.88 , and = 0.24 ( being the free electron mass), as labeled respectively. Based on the Fermi velocity renormalization, is thus estimated to be 21.1 at 17 K, consistent with dHvA [36]. For the band, its Fermi velocity is renormalized by times at 17 K (Supplementary Fig. S3), which gives a effective mass of 24.5 at 17 K.
Phenomenologically, although the system is not a simple Fermi liquid, our 17 K data can be well described by a simple mean-field hybridization band picture based on the periodic Anderson model (PAM) [34] as presented in Figs. 4f and 4h, in which the energy dispersion is given by
| (1) |
where is the renormalized -level energy (the CEF ground state here), is the conduction-band dispersion at high temperatures (Fig. S3), and is the renormalized hybridization [35, 34]. A fit to this model gives =2 meV and =15 meV for both and , respectively, corresponding to a direct gap (defined as the minimal separation of two bands at the same momentum) of 30 meV. Therefore, the indirect gap is vanishingly small, if not zero (defined as the minimal separation of two bands in energy). The previous picture of a sizable indirect gap proposed by the STM study (and the hybridization model therein) is an overestimate. Because the tunneling matrix element for the conduction band is much larger than that of the electrons [12], STM mainly measures the direct gap, like optical conductivity [10].
In either Figs. 4e-f (for ) or Figs. 4g-h (for ), the Fermi crossing () departs further from the high temperature position () when the temperature is lowered from 60 K to 17 K, clearly demonstrating the gradual inclusion of additional electrons into the Fermi sea upon cooling into the heavy electron state. Based on the quantitative analysis in Supplementary Fig. S5, we estimate that the radius of the electron pocket expands by Å-1 between 145 K and 17 K, while the radius of the hole pocket shrinks by Å-1 in this temperature range. Considering the rather two-dimensional character of and assuming an isotropic expansion, we estimate that 0.058 electrons have been transferred from the local moment to the pocket at low temperature. Similarly, we estimate that 0.032 holes are removed from the central pocket. Since the Fermi surfaces in Figs. 4a and 4b do not show any other pronounced difference, we loosely estimate the total Fermi surface volume expansion to be about electrons in the localized-to-itinerant transition, consistent with the Ce valence measured by core-level x-ray absorption [37] and photoemission [38]. Our data indicate that the -electrons only become partially itinerant above 17 K, in contrast to various theories and calculations suggesting fully-itinerant -electrons at such moderately low temperatures and the dramatic change of Fermi surface topology [4].
Intermittent scaling and CEF excitations
The resistivity of CeCoIn5 shows a maximum at K and decreases almost linearly upon cooling down to the 2.3 K onset of superconductivity, and the quasiparticle scattering rate also exhibits a linear dependence on temperature (Fig. 3e). The -linear scattering rate in the cuprates has been interpreted in terms of a phenomenological marginal Fermi liquid theory and an underlying energy-over-temperature () scaling of the single-particle excitations that is associated with quantum-critical fluctuations [39, 40]. scaling and concomitant linear inverse lifetimes have also been established in a number of quantum critical heavy fermion compounds [41, 42, 43]. Such a ‘quantum critical’ scaling of the local conductance with a concomitant linear-in- broadening has been reported in a recent STM experiment on CeCoIn5 to set in below 60 K [12].
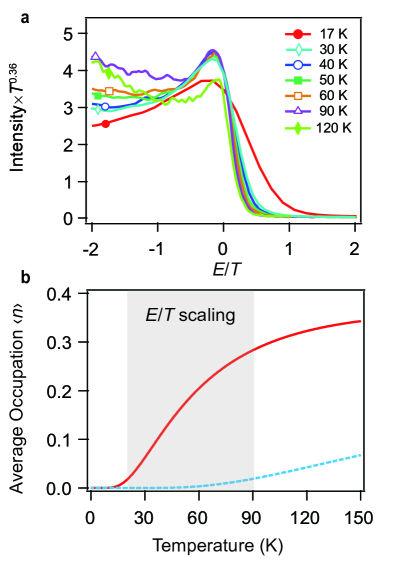
Our ARPES data obey scaling with a fractional exponent between 90 and 30 K as well (Fig. 5a) [44]. Notably, the 17 K and 120 K data fail to show scaling. The absence of scaling below roughly 20 K indicates that it does not underlie the linear-in-temperature behavior of the resistivity at these temperatures [45]. Instead, the anomalous temperature-dependent scaling seems to be related to the depopulation of the excited CEF levels in CeCoIn5. Fig. 5b shows the anticipated occupation of the CEF-split state, based on the obtained CEF splittings of 7 meV and 28 meV (see also Supplementary): below 20 K, essentially all electrons occupy the lowest CEF doublet; above 20 K, the occupation of the first excited state increases with temperature, undergoing a smooth slope change around 90 K and leveling off slowly at higher temperature. This suggests that the various marked changes below 20 K could be linked to the depletion of the excited CEF levels, including the absence of scaling of the spectral function, the slope change of the Seebeck coefficient at 20 K, which commonly signals lattice coherent Kondo scattering, and the strong temperature and field dependence of the Nernst coefficient below 20 K [21]. In addition, the onset of scaling as temperature is lowered coincides with the increase in the depopulation rate of the excited levels as temperature drops below the lowest CEF gap around 90 K.
Understanding the emergence of unconventional superconductivity and quantum criticality in heavy fermions is linked to an understanding of the low-energy scales in these systems [46]. Our results strongly suggest that CEF effects play an unexpectedly significant role in the localized-to-itinerant transition of CeCoIn5. The scope and significance of their involvement in the formation of the heavy fermion state have so far not been fully appreciated. They will not only enhance the Kondo temperature but also introduce additional characteristic temperatures, and may be ubiquitous to all the Ce-based rare earth intermetallics.
In conclusion, our results directly paint an experimental picture of the localized-to-itinerant transition in a prototypical periodic Kondo lattice system. Besides providing the first 3D Fermi surface mapping and experimental band structure of the heavy fermion compound CeCoIn5, we show how the localized electrons become partially itinerant and evolve into the heavy fermion state from much higher temperatures than 50 K, and how the Fermi volume increases along the way. The observed temperature dependence of the electronic structure unambiguously indicates the importance of CEF excitations. Thus, our results provide a nearly complete microscopic picture of how the heavy fermions in CeCoIn5 develop and evolve with temperature, which will be essential for building a microscopic theory of the unconventional superconductivity and quantum phase transitions in this compound.
Methods
Single crystals of CeCoIn5 were grown by an In self-flux method. Room-temperature powder x-ray diffraction measurements revealed that all the crystals are single-phase and crystallize in the tetragonal HoCoGa5 structure. The samples were then cleaved along the -axis in ultra-high vacuum before performing ARPES measurements. Soft X-ray ARPES data shown in Fig. 1 were taken at the Advanced Resonant Spectroscopies (ADRESS) beamline at the Swiss Light Source, with a variable photon energy and PHOIBOS-150 analyzer. The overall energy resolution was 70-80 meV, and the angular resolution was 0.07∘. The samples were cleaved and measured at 11 K under a vacuum better than mbar. All the data taken with the on-resonance 121 eV photons (except those in Figs. 3a-b) were obtained at the “Dreamline” beamline of the Shanghai Synchrotron Radiation Facility (SSRF) with a Scienta D80 analyzer. The samples were cleaved at 17 K. The vacuum was better than mbar at 17 K. The energy resolution was 17 meV, and the angular resolution was . The data in Figs. 3a-b were taken at Beamline I05-ARPES of the Diamond Light Source, equipped with a Scienta R4000 analyzer. The typical angular resolution was and the overall energy resolution was better than 16 meV. The vacuum was kept below mbar. The samples were cleaved at 170 K before performing ARPES experiments. All the data were taken with -polarized light.
References
- [1] Varma, C. M. et al. Mixed-valence compounds. 48, 219 (1976).
- [2] Stewart, G. R. et al. Heavy-fermion systems. 56, 755 (1984).
- [3] Shim, J. H. et al. Modeling the localized-to-itinerant electronic transition in heavy fermion system CeIrIn5. 7318, 1615 (2007).
- [4] Choi, H. C. et al. Temperature-dependent Fermi surface evolution in heavy fermion CeIrIn5. 108, 016402 (2012).
- [5] Mo, S. K. et al. Emerging coherence with unified energy, temperature, and lifetime scale in heavy fermion YbRh2Si2. 85, 241103(R) (2012).
- [6] Kummer, K. et al. Temperature-independent Fermi surface in the Kondo lattice YbRh2Si2. 5, 011028 (2015).
- [7] Fujimori, S. et al. Itinerant to localized transition of electrons in the antiferromagnetic superconductior UPd2Al3. 3, 618 (2007).
- [8] Shishido, H. et al. Fermi Surface, Magnetic and Superconducting Properties of LaRhIn5 and CeTIn5 (T: Co, Rh and Ir). 71, 162-173 (2002).
- [9] Settai. R, et al. Quasi-two-dimensional Fermi surfaces and the de Haas-van Alphen oscillation in both the normal and superconducting mixed states of CeCoIn5. 13, L627 (2001).
- [10] Singley, E. J. et al. Optical conductivity of the heavy fermion superconductor CeCoIn5. 65, 161101(R) (2002).
- [11] Burch, K. S. et al. Optical signatures of momentum-dependent hybridization of the local moments and conduction electrons in Kondo lattices. 75, 054523 (2007).
- [12] Aynajian, P. et al. Visualizing heavy fermions emerging in a quantum critical Kondo lattice. 486, 201 (2012).
- [13] Allan, M. P. et al. Imaging Cooper pairing of heavy fermions in CeCoIn5. 9, 468 (2013).
- [14] Zhou, B. B. et al. Visualizing nodal heavy fermion superconductivity in CeCoIn5. 9, 474 (2013).
- [15] Haule, K. et al. Dynamical mean-field theory within the full-potential methods: Electronic structure of CeIrIn5, CeCoIn5, and CeRhIn5. 81, 195107 (2010).
- [16] Koitzsch, A. et al. Band-dependent emergence of heavy quasiparticles in CeCoIn5. 88, 035124 (2013).
- [17] Koitzsch, A. et al. Hybridization effects in CeCoIn5 observed by angle-resolved photoemission. 77, 155128 (2008).
- [18] Koitzsch, A. et al. Electronic structure of CeCoIn5 from angle-resolved photoemission spectroscopy. 79, 075104 (2009).
- [19] Paschen, S. et al. Kondo destruction in heavy fermion quantum criticality and the photoemission spectrum of YbRh2Si2. 400, 17-22 (2016).
- [20] Petrovic, C. et al. Heavy-fermion superconductivity in CeCoIn5. 13, L337 (2001).
- [21] Bel, R. et al. Giant Nernst in CeCoIn5. 92, 217002 (2004).
- [22] Strocov, V. N. et al. Three-Dimensional Electron Realm in VSe2 by Soft-X-Ray Photoemission Spectroscopy: Origin of Charge-Density Waves. 109, 086401 (2012).
- [23] Pfleiderer, C. et al. Superconducting phases of -electron compounds. 81, 1551 (2009).
- [24] Fujimori, S. -i. et al. Nearly localized nature of electrons in CeTIn5 (T= Rh, Ir). 67, 144507 (2003).
- [25] Fujimori, S. -i. et al. Direct observation of a quasiparticle band in CeIrIn5: An angle-resolved photoemission spectroscopy study. 73, 224517 (2006).
- [26] Kroha, J. et al. Structure and transport in multi-orbital Kondo systems. 18, 69-72 (2003).
- [27] Bauer, E. D. et al. Crystalline electric field excitations in the heavy fermion superconductor CeCoIn5. 95, 7201 (2004).
- [28] We note that the heights of the satellite CEF peaks appear stronger than that of the main one at high temperatures, which may be due to matrix element effects or a divergence artifact from the division by RC-FDD high above .
- [29] Cornut, B. et al. Influence of the crystalline field on the Kondo effect of alloys and compounds with cerium impurities. 5, 4541 (1972).
- [30] Daou, R. et al. Linear temperature dependence of resistivity and charge in the Fermi surface at the pseudogap critical point of a high-Tc superconductor. 5, 31-34 (2009).
- [31] Dai, Y. M. et al. Hidden T-linear scattering rate in Ba0.6K0.4Fe2As2 revealed by optical spectroscopy. 111, 117001 (2013).
- [32] Bruin, J. A. N. et al. Similarity of scattering rates in metals showing T-linear resistivity. 339, 804 (2013).
- [33] Valla, T. et al. Evidence of quantum critical behavior in the optimally doped cuprate Bi2Sr2CaCu2O. 285, 2110 (1999).
- [34] A. C. Hewson, The Kondo Problem to Heavy Fermions (Cambridge University Press, Cambridge, 1993).
- [35] Im, H. J. et al. Direct observation of dispersive Kondo resonance peaks in a heavy-fermion system. 100, 176402 (2008).
- [36] Hall, D. et al. Fermi surface of the heavy-fermion superconductor CeCoIn5: The de Haas-van Alphen effect in the normal state. 64, 212508 (2001).
- [37] Booth, C. H. et al. Electronic structure and -orbital occupancy in Yb-substituted CeCoIn5. 83, 235117 (2011).
- [38] Treske, U. et al. X-ray photoemission study of CeTIn5 26, 205601 (2014).
- [39] Varma, C. M. et al. Phenomenology of the normal state of Cu-O high-temperature superconductors. 63, 1996 (1989).
- [40] Varma, C. M. et al. Quantum-critical flucuations in 2D meatals: strange metals and superconductivity in antiferromagnets and in cuprates. 48, 219 (2016).
- [41] Aronson, M. C. et al. Non-Fermi-liquid scaling of the magnetic response in UCu5-xPdx (x=1, 1.5). 75, 725 (1995).
- [42] Schröder, A. et al. Scaling of magnetic fluctuations near a quantum phase transition. 80, 5623 (1998).
- [43] Friedemann, S. et al. Fermi-surface and dynamical scaling near a quantum-critical point. 107, 14547 (2010).
- [44] Such an scaling could be observed at momenta where the states dominate the spectra near . To obtain the single particle spectral function from the data shown in Fig. 3b, the data need to be divided by the Fermi Dirac distribution function. This, however, is a function of only and cannot spoil the scaling properties shown in Fig. 5b.
- [45] It may be worthwhile to investigate if and how the scaling observed here relates to the quantum critical fluctuation spectrum observed in CeCoIn5 at much lower temperatures and to that of related systems.
- [46] Stockert, O. et al. Superconductivity in Ce- and U-based ”122” heavy fermion compounds. 81, 011001 (2012).
- [47] Ernst, S. et al. Emerging local Kondo screening and spatial coherence in the heavy-fermion metal YbRh2Si2. 474, 362 (2011).
- [48] Ernst, S. et al. Crystalline electric field excitations of the non-Fermi-liquid YbRh2Si2. 378-380, 157 (2006).
Acknowledgments
We gratefully acknowledge enlightening discussions with Prof. Y. F. Yang, J. X. Zhu, and the experimental support of Dr. M. Hoesch, Dr. T. Kim, Ms. X. P. Shen, and Dr. Y. J. Yan. This work is supported in part by the National Science Foundation of China (Grant No. 11504342, U1630248), National Key R&D Program of the MOST of China (Grant No. 2016YFA0300200), Science Challenge Program of China, Science and Technology Commission of Shanghai Municipality (Grant No. 15ZR1402900), and Diamond Light Source for time on beamline I05 under Proposal No. SI11914. The soft x-ray ARPES experiment has been performed at the SX-ARPES endstation of the ADRESS beamline at the Swiss Light Source, Paul Scherrer Institute, Switzerland. F. Bisti is supported by the Swiss National Science Foundation.
Author contributions
Q.C., D.X., X.N., J.J., H.X. and C.W. performed ARPES measurements, Z.D., K.H., L.S., Y.Z., H.L. and H.Y. grew single crystals, V.S., M.S., F.B., T.S., Y.H. and P.D. supported the synchrotron experiments, Q.C., R.P., S.K. and D.F. analyzed the data. D.F. and S.K. wrote the paper, D.F. and X.L. are responsible for the infrastructure, project direction and planning.
Supplementary material for: Direct observation of how the heavy fermion state develops in CeCoIn5
Abstract
In this supplementary material, we present simulation of the peak-width correction (Fig. S1), determination of the onset temperature of the localized-to-itinerant transition (Fig. S2), linear fits of the band dispersions near (Fig. S3), parabolic fit of the large scale dispersion at 170 K (Fig. S4), and quantitative analysis of the enlargement of the and bands (Fig. S5). We also present detailed statements of the “CEF excitations and the temperature dependence of the CEF level occupation” and “Implications for YbRh2Si2”.
Simulation of the peak-width correction
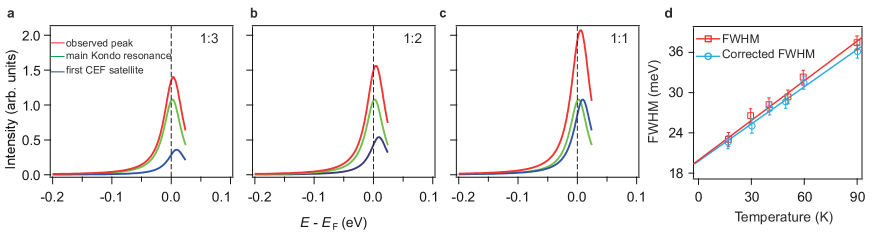
The main peak observed in Fig. 3c has contributions from both the main Kondo resonance peak (the ground CEF state) and the first CEF excitation satellite. To estimate the influence of the first CEF excitation to the FWHM of the main Kondo resonance peak, we performed a simulation by considering the main Kondo resonance peak located at 2 meV above and the first CEF excitation satellite located 7 meV higher. We assume that they have the same width, which takes the experimental value. When the intensity ratio between the first CEF excitation and the main Kondo resonance peak is 1:3, 1:2 and 1:1, we found that the FWHM measured from twice the left half-width at half-maximum of the combined peak is only 1.3, 1.7, and 2.1 meV larger than that of the main Kondo resonance peak, respectively (see Fig. S1). This illustrates that the experimental FWHM estimated in this way largely reflects the FWHM of the main Kondo resonance peak.
This also provides a way to obtain a more accurate FWHM of the main Kondo resonance. Fig. S1d shows both the temperature dependence of the FWHM directly measured from the main peak in Fig. 3c, and that of the corrected FWHM for the main Kondo resonance. The latter is also presented in Fig. 3e.
Determination of the onset temperature of the localized-to-itinerant transition
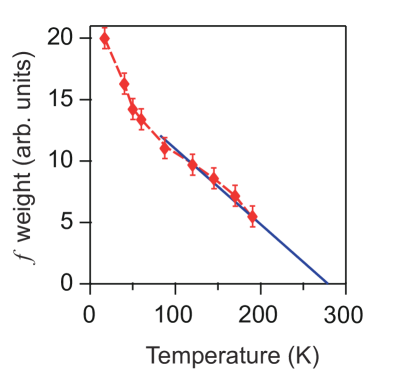
The heavy-electron states develop with decreasing temperature, enhancing the -electron spectral weight (Fig. 3d). Such a process started from the highest measured temperature. To estimate the onset of the localized-to-itinerant transition, we re-plot the data in Fig. 3d on a linear-linear scale and extrapolate the data at high temperatures with a linear fit, as shown in Fig. S2. We find that the spectral weight reaches zero at 27030 K (Fig. S2), which is the estimated onset temperature of the localized-to-itinerant transition.
Linear fits of the band dispersions near
Linear fits are conducted for the dispersions of the conduction bands ( and ) near at 17 and 170 K. The high temperature fast dispersion was obtained by tracking the MDCs. The dispersion data at 17 K are derived from the EDCs after dividing by the corresponding resolution-convoluted Fermi Dirac distribution (RC-FDD) (examples can be found in Fig. S3 below). Due to the flatness of the band, weak spectral weight, thermal broadening effects, and particularly the influence of the first excited CEF state, the dispersion data in the intermediate temperature range cannot be accurately determined near . The Fermi velocity for the band is 2.67 eVÅ at 170 K, and it is reduced by times at 17 K (Fig. S3a), while for the band, the Fermi velocity is 3.14 eVÅ at 170 K, and it is reduced by times at 17 K after the weakly dispersive hybridized band is formed (Fig. S3b).
Parabolic fit of the large scale dispersion at 170 K
In order to estimate the effective masses of the and bands at high temperature, we use parabolic curves to fit their high temperature dispersion (Fig. S4). The relationship between Ek and is Ek=4.34+8.47+3.62 for , and Ek=-15.83+0.12+0.29 for , which gives m∗=0.88 me for and 0.24 me for . Since the fit involves the dispersion over a large window of several hundreds of meV, where the electron contribution is negligible, the fitted value represents the effective mass of the corresponding band when electrons are completely localized at high temperatures. Moreover, we note that the temperature dependence of the experimental dispersions is very weak at high temperatures, when the electron contribution is negligible.
Based on this and the Fermi velocity renormalization obtained above, one can estimate the effective mass at 17 K in the coherent state to be about 21.1 for the band, and 24.5 for the band.
Quantitative analysis of the enlargement of the and bands
The Fermi surface expands in the heavy electron state, due to the inclusion of additional electrons into the Fermi sea. Fig. S5 presents a detailed quantitative analysis of the electron pocket around and the hole pocket around . Figs. S5a and S5b plot the EDCs of the band taken at 17 K along - and the corresponding EDCs after dividing by the RC-FDD, respectively. The dispersion of the hybridized band is clearly observed in Fig. S5b, and the Fermi momentum at low temperature can be determined when the peak passes , which is labeled by the thick black lines. Alternatively, the same Fermi momenta could be obtained through the MDC maxima (Fig. S5d). At high temperature, the s could be determined from the MDC maxima. Consequently, the radius of the hole pocket is estimated to be Å smaller at 17 K for the band, while for the band, the radius of this electron pocket is estimated to be Å larger at 17 K. Considering the rather two-dimensional character of the band and assuming an isotropic expansion, the enlargement indicates that about 0.058 electrons have been transferred from the local moment to pocket at low temperature.
CEF excitations and the temperature dependence of the CEF level occupation
The Kondo energy scale increases exponentially with the degeneracy of the 4 ground state. Such a case would correspond to a vanishing CEF excitation gap . On the other hand, for sufficiently large splitting the effect of the doublet on the Kondo energy scale is negligible. It has been well established that the presence of CEF excitations with the gaps of the order of can also result in a considerable enhancement of the low-energy scale [29, 26]. Our results demonstrate that even in CeCoIn5, where the common belief has been that CEF excitations only have a weak influence on the low-energy state, the CEF excitation gaps lead to a fine structure in the Kondo resonance. The onset of heavy band formation is reflected in the dispersion at temperatures well above the coherence temperature, i.e. the maximum in the resistivity. Our results suggest that the role played by CEF levels goes beyond the simple enhancement of the Kondo temperature.
Our observation of the Kondo satellite peaks at energies meV and meV is in good agreement with the findings of Bauer et al. [27] and confirm their analysis. Following Bauer et al., the CEF doublets in the basis of the state are
| (S.1) | |||||
The widths and heights of the additional Kondo satellite peaks strongly depend on the elements of the hybridization matrix, i.e. on the various overlaps between the crystal field states and the local conduction electron states. From the characteristic shapes of the orbitals in Eq. (CEF excitations and the temperature dependence of the CEF level occupation) it seems natural to expect that the two-dimensional band will have larger overlap with and than . This expectation would be in line with the observed smaller mass enhancement of the band as compared to the band. DMFT+LDA might be able to confirm this expectation. Moreover, estimating the enhancement factor of the Kondo energy scale by CEF effects requires a knowledge of the CEF splittings and the full hybridization matrix that describes the coupling between the 4 and conduction electrons [26]. This also requires further DMFT+LDA calculations.
Based on the energies obtained for the two CEF excitation gaps, we can estimate the average occupation of each of the doublets under the assumption that the valence of Ce in CeCoIn5 remains 3+, independent of temperature for the temperature range considered here.
Although the -level occupation in the presence of a non-vanishing hybridization is not a good quantum number in the Anderson model, the average occupation in the single-level Anderson impurity model is only a weak function of temperature. This allows us to estimate the average occupation of the CEF split levels in the local moment regime, where . Similarly, the Ce valence in CeCoIn5 is only weakly temperature-dependent and we can estimate the average occupation of the CEF split levels in the multiplet using
| (S.2) |
Here, meV and meV are the CEF splittings inferred from Fig. 3c of the main text. () represents the average occupation of the first (second) excited CEF level. As shown in Fig. 5b, changes considerably in the temperature window of our experiment while the occupation of the highest CEF level (dashed line in Fig. 5b) can be neglected. Interestingly, the slope of Eq. (S.2) for changes at K and more smoothly at around K which corresponds to the temperatures where the spectrum near the Fermi energy changes, see Fig. 5a. It would be interesting to analyze optical conductivity measurements in terms of scaling and its implications for vertex corrections.
Implications for YbRh2Si2
Our results may also shed new light on the apparent temperature independence of the Fermi surface in YbRh2Si2 reported in Ref. [6]. The CEF excitations of YbRh2Si2 have been discussed in Ref. [48]. The concomitant Kondo satellite peaks in YbRh2Si2 have been seen in STM measurements [47], in good agreement with [48]: meV, meV and meV. The analysis of Yb-based compounds is complicated by the hole-character of the 4-state i.e. the large number of electrons in the 4-shell. Nonetheless, it seems reasonable to expect that the apparent temperature independence reported in [6] is related to the larger CEF gaps meV K of YbRh2Si2 as compared to CeCoIn5. It thus seems imperative to extend the temperature range studied in [6] to higher temperatures.