epj \woctitleSeismology of the Sun and the Distant Stars 2016
DK-8000 Aarhus C, Denmark
On the detectability of solar-like oscillations with the NASA TESS mission
Abstract
The upcoming NASA TESS mission will perform an all-sky survey for planets transiting bright nearby stars. In addition, its excellent photometric precision will enable asteroseismology of solar-type and red-giant stars. We apply a newly developed detection test along a sequence of stellar evolutionary tracks in order to predict the detectability of solar-like oscillations with TESS.
1 Introduction
The Transiting Exoplanet Survey Satellite111https://tess.gsfc.nasa.gov (TESS; TESS1, ) is a NASA-sponsored Astrophysics Explorer mission that will perform an all-sky survey for planets transiting bright nearby stars. Its launch is currently scheduled for December 2017, with science operations due to start in March 2018. During the 2-year primary mission, TESS will monitor the brightness of several hundred thousand main-sequence, low-mass stars over intervals ranging from one month to one year, depending mainly on a star’s ecliptic latitude. Monitoring of these pre-selected target stars will be made at a cadence of 2 min. Additionally, full-frame images (FFIs) will be recorded every 30 min, which will allow a wider range of stars to be searched for transits. Being 10–100 times brighter than Kepler targets and distributed over a solid angle that is nearly 300 times larger, TESS host stars will be well suited for follow-up radial-velocity/spectroscopic observations from the ground. TESS is expected to detect approximately 1700 transiting planets from pre-selected target stars TESS2 . Analysis of the FFIs will lead to the additional detection of several thousand planets orbiting stars that are not among the pre-selected targets.
Furthermore, TESS’s excellent photometric precision, combined with its fine time sampling and long intervals of uninterrupted observations, will enable asteroseismology of solar-type and red-giant stars, whose dominant oscillation periods range from minutes to hours. In Section 2, we apply a newly developed detection test along a sequence of stellar evolutionary tracks in order to predict the detectability of solar-like oscillations with TESS across the Hertzsprung–Russell (H–R) diagram.
2 Detectability of solar-like oscillations across the H–R diagram
New images will be acquired by each of the four TESS cameras every 2 seconds. However, due to limitations in onboard data storage and telemetry, these 2-sec images will be stacked (before being downlinked to Earth) to produce two primary data products with longer effective exposure times: (i) subarrays of pixels centered on several hundred thousand pre-selected target stars will be stacked at a 2-min cadence, while (ii) FFIs will be stacked every 30 min.
Up to 2-min-cadence slots (or the equivalent to of the pre-selected target stars) will be allocated to the TESS Asteroseismic Science Consortium (TASC) over the course of the mission. In addition, a number of slots (notionally 1500) with faster-than-standard sampling, i.e., , will be reserved for the investigation of asteroseismic targets of special interest (mainly compact pulsators and main-sequence, low-mass stars).
In Campante16 we developed a simple test to estimate the detectability of solar-like oscillations in TESS photometry of any given star. This test is in turn based on the test previously developed by Chaplin11 to estimate the detectability of solar-like oscillations in any given Kepler target, which looked for signatures of the bell-shaped power excess due to the oscillations. In what follows, we apply the newly developed detection test along a sequence of stellar evolutionary tracks in order to predict the detectability of solar-like oscillations.
Figures 1–3 illustrate the detectability of solar-like oscillations with TESS. We focus on that portion of the H–R diagram populated by solar-type and (low-luminosity) red-giant stars, bound at high effective temperatures by the red edge of the Scuti instability strip. The detection code was applied along a sequence of solar-calibrated stellar evolutionary tracks spanning the mass range 0.8– (in steps of ).
In Figure 1 we consider two different observing lengths and a cadence of . Further assuming a systematic noise level222This is an engineering requirement imposed on the design of the TESS photometer and not an estimate of the anticipated systematic noise level on 1-hour timescales. In the actual data it is expected that this systematic term will be rather small in the frequency range occupied by the oscillations. Herein, we explore the implications of having (ideal case) and (regarded as a worst-case scenario). of , detection of solar-like oscillations in main-sequence stars will not be possible for . Increasing the observing length to (relevant for stars near the ecliptic poles) may lead to the marginal detection of oscillations in (very bright) main-sequence stars more massive than the Sun. In both cases, detection of oscillations in subgiant and red-giant stars is nonetheless made possible, owing to their higher intrinsic amplitudes. As one would expect, this situation is significantly improved as the systematic noise level is brought down to , with detections now being made possible for the brightest main-sequence stars over a range of masses.
The longer 30-min cadence is considered in Figures 2 and 3, where we have assumed a systematic noise level of . FFIs will allow detecting oscillations in red-giant stars down to relatively faint magnitudes. Furthermore, it becomes apparent from Figure 3 that it should be possible to detect oscillations in the super-Nyquist regime for the brightest red giants.
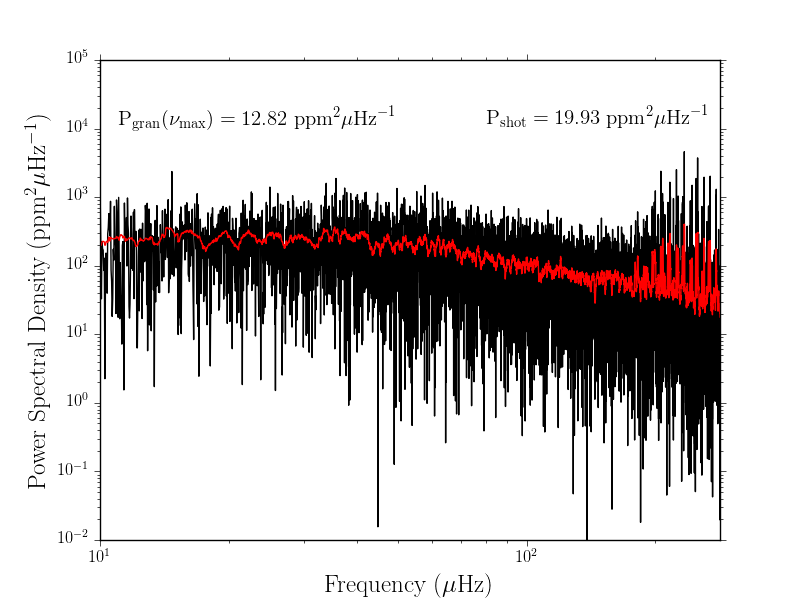
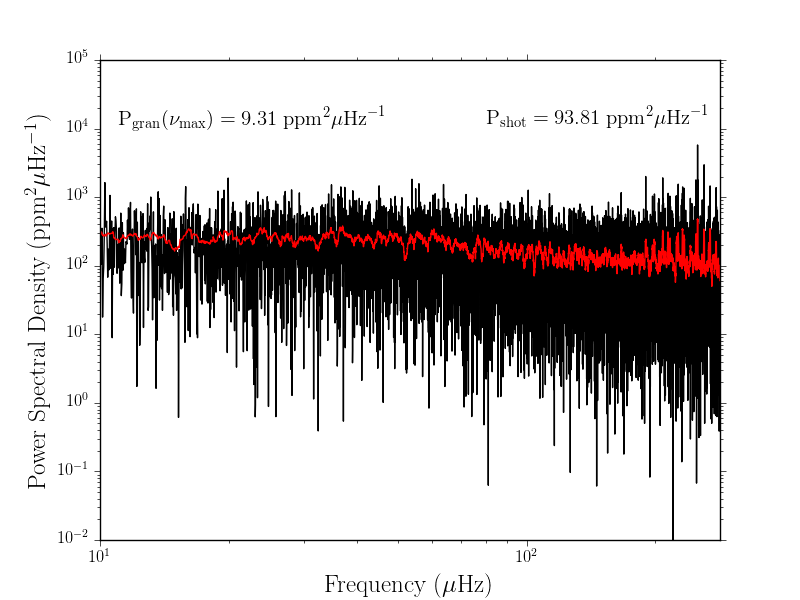
In Figure 4 we provide a sneak peek at a power spectrum of a low-luminosity red-giant star as it would be observed by TESS at the 30-min cadence. The two panels in this figure show the power spectra of Kepler-56 as observed both by Kepler (in its long-cadence mode) and TESS based on 1 year of observations. As can be seen, oscillations are easily identified in either power spectrum. Notice, however, that while the granulation power and shot noise levels are commensurate for the Kepler power spectrum, the shot noise level is one order of magnitude higher than the granulation power in the case of the TESS power spectrum. This is mostly due to the smaller (by 2 orders of magnitude) effective collecting area of the individual TESS cameras.


3 Summary and discussion
In Campante16 we developed a simple test to estimate the detectability of solar-like oscillations in TESS photometry of any given star. We applied this detection test here along a sequence of stellar evolutionary tracks in order to predict the detectability of solar-like oscillations across the H–R diagram (Section 2). Importantly, we note that bright subgiants are attractive targets for the 2-min-cadence slots reserved for asteroseismology, even though they are far from optimal for transiting planet detection. We should be able to use parallaxes from the ongoing Gaia mission Gaia to deliberately target these bright subgiants.
The authors would like to thank the organizers of the “Seismology of the Sun and the Distant Stars 2016” conference, a joint TASC2/KASC9 workshop – SPACEINN & HELAS8 conference, where the author presented an invited talk on the contents of these proceedings. The author acknowledges the support of the UK Science and Technology Facilities Council (STFC). Funding for the Stellar Astrophysics Centre is provided by The Danish National Research Foundation (Grant DNRF106).
References
- (1) G.R. Ricker, J.N. Winn, R. Vanderspek, D.W. Latham, G.Á. Bakos, J.L. Bean, Z.K. Berta-Thompson, T.M. Brown, L. Buchhave, N.R. Butler et al., Journal of Astronomical Telescopes, Instruments, and Systems 1, 014003 (2015)
- (2) P.W. Sullivan, J.N. Winn, Z.K. Berta-Thompson, D. Charbonneau, D. Deming, C.D. Dressing, D.W. Latham, A.M. Levine, P.R. McCullough, T. Morton et al., ApJ 809, 77 (2015)
- (3) T.L. Campante, M. Schofield, J.S. Kuszlewicz, L. Bouma, W.J. Chaplin, D. Huber, J. Christensen-Dalsgaard, H. Kjeldsen, D. Bossini, T.S.H. North et al., ApJ 830, 138 (2016)
- (4) W.J. Chaplin, H. Kjeldsen, T.R. Bedding, J. Christensen-Dalsgaard, R.L. Gilliland, S.D. Kawaler, T. Appourchaux, Y. Elsworth, R.A. García, G. Houdek et al., ApJ 732, 54 (2011)
- (5) Gaia Collaboration, ArXiv e-prints (2016), 1609.04153