Breakdown of a Benchmark Score Without
Internal Analysis of Benchmarking Program
Abstract
A breakdown of a benchmark score is how much each aspect of the system performance affects the score. Existing methods require internal analysis on the benchmarking program and then involve the following problems: (1) require a certain amount of labor for code analysis, profiling, simulation, and so on and (2) require the benchmarking program itself. In this paper, we present a method for breaking down a benchmark score without internal analysis of the benchmarking program. The method utilizes regression analysis of benchmark scores on a number of systems. Experimental results with 3 benchmarks on 15 Android smartphones showed that our method could break down those benchmark scores even though there is room for improvement in accuracy.
Index Terms:
benchmarking, performance modeling, execution time estimation, regression analysis, confirmatory factor analysisI Introduction
In this paper, we present a method for breaking down a benchmark score without internal analysis of the benchmarking program. The method quantifies a portion of a number of aspects of the system performance with regression analysis using number of systems.
Benchmarking is a qualitative or quantitative measurement of how well the program has been executed in a certain metric. A value obtained from benchmarking is called a benchmark score or solely score. A program executed in benchmarking is called a benchmarking program or solely program. The terms benchmarking, benchmark score, and benchmarking program are sometimes abbreviated to benchmark.
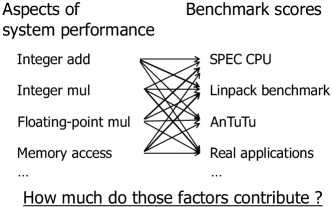
Our goal here is breakdown of a benchmark score as shown in Figure 1. Breakdown of a benchmark score is an analysis on how much each aspect of the system performance affects the score. Examples of those aspects are integer arithmetic and memory access. Similar concepts such as performance modeling and execution time estimation are considered to be a kind of breakdown. Breakdown of a benchmark score can be utilized for detecting bottlenecks, optimizing programs, and improving architectures [1]. It can be also applied for identifying characteristics of a program, comparing systems, comparing programs quantitatively, and evaluating a bias of a system ranking.
Existing breakdown methods require internal analysis on the benchmarking program and then involve the following problems: (1) require a certain amount of labor for code analysis, profiling, simulation, and so on and (2) require the benchmarking program itself. Our contribution presented in this paper is a breakdown method without those problems. The proposed method breaks down a benchmark score without internal analysis of the benchmarking program. It utilizes regression analysis of benchmark scores on a number of systems.
To evaluate validity of the method, we applied the method to 3 benchmarks on 15 Android smartphones. The method could break down obtained benchmark scores even though there is room for improvement in accuracy.
The rest of this paper is structured as follows. Section II describes existing methods and their problems. Section III presents our method.In Section IV, we evaluate validity of the method by applying the method to benchmarks. Finally, we summarize our contribution and describe future work in Section V.
II Existing methods and problems
Existing breakdown methods are based on subprogram execution [1], static code analysis [2], execution trace analysis [3], profiling, simulation and so on.
Without internal analysis, such as profiling, on a benchmarking program, any existing method cannot break down a benchmark score. This is because existing methods run a target benchmark on the only one system and then there is only one sample of relationships between aspects of system performance and the score. Given only one sample, we can get no information about the relationships.
Existing methods require internal analysis on the benchmarking program and then involve the following problems: (1) require a certain amount of labor for code analysis, profiling, simulation, and so on and (2) require the benchmarking program itself. Especially, (2) is considered to be a critical problem because (2) makes it impossible to break down a benchmark score generated by a benchmark which restricts reverse engineering.
III Breakdown of a benchmark score by regression analysis
In this section, we describe a method for breaking down a benchmark score of arbitrary benchmark without internal analysis on the benchmarking program.
As we describe in Section II, we have to analyze inside of a benchmarking program if there is only one sample of relationships between aspects of system performance and a benchmark score. However, number of such samples enable regression analysis based on them and we no longer need to analyze inside of the benchmarking program. Our proposed method utilizes regression analysis, and multiple linear regression analysis especially in the experiment presented in Section IV.
Explanatory variables for regression are merits in aspects of system performance and a dependent variable is a benchmark score. Examples of the aspects are integer arithmetic and memory access. It should possible to estimate the merits in the aspects by running an adequate set of small benchmarks or microbenchmarks [3]. We prepare such a set of microbenchmarks by ourselves for the experiment in Section IV. There should be a better set of microbenchmarks and its development or collection is an open problem.
It is possible to obtain multiple samples by running the same set of benchmarks on multiple systems. Our proposed method premises that it is possible to obtain benchmark scores on multiple systems. Published scores are available for widely-used benchmarks such as SPEC benchmarks, and we can run benchmarking programs by ourselves of course.
The breakdown process described above is considered as confirmatory factor analysis (CFA). The factors are merits in aspects of system performance.
IV Evaluation
In this section, we confirm that the proposed method is practical by applying the method to real benchmarks and systems.
IV-A Experiment
In this experiment, we quantify aspects of system performance by developing and running microbenchmarks. And then we break down scores of 3 benchmarks into the aspects by regression analysis.
First, we describe the following points which we must define to apply our method: (i) target systems, (ii) target benchmarks of breakdown, (iii) microbenchmarks used to quantify each aspect of system performance. After that, we describe other information about details of this experiment.
IV-A1 Target systems
We chose smartphones as target systems because smartphones meet the following two conditions: (1) we can obtain enough samples by preparing number of systems which specification differs from each other by utilizing a certain remote service, (2) such remote services do not utilize virtual machines to offer their service. As a proof, we describe the characteristics of supercomputers, commodity computers, and smartphones.
We can hardly prepare number of supercomputers due to their availability. Therefore supercomputers meet neither (1) nor (2).
In the case of commodity computers, tens of systems can be prepared through the remote services such as Amazon Elastic Compute Cloud (EC2) [4] and Google Compute Engine [5]. Remote services of commodity computers, however, often utilize hypervisors such as Xen [6] to offer their service; therefore the services are not suited for benchmarking. This is because programs running on hypervisors contain unignorable overhead [7]. Therefore commodity computers meet (1) but not (2).
In the case of smartphones, tens of systems can also be prepared through remote services such as Amazon Device Farm [8]. As of February 2016, Amazon Device Farm offers 18 iOS devices and 66 Android devices if we regard devices which differ from each other in its career or its OS version as a same device ***https://aws.amazon.com/device-farm/device-list/. In addition, in contrast to remote services offering commodity computers, Amazon Device Farm do not utilize hypervisors to offer its service and then is suited to benchmarking since programs running on its service do not contain overhead. Therefore smartphones meet both (1) and (2).
Smartphones used in the experiment. In this experiment, we rented 15 Android devices shown in Table I from Amazon Device Farm and experimented with them.
[htb] Device name (and career name) Chipset (or processor)*1 ISA*1 OS version Amazon Fire Phone (unknown) A32 4.4.4 ASUS Memo Pad 7 (Intel Atom Z3745) x86-64 5.0 ASUS Nexus 7 - 2nd Gen Qualcomm APQ8064 A32 6.0 HTC One M7 (AT&T) (unknown) A32 4.4.2 HTC One M8 (AT&T) Qualcomm MSM8974AB A32 4.4.4 Huawei Nexus 6P Qualcomm MSM8994 A64 6.0 LG G3 (AT&T) Qualcomm MSM8974AC A32 5.0.1 LG G4 (Verizon) Qualcomm MSM8992 A64 5.1 Motorola Moto G (AT&T) Qualcomm MSM8226 A32 4.4.4 Motorola Nexus 6 Qualcomm APQ8084 A32 6.0 Samsung Galaxy Note 4 (AT&T) Qualcomm APQ8084 A32 5.0.1 Samsung Galaxy Note 5 Samsung Exynos 7420 A64 5.1.1 Samsung Galaxy S4 (AT&T) (unknown) A32 5.0.1 Samsung Galaxy S6 Edge+ (AT&T) Samsung Exynos 7420 A64 5.1.1 Sony Xperia Z3 (GSM) (unknown) (unknown) 4.4.4
-
*1
Retrieved by executing cat /proc/cpuinfo on each device.
IV-A2 Target benchmarks
SPEC CPU2006 [9] is a widely-used benchmark suite to measure processor performance. We prepared target benchmarks by porting a part of the SPEC CPU2006 benchmarks to Android devices. As of February 2016, the newest version of SPEC CPU2006 is V1.2. In this experiment, we use V1.1 because we could not obtain V1.2 due to no response from SPEC. V1.2 improves compatibility, stability, documentation and ease of use and the results with V1.2 and V1.1 are still compatible.
SPEC CPU2006 is composed of 29 benchmarks. In this experiment, however, we used the only benchmarks each of which is written in C due to portability issues. Table II shows the benchmarks we used and Table III shows the environments and the compiler options with which we compiled the benchmarks.
Each of benchmarking programs in SPEC CPU2006 has three workloads; train (data for feedback-directed optimization), test (data for checking functionality), and ref (the real data set required for result reporting). Because ref caused a memory allocation error in some Android devices, we used test and a custom workload based on ref in this experiment.
[htb] Name and abstract Program details Workload 429.mcf Combinatorial Optimization Vehicle scheduling. Uses a network simplex algorithm to schedule public transport. test 462.libquantum Quantum Computing Simulates a quantum computer, running Shor’s polynomial-time factorization algorithm. custom *1 470.lbm Fluid Dynamics Implements the "Lattice-Boltzmann Method" to simulate incompressible fluids in 3D. test
-
*1
462.libquantum requires (a) size of problem and (b) random seed as input parameters. The workload test takes (a) 33 and (b) 5. The workload ref takes (a) 1397 and (b) 8. We used a custom workload which takes (a) 130 and (b) 8 because test workload resulted in too short execution time and ref workload resulted in too long execution time.
In our implementation, there is a bit of native code embedded into the Android application which calls main function of the benchmarking program with the command-line arguments defined by SPEC CPU2006.
IV-A3 Microbenchmarks for quantification of system performance
In this experiment, we implemented several microbenchmarks considered to be appropriate by qualitatively investigating programs of the target benchmarks. Table IV shows our implemented microbenchmarks.
| OS (kernel) | Linux 3.2.0-4-686-PAE |
|---|---|
| Android NDK | Revision 10e (for Linux x86) |
| gcc Version (for x86-64) | 4.8 |
| gcc Version (for A32) | 4.9 |
| gcc Version (for A64) | 4.9 |
| gcc Options (excerpt) | -O0 -std=c99 |
[htb] Name Program details Process an empty loop composed of comparison instructions, branch instructions, and integer add instructions times. Process a loop containing integer add instructions without memory access times. Process a loop containing integer multiply instructions without memory access times. Process a loop containing interleaved execution of integer add instructions without memory access and integer multiply instructions without memory access times. Process a loop containing integer division times*1. Process a loop containing integer store instructions which have the same destination virtual address. times. Process a loop containing interleaved execution of integer store instructions and integer load instructions which have the same destination/source virtual address times. Process a loop containing floating point add instructions without memory access times*2. Process a loop containing floating point multiply instructions without memory access times*2. Process a loop containing floating point divide instructions without memory access times*2. Process a loop containing floating point store instructions which have the same destination virtual address. times*2. Process a loop containing interleaved execution of floating point store instructions and floating point load instructions which have the same destination/source virtual address times*2.
-
*1
Integer division is not always executed by one instruction. For example, some of ARM processors do not have integer divide instructions and requires a function call to perform an integer division. Therefore we specially heightened the level of abstraction of the benchmarking program used in .
-
*2
A floating point here refers to a 64-bit double precision floating point defined in IEEE 754.
Each of microbenchmarks is written in C and we compiled with the same environments and the same options shown in Table III as the target benchmarks. We used register modifiers so that the compiler conducts register allocation in the presence of -O0 option.
IV-A4 Quantification with compound benchmark score
Scores generated by the microbenchmarks shown in Table IV contains an influence of some overhead code such as comparison instructions and branch instructions. Therefore we introduce a value calculated from several benchmark scores and we call it compound benchmark score. We used compound benchmark scores shown in Table V for quantifying factors of system performance.
| Name | Calculating Formula | Interpretation |
| C_Ia | Execution time of integer add instructions. | |
| C_Im | Execution time of integer multiply instructions. | |
| C_Iam | Execution time of interleaved integer add instructions and integer multiply instructions. | |
| C_Id | Execution time of integer divisions. | |
| C_Is | Execution time of integer store instructions which have the same destination virtual address. | |
| C_Isl | Execution time of interleaved integer store instructions and integer load instructions which have the same destination/source virtual address. | |
| C_Fa | Execution time of floating point add instructions. | |
| C_Fm | Execution time of floating point multiply instructions. | |
| C_Fd | Execution time of floating point divide instructions. | |
| C_Fs | Execution time of floating point store instructions which have the same destination virtual address. | |
| C_Fsl | Execution time of interleaved floating point store instructions and floating point load instructions which have the same destination/source virtual address. | |
IV-A5 Other conditions
Time measurement. We measured execution time by having each program call the standard POSIX function clock_gettime around the target code which execution time we measure. The clock we used is CLOCK_MONOTONIC.
Number of trials. Considering that a benchmark score can vary depending on the state of the system at the start of benchmarking, we conducted the trial several times. Each of target benchmarks is run 3 times and each of the microbenchmarks 5 times.
However, because breakdown of a benchmark score requires only one score, we must summarize the multiple benchmark scores into one benchmark score. In this experiment, we calculated summary values by using the minimum value of the benchmark scores because any benchmark score in this experiment is an execution time. This is because an execution time cannot incidentally diminish, that is, a measurement of execution time always generates positive errors and therefore a minimal value of benchmark scores is the sample which has a lowest error.
Regression analysis. In this experiment, we conducted multiple linear regression analysis, where the input variables are the score of and the compound score shown in Table V and the output variable is a score generated by one of the target benchmarks. Because a degree that a program utilizes each factor cannot be negative, we used non-negative least squares (NNLS) methods for deciding the partial regression coefficients corresponding to factor utilization degrees. The NNLS method is done with nnls package (Version 1.4) of R language.
IV-B Experimental Results and Discussion
Results. We show the result of breakdown of the 3 target benchmarks in Figure 2. The black bars in the figure represent true values and the cumulative bars on the black bars represent scores estimated by the multiple regression analysis.
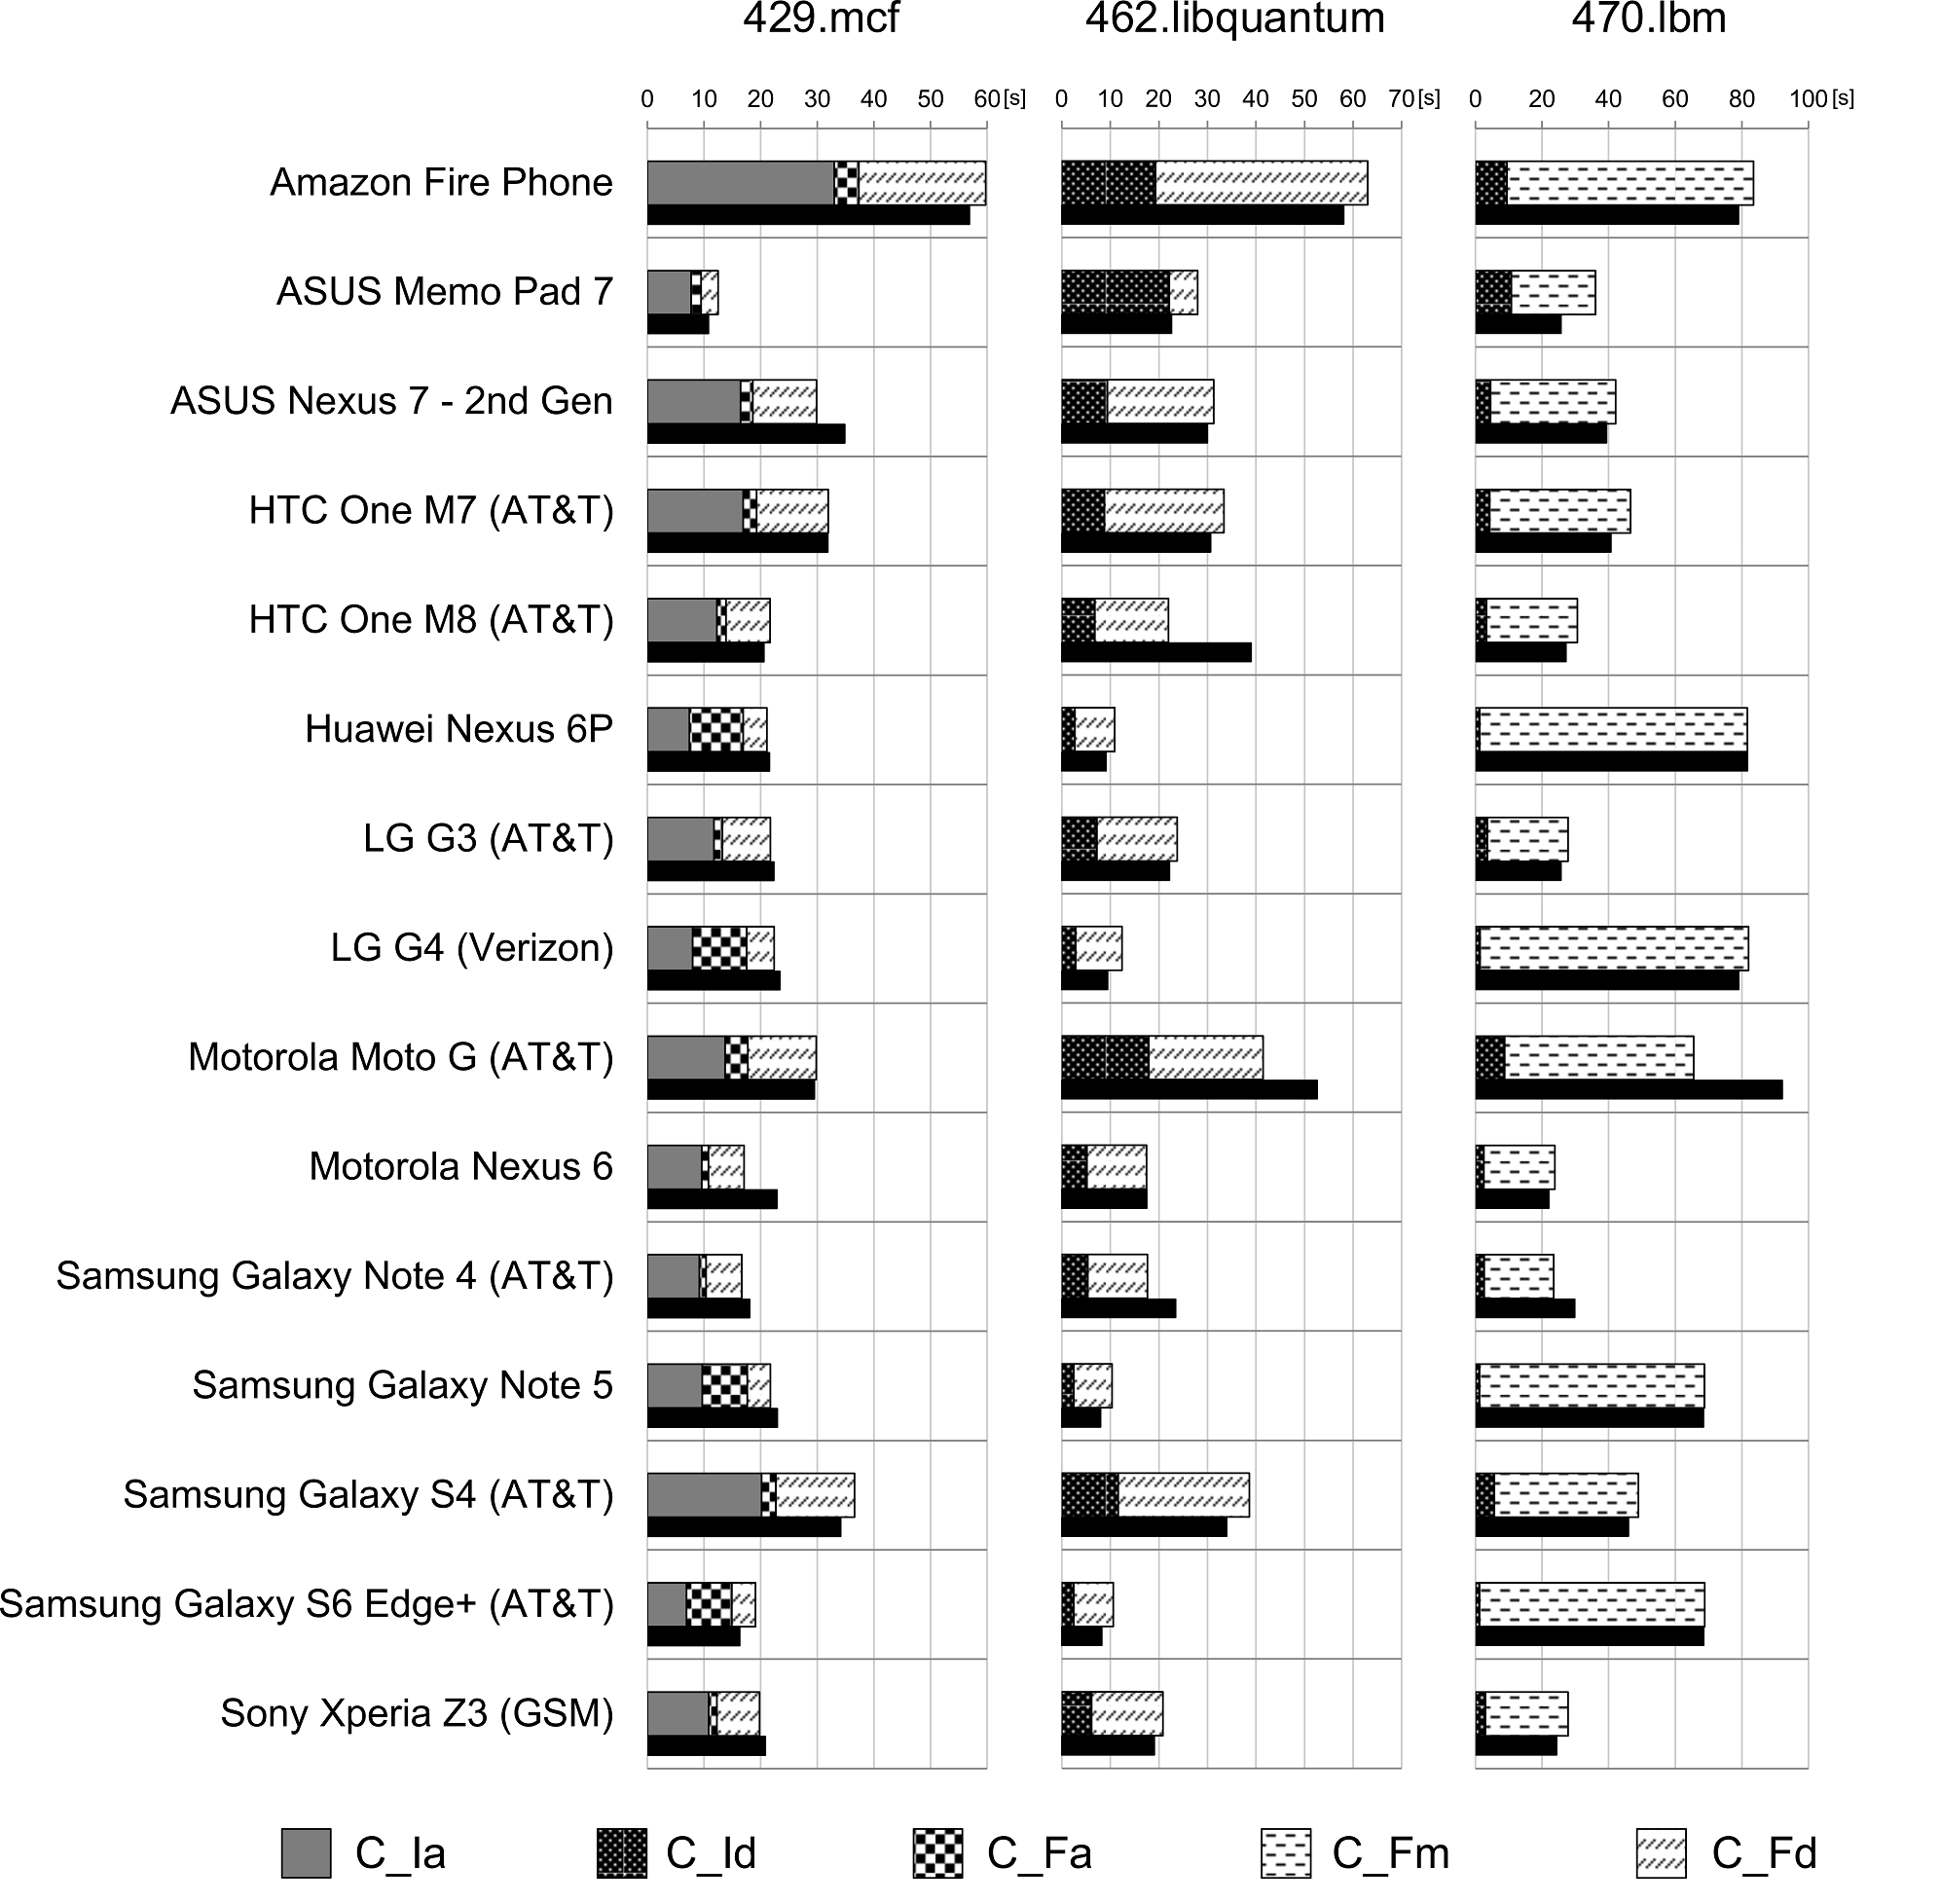
Discussion. First, we discuss accuracy of the regression analysis. While there is little difference between the true values and the estimated values in 429.mcf, there unignorable difference in 462.libquantum and 470.lbm. This may be because the number of the microbenchmarks we used is not enough for multiple regression analysis.
Second, we discuss which factor contributes to the scores.
At a glance, we can notice that the only 5 of 12 factors contribute to the scores. This may be because similar factors have been summarized into one factor due to their strong correlation.
We can also notice that the combinations of factor contributions in the scores of the 3 target benchmarks differ from each other. This means our proposed method can distinguish differences between characteristics of benchmarking programs.
Meanwhile, in some of the target benchmarks, there is an abnormality in the combination of factor contributions. Although C_Ia (integer addition), C_Fa (floating point addition), and C_Fd (floating point division) contribute to the scores in 429.mcf and C_Id (integer division) and C_Fd (floating point division) to the scores in 462.libquantum, this is considered to be an abnormal result because it is officially said that 429.mcf and 462.libquantum are benchmarks measuring integer arithmetic performance. This may be because a contribution of integer arithmetic performance factor was mistaken for a contribution of floating point arithmetic performance factor due to their correlation.
IV-C Summary
This experiment showed that results of breakdown by our proposed method are sufficiently practical and our proposed method can sufficiently distinguish differences between characteristics of benchmarking programs. Meanwhile, we found that a result of breakdown can be worse in the form of an abnormal combination of factor contributions if microbenchmarks for quantifying system performance are not sufficiently appropriate.
V Conclusion
In this paper, we presented a method for breaking down a benchmark score without internal analysis of the benchmarking program. The method quantifies a portion of number of aspects of the system performance with regression analysis using number of systems. Experimental results with 3 benchmarks on 15 Android systems showed that our method could break down those benchmark scores even though there is room for improvement in accuracy.
Finally, we describe future work. Although our proposed method heuristically prepares appropriate microbenchmarks and quantifies factors of system performance by using them, our proposed method can be said to be still a naïve method which has room for improvement because heuristics might have caused the accuracy degradation. Possible improvements include the establishment of a method which (1) automatically collects candidates of appropriate benchmarks and (2) automatically selects an appropriate combination of those candidates.
Moreover, because it remains to be seen whether or not our proposed method can function well in another situation different from that of this experiment, we need to perform some additional experiments using another system type, another benchmarks, and another regression analysis method.
Acknowledgments
This work was supported by JSPS KAKENHI Grant Numbers 25700008 and 16K12406.
References
- [1] Y. Zhang and J. D. Owens, “A quantitative performance analysis model for GPU architectures,” in High Performance Computer Architecture (HPCA), 2011 IEEE 17th International Symposium on, Feb 2011, pp. 382–393.
- [2] C. Brandolese, W. Fornaciari, F. Salice, and D. Sciuto, “Source-level Execution Time Estimation of C Programs,” in Proceedings of the Ninth International Symposium on Hardware/Software Codesign (CODES), 2001, pp. 98–103.
- [3] M. Seltzer, D. Krinsky, K. Smith, and X. Zhang, “The Case for Application-Specific Benchmarking,” in Proceedings of the 1999 Workshop on Hot Topics in Operating Systems (HotOS VII), Mar. 1999, pp. 102–107.
- [4] Amazon Web Services, Inc., “Amazon Elastic Compute Cloud,” https://aws.amazon.com/ec2/.
- [5] Google, Inc., “Google Compute Engine,” https://cloud.google.com/compute/.
- [6] P. Barham, B. Dragovic, K. Fraser, S. Hand, T. Harris, A. Ho, R. Neugebauer, I. Pratt, and A. Warfield, “Xen and the Art of Virtualization,” in Proceedings of the Nineteenth ACM Symposium on Operating Systems Principles (SOSP), 2003, pp. 164–177.
- [7] A. Menon, J. R. Santos, Y. Turner, G. J. Janakiraman, and W. Zwaenepoel, “Diagnosing Performance Overheads in the Xen Virtual Machine Environment,” in Proceedings of the 1st ACM/USENIX International Conference on Virtual Execution Environments (VEE), 2005, pp. 13–23.
- [8] Amazon Web Services, Inc., “Amazon Device Farm,” https://aws.amazon.com/device-farm/.
- [9] Standard Performance Evaluation Corporation, “SPEC CPU2006,” https://www.spec.org/cpu2006/.