Multilevel Anomaly Detection for Mixed Data
Abstract
Anomalies are those deviating from the norm. Unsupervised anomaly detection often translates to identifying low density regions. Major problems arise when data is high-dimensional and mixed of discrete and continuous attributes. We propose , which stands for MIXed data Multilevel Anomaly Detection, an ensemble method that estimates the sparse regions across multiple levels of abstraction of mixed data. The hypothesis is for domains where multiple data abstractions exist, a data point may be anomalous with respect to the raw representation or more abstract representations. To this end, our method sequentially constructs an ensemble of Deep Belief Nets (DBNs) with varying depths. Each DBN is an energy-based detector at a predefined abstraction level. At the bottom level of each DBN, there is a Mixed-variate Restricted Boltzmann Machine that models the density of mixed data. Predictions across the ensemble are finally combined via rank aggregation. The proposed is evaluated on high-dimensional real-world datasets of different characteristics. The results demonstrate that for anomaly detection, (a) multilevel abstraction of high-dimensional and mixed data is a sensible strategy, and (b) empirically, is superior to popular unsupervised detection methods for both homogeneous and mixed data.
1 Introduction
A vital intelligent function and survival skill for living organism is detecting anomalies, that is, those deviating from the norm. Except for a few deadly instances, we learn to detect anomalies by observing and exploring, without supervision. Unsupervised anomaly detection does not assume any domain knowledge about abnormality, and hence it is cheap and pervasive. A disciplined approach is to identify instances lying in low density regions [11]. However, estimating density in high-dimensional and mixed-type settings is difficult [12, 22, 35].
Under these conditions, existing non-parametric methods that define a data cube to estimate the relative frequency of data are likely to fail. It is because the number of cube grows exponentially with the data dimensions, thus a cube with only a few or no observed data points needs not be a low density region. An alternative is to use distance to nearest neighbors, assuming that the larger the distance, the less dense the region [5]. But distance is neither well-defined under mixed types nor meaningful in a high-dimensional space [1, 35]. Solving both challenges is largely missing in the literature as existing work targets either single-type high-dimensions (e.g., see [35] for a recent review) or mixed data (e.g., see [12, 22] for latest attempts).
To tackle the challenges jointly, we advocate learning data representation through abstraction, a strategy that (a) transforms mixed-data into a homogeneous representation [27], and (b) represents the multilevel structure of data [8]. The hypothesis is a data point may be anomalous with respect to either the raw representation or higher abstractions. We call it the Multilevel Anomaly Detection (MAD) hypothesis. For example, an image may be anomalous not because its pixel distribution differs from the rest, but because its embedded concepts deviate significantly from the norm. Another benefit of learning higher-level data representation is that through abstraction, regularities and consistencies may be readily revealed, making it easier to detect deviations. To test the MAD hypothesis, we present a new density-based method known as , which stands for MIXed data Multilevel Anomaly Detection. generalizes the recent work in [12] for mixed data by building multiple abstractions of data. For data abstraction, we leverage recent advances in unsupervised deep learning to abstract the data into multilevel low-dimensional representations [8].
While deep learning has revolutionized supervised prediction [21], its application to unsupervised anomaly detection is very limited [33]. With we build a sequence of Deep Belief Nets (DBNs) [17] of increasing depths. Each DBN is a layered model that allows multiple levels of data abstraction. The top layer of the DBN is used as an anomaly detector. A key observation to DBN-based anomaly detection is that the perfect density estimation is often not needed in practice. All we need is a ranking of data instances by increasing order of abnormality. An appropriate anomaly scoring function is free-energy of abstracted data, which equals negative-log of data density up to an additive constant.
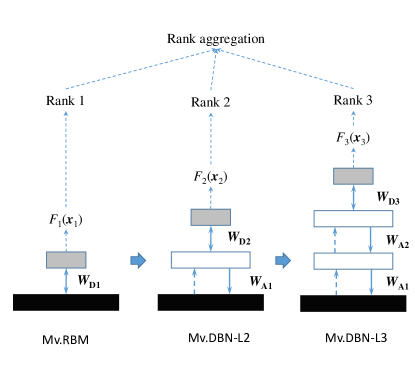
offers the following procedure to test the MAD hypothesis: First apply multiple layered abstractions to the data, and then estimate the anomalies at each level. Finally, the anomaly score is aggregated across levels. While this bears some similarity with the recent ensemble approaches [2, 4], the key difference is MAD relies on multiple data abstractions, not data resampling or random subspaces which are still on the original data level. In , as the depth increases and the data representation is more abstract, the energy landscape gets smoother, and thus it may detect different anomalies. For reaching anomaly consensus across depth-varying DBNs, employs a simple yet flexible rank aggregation method based on -norm.
We validate through an extensive set of experiments against well-known shallow baselines, which include the classic methods (PCA, GMM, RBM and one-class SVM), as well as state-of-the-art mixed-type methods (ODMAD [20], BMM [9], GLM-t [22] and Mv.RBM [12]). The experiments demonstrate that (a) multilevel abstraction of data is important in anomaly detection, and (b) is superior to popular unsupervised detection methods for both homogeneous and mixed data.
In summary, we claim the following contributions:
-
•
Stating the hypothesis of Multilevel Anomaly Detection (MAD) that argues for reaching agreement across multiple abstractions of data.
-
•
Deriving , an efficient ensemble algorithm to test MAD. builds a sequence of Deep Belief Nets, each of which is an anomaly detector. All detectors are then combined using a flexible -norm aggregation that allows tuning along the conservative/optimistic axis.
-
•
A comprehensive evaluation of on high-dimensional datasets against a large suite of competing methods.
2 Background
Anomaly detection on high-dimensional and mixed data has attracted a wide range of methods, but the two challenges are tackled independently rather than jointly as in this paper. High-dimensional data suffers from ‘curse of dimensionality’ also known more concretely as ‘distance concentration effect’, irrelevant attributes and redundant attributes, which together cause failure of low-dimensional techniques [1]. Popular anomaly detection approaches targeting high-dimensions include feature selection, dimensionality reduction (such as using PCA) and subspace analysis (readers are referred to [35] for a recent survey and in-depth discussion).
Mixed data has received a moderate attention. A method called LOADED [15] defines the score on the discrete subspace and combines with a correlation matrix in the continuous subspace. A related method called ODMAD [20] opts for stage-wise detection in each subspace. A different strategy is employed in [9], where scores for discrete and continuous spaces are computed separately, then combined using a mixture model. The work in [34] introduces Pattern-based Anomaly Detection (POD), where a pattern consists of a discrete attribute and all continuous attributes. Scores of all patterns are then combined. Methods with joint distribution of all attributes are introduced recently in [12, 22] using latent variables to link all types together. We adapt the work in [12] to represent mixed data into a homogeneous form using Mixed-variate Restricted Boltzmann Machines [27]. The homogeneous representation can then be abstracted into higher semantic levels in order to test the MAD hypothesis stated earlier.
The recent advances of deep networks have inspired some work in anomaly detection [7, 14, 25, 26, 32]. A common strategy is to use unsupervised deep networks to detect features, which are then fed into well-established detection algorithms [32]. Another strategy is to learn a deep autoencoder which maps data to itself, and then use the reconstruction error as anomaly score [7, 14, 25, 26]. A problem with this reconstruction error is that the final model still operates on raw data, which can be noisy and high-dimensional. A more fundamental problem is that reconstruction error does not reflect data density [19]. A better approach is to use deep networks to estimate the energy directly [12, 13, 33]. This resembles in principle our free-energy function presented in Sec. 3.3, but differs in the network construction procedure. It does not reflect the multilevel abstraction hypothesis we are pursuing.
3 : MIXed data Multilevel Anomaly Detection
We present , an ensemble algorithm for MIXed data Multilevel Anomaly Detection. Given a data instance we estimate the unnormalized density, which is the true density up to a multiplicative constant: . An instance is declared as anomaly if its density is lower than a threshold:
| (1) |
for some threshold estimated from data. Here serves as the anomaly scoring function.
3.1 Prelim: Shallow Model for Mixed Data.
For subsequent development, let us briefly review a probabilistic graphical model known as Mixed-variate Restricted Boltzmann Machines (Mv.RBM) [27] for modelling mixed data. Let be an input vector of (mixed-type) elements, and be a binary hidden vector, Mv.RBM defines the joint distribution as follows:
where is energy function decomposed as follows:
| (2) |
The sub-energy functions and are type-specific. For example, for binary; for Gaussian; and for Poisson. The three types share the same form of input-hidden mapping: .
Mv.RBM can be used for outlier detection [12] by noticing that:
| (3) |
where is known as free-energy. In other words, or equivalently , where is a constant and is unnormalized density (see Eq. (1)). Thus we can use the free-energy as an anomaly score to rank data instances, following the decision rule in Eq. (1). The computational cost of free-energy scales linearly with number of dimensions making it an attractive scoring in practice:
| (4) |
For training, we adopt the standard CD-1 procedure [16]. This method approximates the gradient of the data log-likelihood using one random sample per data point. The sample is generated using one-step MCMC starting from the observed data itself.
3.2 Extending Deep Belief Nets for Mixed Data.
Deep Belief Network (DBN) [17] is a generative model of data. It assumes that the data is generated from hidden binary variables , which is generated from higher hidden binary variables and so on. Two consecutive layers in DBN form a Restricted Boltzmann Machine (RBM), which models either at the bottom level, or at higher levels. A DBN is usually trained by learning a stack of RBMs in a layer-wise fashion. First a RBM is trained on the input data, its weights are then frozen. The hidden posterior is used to generate input for the next RBM, i.e., . The process is repeated until the last RBM. This procedure of freezing the lower weights has been shown to optimize the variational bound of the data likelihood [18]. Overall, an DBN is a mixed-graph whose the top RBM remains undirected, but the lower cross-layer connections are directed toward the data.
The original DBNs are designed for single data type, primarily binary or Gaussian. Here we extend DBNs to accommodate mixed data. In particular, the training steps of DBNs are kept, but the bottom RBM is now a Mv.RBM. The Mv.RBM transforms mixed input into a homogeneous binary representation through . The subsequent RBMs are for binary inputs as usual.
3.3 Abstracted Anomaly Detection Using Deep Belief Nets.
Although the stagewise learning procedure that gives rise to DBN optimizes the lower bound of , it is still not possible to estimate the bound for density-based anomaly detection. Let be the number of hidden layers. Existing methods typically use DBNs to (a) learn high-level features through and feed to existing anomaly detectors (e.g., [32]); and (b) build a deep autoencoder then estimate the reconstruction error [7, 14, 25, 26]. Here we propose an alternative to use DBN directly for anomaly detection.
The idea is to recognize that the RBM at the top of the DBN operates on data abstraction , and the RBM’s prior density can replace in Eq. (3). Recall that the input to the intermediate RBM at level is an abstraction of the lower level data. It is generated through sampling the posterior for and for as follows:
| (5) |
where stands for Bernoulli distribution and . The prior density can be rewritten as:
| (6) |
where
| (7) |
This abstracted free-energy, like that of Mv.RBM in Eq. (4), can also be used as an anomaly score of abstracted data, and the anomaly region is defined as:
Once the DBN has been trained, the free-energy can be approximated by a deterministic function, where the intermediate input in Eq. (5) is recursively replaced by:
| (8) |
3.4 Multilevel Detection Procedure With DBN Ensemble.
Recall that our Multilevel Anomaly Detection (MAD) hypothesis is that for domains where multiple data abstractions exist (e.g., in images & videos), an anomaly can be detected on one or more abstract representations. Each level of abstraction would detect abnormality in a different way. For example, assume an indoor setting where normal images contain regular arrangement of furniture. An image of a room with random arrangement (e.g., a chair in a bed) may appear normal at the pixel level, and at the object class level, but not at the object context level. This suggests the following procedure: apply multiple abstraction levels, and at each level, estimate an anomaly score, then combine all the scores.
Since free-energies in Eq. (7) differ across levels, direct combination of anomaly scores is not possible. A sensible approach is through rank aggregation, that is, the free-energies at each level are first used to rank instances from the lowest to the highest energy. The ranks now serve as anomaly scores which are compatible across levels.
3.4.1 -norm Rank Aggregation.
One approach to rank aggregation is to find a ranking that minimizes the disagreement with all ranks [3]. However, this minimization requires searching through a permutation space of size for instances, which is intractable. Here we resort to a simple technique: Denoted by the rank anomaly score of instance at level , the aggregation score is computed as:
| (9) |
where is a tuning parameter.
There are two detection regimes under this aggregation scheme. The detection at is conservative, that is, individual high outlier scores are suppressed in favor of a consensus. The other regime is optimistic at , where the top anomaly scores tend to dominate the aggregation. This aggregation subsumes several methods as special cases: reduces to the classic Borda count when is rank position; reduces to the max: .
3.4.2 Separation of Abstraction and Detection.
Recall from that we use RBMs for both abstraction (Eq. (5)) and anomaly detection (Eq. (7)). Note that data abstraction and anomaly detection have different goals – abstraction typically requires more bits to adequately disentangle multiple factors of variation [8], whereas detection may require less bits to estimate a rank score. Fig. 2 presents the multilevel anomaly detection algorithm. It trains one Mv.RBM and DBNs of increasing depths – from to – with time complexity linear in . They produce rank lists, which are then aggregated using Eq. (9).
| Input: data ; Output: Anomaly rank. |
| User-defined parameters: depth , abstraction hidden sizes , and detection hidden sizes , and . |
| Main-loop: 1. For each level : (a) Train a detection RBM (or Mv.RBM if ) with hidden units; (b) Estimate free-energy using Eqs. (7,8) (or using Eq. (4) for ); (c) Rank data according to free energies; (d) If i. Train an abstraction RBM on (or for if ) with hidden units; ii. Abstracting data using Eq. (5) to generate ; 2. Aggregate ranks using -norm in Eq. (9). |
4 Experiments
This section reports experiments and results of on a comprehensive suite of datasets. We first present the cases for single data type in Section 4.1, then extend for mixed data in Section 4.2.
4.1 Homogeneous Data.
We use three high-dimensional real-world datasets with very different characteristics: handwritten digits (MNIST), Internet ads and clinical records of birth episodes.
-
•
The MNIST has gray images of size for training and images for testing111http://yann.lecun.com/exdb/mnist/. The raw pixels are used as features (784 dimensions). Due to ease of visualization and complex data topology, this is an excellent data for testing anomaly detection algorithms. We use digit ’8’ as normal and a small portion (~5%) of other digits as outliers. This proves to be a challenging digit compared to other digits – see Fig. 3 (left) for failure of pixel-based -nearest neighbor. We randomly pick 3,000 training images and keep all the test set.
-
•
The second dataset is InternetAds with 5% anomaly injection as described in [10]. As the data size is moderate (1,682 instances, 174 features), no train/test splitting is used.
-
•
The third dataset consists of birth episodes collected from an urban hospital in Sydney, Australia in the period of 2011–2015 [28]. Preterm births are considered anomalous as they have a serious impact on the survival and development of the babies [31]. In general, births occurring within 37 weeks of gestation are considered preterm [6]. We are also interested in early preterm births, e.g., those occurring within 34 weeks of gestation. This is because the earlier the birth, the more severe the case, leading to more intensive care. Features include 369 clinically relevant facts collected in the first few visits to hospital before 25 weeks of gestation. The data is randomly split into a training set of 3,000 cases, and a test set of 5,104 cases.
All data are normalized into the range [0,1], which is known to work best in [10]. Data statistics are reported in Table 1.
| Dims | #train | #test | %outlier | |
|---|---|---|---|---|
| MNIST | 784 | 3,000 | 1,023 | 4.9 |
| InternetAds | 174 | 1,682 | 1,682 | 5.0 |
| Preterm-37w | 369 | 3,000 | 5,104 | 10.9 |
| Preterm-34w | 369 | 3,000 | 5,104 | 6.5 |
4.1.1 Models implementation.
We compare the proposed method against four popular shallow unsupervised baselines – -NN, PCA, Gaussian mixture model (GMM), and one-class SVM (OCSVM) [11]. (a) The -NN uses the mean distance from a test case to the nearest instances as outlier score [5]. We set with Euclidean distance. (b) For PCA, the % total energy is discarded, where is the estimated outlier rate in training data. The reconstruction error using the remaining eigenvectors is used as the outlier score. (c) The GMMs have four clusters and are regularized to work with high dimensional data. The negative log-likelihood serves as outlier score. (d) The OCVSMs have RBF kernels with automatic scaling. We also consider RBM [13] as baseline, which is a special case of our method where the number of layers is set to .
| Param. | MNIST | InternetAds | Preterm |
|---|---|---|---|
| 10 | 10 | 10 | |
| 70 | 50 | 70 | |
| 784 | 174 | 369 |
For , abstraction RBMs have the same number of hidden units while detection RBM usually have smaller number of hidden units. All RBMs are trained using CD-1 [16] with batch size of 64, learning rate of 0.3 and 50 epochs. Table 2 lists model parameters used in experimentation.
We use the following evaluation measures: Area Under ROC Curve (AUC), and NDCG@T. The AUC reflects the average discrimination power across the entire dataset, while the NDCG@T places more emphasis on the top retrieved cases.
4.1.2 Results.
 |
 |
|
| -NN, err: 15 | RBM, err: 10 | |
 |
 |
|
| DBN-L2, err: 12 | -L2p2, err: 8 |
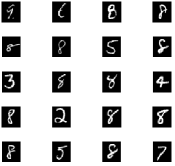
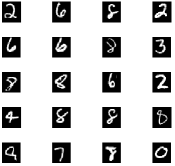
To see how combines evidences from detectors in the ensemble, we run the algorithms: RBM, the DBN with 2 layers, and the that combines RBM and DBN results. Fig. 3 plots detected images by the RBM/DBN/ against the classic -NN. The -NN fails for 15 out of 20 cases, mostly due to the variation in stroke thickness, which is expected for pixel-based matching. The RBM and DBN have different errors, confirming that anomalies differ among abstraction levels. Finally, the ensemble of RBM/DBN, then improves the detection significantly. The error is mostly due to the high variation in styles (e.g., 8 with open loops).
Table 3 reports the Area Under the ROC Curve (AUC) for all methods and datasets. Overall with 2 or 3 hidden layers works well. The difference between the baselines and is amplified in the NDCG measure, as shown in Table 4. One possible explanation is that the is an ensemble – an outlier is considered outlier if it is detected by all detectors at different abstraction levels. One exception is the max-aggregation (where in Eq. (9)), where the detection is over-optimistic.
| Method | MNIST | InternetAds | Preterm (37wks) | Preterm (34wks) |
|---|---|---|---|---|
| -NN | 0.804 | 0.573 | 0.596 | 0.624 |
| PCA | 0.809 | 0.664 | 0.641 | 0.673 |
| GMM | 0.839 | 0.725 | 0.636 | 0.658 |
| OCSVM | 0.838 | 0.667 | 0.646 | 0.676 |
| RBM | 0.789 | 0.712 | 0.648 | 0.677 |
| -L2p.5 | 0.867 | 0.829 | 0.627 | 0.729 |
| -L2p1 | 0.880 | 0.827 | 0.645 | 0.748 |
| -L2p2 | 0.897 | 0.816 | 0.661 | 0.761 |
| -L2p | 0.892 | 0.765 | 0.660 | 0.745 |
| -L3p.5 | 0.787 | 0.789 | 0.674 | 0.757 |
| -L3p1 | 0.814 | 0.775 | 0.689 | 0.765 |
| -L3p2 | 0.847 | 0.758 | 0.685 | 0.759 |
| -L3p | 0.876 | 0.734 | 0.668 | 0.742 |
| Method | MNIST | InternetAds | Preterm (37wks) | Preterm (34wks) |
|---|---|---|---|---|
| -NN | 0.218 | 0.413 | 0.362 | 0.188 |
| PCA | 0.488 | 0.225 | 0.505 | 0.356 |
| GMM | 0.458 | 0.415 | 0.438 | 0.223 |
| OCSVM | 0.423 | 0.094 | 0.471 | 0.172 |
| RBM | 0.498 | 0.421 | 0.429 | 0.216 |
| MAD-L2p.5 | 0.666 | 0.859 | 0.945 | 0.831 |
| MAD-L2p1 | 0.667 | 0.859 | 0.945 | 0.831 |
| MAD-L2p2 | 0.666 | 0.859 | 0.945 | 0.831 |
| MAD-L2p | 0.536 | 0.271 | 0.741 | 0.576 |
| MAD-L3p.5 | 0.732 | 0.908 | 0.798 | 0.625 |
| MAD-L3p1 | 0.732 | 0.908 | 0.798 | 0.626 |
| MAD-L3p2 | 0.732 | 0.902 | 0.769 | 0.597 |
| MAD-L3p | 0.360 | 0.598 | 0.370 | 0.113 |
4.2 Mixed Data.
| Dataset | No. Instances | No. Attributes | |||||
|---|---|---|---|---|---|---|---|
| Train | Test | Bin. | Gauss. | Nominal | Poisson | Total | |
| KDD99-10 | 75,669 | 32,417 | 4 | 15 | 3 | 19 | 41 |
| Australian Credit | 533 | 266 | 3 | 6 | 5 | 0 | 14 |
| German Credit | 770 | 330 | 2 | 7 | 11 | 0 | 20 |
| Heart | 208 | 89 | 3 | 6 | 4 | 0 | 13 |
| Thoracic Surgery | 362 | 155 | 10 | 3 | 3 | 0 | 16 |
| Auto MPG | 303 | 128 | 0 | 5 | 3 | 0 | 8 |
| Contraceptive | 1136 | 484 | 3 | 0 | 4 | 1 | 8 |
| KDD | AuCredit | GeCredit | Heart | ThSurgery | AMPG | Contra. | |
|---|---|---|---|---|---|---|---|
| BMM [9, 12] | – | 0.97 | 0.93 | 0.87 | 0.94 | 0.62 | 0.67 |
| ODMAD [12, 20] | – | 0.94 | 0.81 | 0.63 | 0.88 | 0.57 | 0.52 |
| GLM-t [12, 22] | – | – | – | 0.72 | – | 0.64 | – |
| Mv.RBM [12] | 0.71 | 0.90 | 0.95 | 0.94 | 0.90 | 1.00 | 0.91 |
| -L2p0.5 | 0.72 | 0.93 | 0.97 | 0.94 | 0.97 | 1.00 | 0.95 |
| -L2p1 | 0.72 | 0.93 | 0.95 | 0.94 | 0.97 | 1.00 | 0.95 |
| -L2p2 | 0.69 | 0.93 | 0.97 | 0.94 | 0.97 | 1.00 | 0.95 |
| -L2p | 0.69 | 0.73 | 0.97 | 1.00 | 0.97 | 1.00 | 0.95 |
| -L3p0.5 | 0.73 | 0.98 | 0.97 | 0.94 | 0.97 | 0.70 | 0.95 |
| -L3p1 | 0.72 | 0.98 | 0.97 | 0.94 | 0.97 | 0.70 | 0.95 |
| -L3p2 | 0.71 | 0.98 | 0.97 | 0.94 | 0.97 | 0.70 | 0.95 |
| -L3p | 0.50 | 0.78 | 0.97 | 0.94 | 0.97 | 0.57 | 0.95 |
We use data from [12] where the data statistics are reported in Table 5. To keep consistent with previous work [9, 12, 20, 22], we report the results using the F-scores. The detection performance on test data is reported in Table 6. Abstraction works well for , where performance is generally better than the shallow Mv.RBM. However, when one more layer is added, the results are mixed. This pattern is indeed not new as it resembles what can be seen across the literature of DBNs for classification tasks [17, 24]. One possible conjecture is that at a certain higher level, signals become too abstract, and that the distribution become too flat to really distinguish between truly low and high density regions. This suggests further research on selection of abstraction levels.
5 Discussion and Conclusion
As an evidence to the argument in Section 3.4.2 about separating the abstraction and detection RBMs, we found that the sizes of the RBMs that work well on the MNIST do not resemble those often found in the literature (e.g., see [17]). For example, typical numbers of hidden units range from 500 to 1,000 for a good generative model of digits. However, we observe that 10 to 20 units for detection RBMs and 50-100 units for abstraction RBMs work well in our experiments, regardless of the training size. This suggests that the number of bits required for data generation is higher than those required for anomaly detection. This is plausible since accurate data generation model needs to account for all factors of variation and a huge number of density modes. On the other hand, anomaly detection model needs only to identify low density regions regardless of density modes. An alternative explanation is that since the CD-1 procedure used to train RBMs (see Section 3.2) creates deep energy wells around each data points, an expressive model may lead to more false alarms. Thus, the smoothness of the energy surface may play an important role in anomaly detection. Our algorithm offers a consensus among multiple energy surface, and thus can be considered as a way to mitigate the energy wells issue.
There has been an unexpected connection between the construction procedure of DBNs and the variational renomarlization groups in physics [23]. In particular, with layerwise construction, the data is rescaled – the higher layer operates on a coarser data representation. This agrees with our initial motivation for the MAD hypothesis.
Finally, although not implemented here, the lends itself naturally to detecting anomalies in multimodal data with diverse modal semantics. For example, an image can be equipped with high-level tags and several visual representations. Each data representation can be modelled as a Mv.RBM at the right level of abstraction. The upper RBMs then integrate all information into coherent representations [29].
5.1 Conclusion.
In this paper we have tackled the double challenge of high-dimensions and mixed-data in anomaly detection. We first proposed the Multilevel Anomaly Detection (MAD) hypothesis in that a data point is anomalous with respect to one or more levels of data abstraction. To test the hypothesis, we introduced , a procedure to train a sequence of Deep Belief Networks, each of which provides a ranking of anomalies. All rankings are then aggregated through a simple -norm trick. Experiments on both single-type and mixed-type data confirmed that (a) learning data representation through multilevel abstraction is a sensible strategy for high-dimensional settings; and (b) is a competitive method. There are rooms for improvement however. First, going very deep has not proved very successful. DBNs have demonstrated its usefulness in abstraction, but there exist other possibilities [30, 33]. Finally, the simple -norm rank aggregation can be replaced by a more sophisticated method for selecting and building right abstraction levels [36].
Acknowledgments
This work is partially supported by the Telstra-Deakin Centre of Excellence in Big Data and Machine Learning.
References
- [1] Charu C Aggarwal, Alexander Hinneburg, and Daniel A Keim. On the surprising behavior of distance metrics in high dimensional space. In International Conference on Database Theory, pages 420–434. Springer, 2001.
- [2] Charu C Aggarwal and Saket Sathe. Theoretical foundations and algorithms for outlier ensembles. ACM SIGKDD Explorations Newsletter, 17(1):24–47, 2015.
- [3] Nir Ailon, Moses Charikar, and Alantha Newman. Aggregating inconsistent information: ranking and clustering. Journal of the ACM (JACM), 55(5):23, 2008.
- [4] Shin Ando, Theerasak Thanomphongphan, Yoichi Seki, and Einoshin Suzuki. Ensemble anomaly detection from multi-resolution trajectory features. Data Mining and Knowledge Discovery, 29(1):39–83, 2015.
- [5] Fabrizio Angiulli and Clara Pizzuti. Fast outlier detection in high dimensional spaces. In European Conference on Principles of Data Mining and Knowledge Discovery, pages 15–27. Springer, 2002.
- [6] Fernando C Barros, Aris T Papageorghiou, Cesar G Victora, Julia A Noble, Ruyan Pang, Jay Iams, Leila Cheikh Ismail, Robert L Goldenberg, Ann Lambert, Michael S Kramer, et al. The distribution of clinical phenotypes of preterm birth syndrome: implications for prevention. JAMA pediatrics, 169(3):220–229, 2015.
- [7] John Becker, Timothy C Havens, Anthony Pinar, and Timothy J Schulz. Deep belief networks for false alarm rejection in forward-looking ground-penetrating radar. In SPIE Defense+ Security, pages 94540W–94540W. International Society for Optics and Photonics, 2015.
- [8] Yoshua Bengio, Aaron Courville, and Pascal Vincent. Representation learning: A review and new perspectives. IEEE Transactions on Pattern Analysis and Machine Intelligence, 35(8):1798–1828, 2013.
- [9] Mohamed Bouguessa. A practical outlier detection approach for mixed-attribute data. Expert Systems with Applications, 42(22):8637–8649, 2015.
- [10] Guilherme O Campos, Arthur Zimek, Jörg Sander, Ricardo JGB Campello, Barbora Micenková, Erich Schubert, Ira Assent, and Michael E Houle. On the evaluation of unsupervised outlier detection: measures, datasets, and an empirical study. Data Mining and Knowledge Discovery, pages 1–37, 2015.
- [11] Varun Chandola, Arindam Banerjee, and Vipin Kumar. Anomaly detection: A survey. ACM computing surveys (CSUR), 41(3):15, 2009.
- [12] Kien Do, Truyen Tran, Dinh Phung, and Svetha Venkatesh. Outlier detection on mixed-type data: An energy-based approach. International Conference on Advanced Data Mining and Applications (ADMA 2016), 2016.
- [13] Ugo Fiore, Francesco Palmieri, Aniello Castiglione, and Alfredo De Santis. Network anomaly detection with the restricted Boltzmann machine. Neurocomputing, 122:13–23, 2013.
- [14] Ni Gao, Ling Gao, Quanli Gao, and Hai Wang. An intrusion detection model based on deep belief networks. In Advanced Cloud and Big Data (CBD), 2014 Second International Conference on, pages 247–252. IEEE, 2014.
- [15] Amol Ghoting, Matthew Eric Otey, and Srinivasan Parthasarathy. Loaded: Link-based outlier and anomaly detection in evolving data sets. In ICDM, pages 387–390, 2004.
- [16] G.E. Hinton. Training products of experts by minimizing contrastive divergence. Neural Computation, 14:1771–1800, 2002.
- [17] G.E. Hinton and R.R. Salakhutdinov. Reducing the dimensionality of data with neural networks. Science, 313(5786):504–507, 2006.
- [18] Geoffrey E Hinton, Simon Osindero, and Yee-Whye Teh. A fast learning algorithm for deep belief nets. Neural computation, 18(7):1527–1554, 2006.
- [19] Hanna Kamyshanska and Roland Memisevic. The potential energy of an autoencoder. Pattern Analysis and Machine Intelligence, IEEE Transactions on, 37(6):1261–1273, 2015.
- [20] Anna Koufakou, Michael Georgiopoulos, and Georgios C Anagnostopoulos. Detecting outliers in high-dimensional datasets with mixed attributes. In DMIN, pages 427–433. Citeseer, 2008.
- [21] Yann LeCun, Yoshua Bengio, and Geoffrey Hinton. Deep learning. Nature, 521(7553):436–444, 2015.
- [22] Yen-Cheng Lu, Feng Chen, Yating Wang, and Chang-Tien Lu. Discovering anomalies on mixed-type data using a generalized student-t based approach. IEEE Transactions on Knowledge and Data Engineering, DOI:10.1109/TKDE.2016.2583429, 2016.
- [23] Pankaj Mehta and David J Schwab. An exact mapping between the variational renormalization group and deep learning. arXiv preprint arXiv:1410.3831, 2014.
- [24] R. Salakhutdinov and G. Hinton. Deep Boltzmann Machines. In Proceedings of 20th AISTATS, volume 5, pages 448–455, 2009.
- [25] Jianwen Sun, Reto Wyss, Alexander Steinecker, and Philipp Glocker. Automated fault detection using deep belief networks for the quality inspection of electromotors. tm-Technisches Messen, 81(5):255–263, 2014.
- [26] Takaaki Tagawa, Yukihiro Tadokoro, and Takehisa Yairi. Structured denoising autoencoder for fault detection and analysis. In ACML, 2014.
- [27] T. Tran, D.Q. Phung, and S. Venkatesh. Mixed-variate restricted Boltzmann machines. In Proc. of 3rd Asian Conference on Machine Learning (ACML), Taoyuan, Taiwan, 2011.
- [28] Truyen Tran, Wei Luo, Dinh Phung, Jonathan Morris, Kristen Rickard, and Svetha Venkatesh. Preterm birth prediction: Deriving stable and interpretable rules from high dimensional data. Conference on Machine Learning in Healthcare, LA, USA, 2016.
- [29] Truyen Tran, Dinh Phung, and Svetha Venkatesh. Learning deep representation of multityped objects and tasks. arXiv preprint arXiv:1603.01359, 2016.
- [30] P. Vincent, H. Larochelle, I. Lajoie, Y. Bengio, and P.A. Manzagol. Stacked denoising autoencoders: Learning useful representations in a deep network with a local denoising criterion. The Journal of Machine Learning Research, pages 3371–3408, 2010.
- [31] Ilia Vovsha, Ashwath Rajan, Ansaf Salleb-Aouissi, Anita Raja, Axinia Radeva, Hatim Diab, Ashish Tomar, and Ronald Wapner. Predicting preterm birth is not elusive: Machine learning paves the way to individual wellness. In 2014 AAAI Spring Symposium Series, 2014.
- [32] Yao Wang, Wan-dong Cai, and Peng-cheng Wei. A deep learning approach for detecting malicious JavaScript code. Security and Communication Networks, 2016.
- [33] Shuangfei Zhai, Yu Cheng, Weining Lu, and Zhongfei Zhang. Deep structured energy based models for anomaly detection. arXiv preprint arXiv:1605.07717, 2016.
- [34] Ke Zhang and Huidong Jin. An effective pattern based outlier detection approach for mixed attribute data. In Australasian Joint Conference on Artificial Intelligence, pages 122–131. Springer, 2010.
- [35] Arthur Zimek, Erich Schubert, and Hans-Peter Kriegel. A survey on unsupervised outlier detection in high-dimensional numerical data. Statistical Analysis and Data Mining, 5(5):363–387, 2012.
- [36] Erich Schubert Remigius Wojdanowski Arthur Zimek and Hans-Peter Kriegel. On evaluation of outlier rankings and outlier scores. 2012.