Pedestrian flows through a narrow doorway: effect of individual behaviours on the global flow and microscopic dynamics
Alexandre NICOLAS1,2,⋆ and Sebastián BOUZAT2 and Marcelo N. KUPERMAN2
1 LPTMS, CNRS & Univ. Paris-Sud, F-91405 Orsay, France
2 CONICET & Centro Atómico Bariloche, Bariloche, 8400, Argentina
Phone: (+33)1.69.15.73.10
Received Xth XXXXXXXXXX 20XX, Accepted Xth
XXXXXXXXX 20XX
First published on the web Xth XXXXXXXXXX 200X
Abstract
We study the dynamics of pedestrian flows through a narrow doorway by means of controlled experiments. The influence of the pedestrians’ behaviours is investigated by prescribing a selfish attitude to a fraction of the participants, while the others behave politely. Thanks to an original setup enabling the re-injection of egressed participants into the room, the analysis is conducted in a (macroscopically) quasi-stationary regime. We find that, as is increased, the flow rate rises, interpolating between published values for egresses in normal conditions and measurements for competitive evacuations. The dependence of several flow properties on the pedestrian density at the door, independently of , suggests that macroscopically the behavioural aspects could be subsumed under the density, at least in our specific settings with limited crowd pressure. In particular, under these conditions, grows monotonically with up to “close-packing” (). The flow is then characterised microscopically. Among other quantities, the time lapses between successive escapes, the pedestrians’ waiting times in front of the door, and their angles of incidence are analysed statistically. In a nutshell, our main results show that the flow is orderly for polite crowds, with narrowly distributed time lapses between egresses, while for larger the flow gets disorderly and vanishing time lapses emerge. For all , we find an alternation between short and long time lapses, which we ascribe to a generalised zipper effect. The average waiting time in the exit zone increases with its occupancy. The disorder in the flow and the pressure felt by participants are also assessed.
Keywords: Pedestrian evacuation; behaviours; exit capacity; bottleneck flow
Introduction
Evacuation through a doorway or a narrowing is a long-standing issue. In Homer’s Odyssey, Odysseus and his men need to escape from a cave without being noticed by its blinded guardian, Polyphemus the Cyclops, who relies on his sense of touch to mount guard; they manage to do so by tying themselves to the undersides of sheep. Nowadays, the possibility to evacuate quickly and safely from a public facility or building in emergency conditions should be ensured by the compliance with building codes [1, 2, 3]. These codes may be prescription-based or performance-based [4], depending on whether they constrain certain design elements, e.g., door widths, or set quantitative goals, such as permitting the evacuation of persons within a given time. A central issue is then the assessment of exit capacities , that is, the number of people who can walk through a given exit per unit time. These exit capacities are not relevant only for emergency evacuations, but more generally for the dimensioning of pedestrian facilities. Often, is evaluated on the basis of tabulated values resulting from empirical observations or controlled experiments. The required amount of tabulated data can be reduced by defining a specific capacity , i.e., a capacity per metre width, so that for a narrowing of width . This simplification relies on the assumption of a roughly linear growth of with , which is supported by some experimental evidence [5, 6, 7], at least at moderate pedestrian densities and for . 111In fact, among the references supporting an almost constant specific capacity when the exit width is varied, Kretz et al. [5] reported a moderate decrease of with , whereas Seyfried et al. [6] found a slight increase. Reference [8] stands out in the literature, in that it suggests a stepwise increase of the capacity with , due to the formation of equally spaced lanes, but this hypothesis stems from very limited evidence (only two widths were studied).
Unfortunately, as often emphasised in the literature [6], the tabulated capacities vary widely between handbooks or papers: for instance, for constrictions of width , we find in the SFPE handbook [2], in the “Planning for foot traffic flow in buildings” [9], in Kretz et al. [5], and in Seyfried et al. [6]. These discrepancies are ascribed to various factors. To start with, the use of distinct measurement methods, e.g., the recourse to either spatial or temporal averages to define the flow or the density, has been incriminated and can indeed lead to different results, especially at high densities, even in a simple single-file flow [10]; but Zhang et al. came to the conclusion that this point only has a relatively minor impact at lower densities [7]. Besides this technical aspect, cultural differences between populations may play a role; their importance is however debated, notably owing to the similarity in the measurements performed in the London Underground (UK) and in Osaka business district (Japan), as mentioned by Seyfried et al. [10]. The composition of the population and the associated morphological differences are arguably of greater importance, with higher flow rates for crowds consisting of children [3] (), due to their smaller size. Furthermore, it was found that short bottlenecks (mimicking the passage through a doorway) allowed higher flow rates than longer ones, which simulate the entrance to a narrow corridor [11, 12]; in the former case, it is possible to slither around the door jamb. Perhaps for similar reasons, trying to predict an exit capacity on the basis of the peak value of the flow rate vs. density curve for a simple uni-directional flow (the so called fundamental diagram) tends to underestimate the actual capacity [13]. Even more notably, the density of the pedestrian crowd at the beginning of the egress strongly impacts the flow rate , with a faster flow for initially denser crowds [14, 10]. Not unrelated to this dependence on the initial configuration is the question of the stationarity of the pedestrian flow [8, 6, 11, 12, 15]: often the measurements are not performed in the stationary regime, which further complicates the interpretation of the results.
To study the evacuation dynamics in simpler, or experimentally more tractable, systems, researchers have investigated constricted flows of less complex entities, such as vibrated grains [16], ants [17, 18], and sheep [19, 20], and brought to light similarities with pedestrians (for ants, the analogy is however debated [21]). But the complex psychology of humans adds a level of complexity to their response. In particular, on account of their individual characters, pedestrians exhibit diverse reactions to external stimuli and variable behaviours. In a series of repetitive evacuation experiments, habituation and boredom may lead to considerable variations between repetitions [3]. Besides, most of the aforementioned research focuses on pedestrian flows in normal, cooperative conditions, while competitive evacuation experiments are rare, probably because of the risks they present, although in reality impatient, competitive, aggressive or vying behaviours are also observed in some situations [22, 23, 24, 25]. Among but a few other examples, Muir et al. [26] simulated the evacuation from an aircraft, in which the participants’ competitiveness was whetted by the possibility of a reward; Nagai et al. [14] investigated the evacuation of relatively competitive crawlers and walkers; Helbing et al. conducted panic-like evacuation experiments, but with only about 20 participants. (Also see Ref. [27, 28] for a study of uni-directional flows, with some prescribed participants’ behaviours). More recently, in a series of papers [29, 30, 15], Garcimartín, Zuriguel, and co-workers carried out a detailed analysis of controlled evacuations in which distinct levels of competitiveness were prescribed to the crowd. (Also see [31] for experiments in a virtual environment.) It is noteworthy that, compared to the values reported above for normal conditions, the specific capacities measured in those (diversely) competitive settings are considerably larger: in the work of Nagai et al. [14] and Helbing et al. [32], in Garcimartín et al.’s paper [15] for door widths of 70 to 80 cm.
However, these evacuations were performed with crowds of homogeneous competitiveness. To get greater insight into the effect of individual behaviours, we conduct and analyse controlled evacuations through a narrow doorway with participants that are prescribed distinct behaviours, namely, either a polite or a selfish behaviour. We also vary their eagerness to egress. Note that ‘evacuation’ will be employed in the broad sense of emptying of a room with no focus on emergency conditions. For obvious safety reasons, our controlled experiments do not include many of the aspects that may occur in situations of extreme emergency such as panic, high pressure, violence or extreme haste. In contrast, they actually correspond to the flow of a dense crowd through a narrow exit with variable eagerness to exit, but always limited pushing. Although the behavioural aspects add yet another component to a complex problem, the global picture of the evacuation process is clarified by considering a (well-nigh) stationary regime and seeking robust “microscopic” characteristics of the flow. This yields a quantitative characterisation of the dynamics at the bottleneck.
The next section is dedicated to the description of the experiments. We then analyse the experimental results in terms of global flow properties, before turning to a more microscopic study. Let us mention that a concise account of the global flow properties observed in these experiments was proposed in a preliminary report [33].
Presentation of the evacuation experiments and methods
Experimental setup
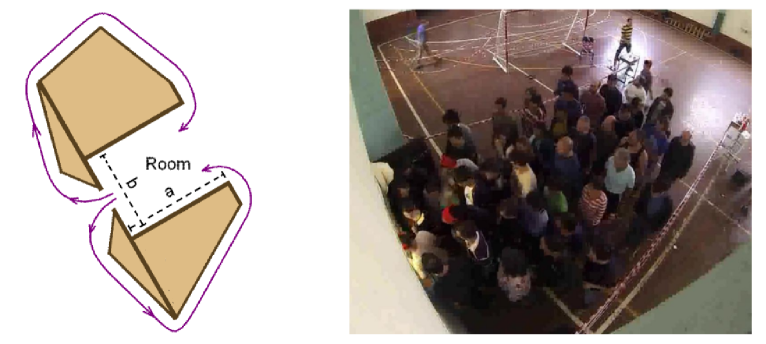
The bottleneck flow experiments were performed in the gymnasium of Centro Atómico Bariloche (CAB), Argentina, and involved more than 80 voluntary participants (students and researchers), aged 20 to 55 for the greatest part, with a woman/man ratio of about 1:3. The participants were asked to evacuate a delimited area through a -wide doorway; the geometry is sketched in Fig. 1. This doorway was created by moving -thick sliding walls. Safety was a central concern. Accordingly, the door jambs were padded with training mats. In addition, because of the possible ethics and safety issues, the protocol was validated beforehand by a local ethics committee and the experiments were prepared in collaboration with the Safety and Hygiene group of CAB. The evacuation process was supervised by three staff members who could stop it at any moment by blowing a whistle.
The experimental design is directly inspired by the experiments of Zuriguel’s group [30], but we introduced some important changes. In each evacuation experiment, a fraction of the participants was told to behave selfishly while the rest should behave politely. The selfish agents were selected randomly and varied between the experiments; they were asked to wear a red headscarf to be recognisable on the videos. They were allowed to “elbow their way through the crowd, with mild contacts but no violence whatsoever”. Their polite counterparts, on the other hand, were to “avoid any contact and try to keep their distance”. Before each experiment, all participants were asked to walk as close as possible to the door, without crossing it. Only then did we announce who would behave selfishly in the upcoming run.
The session started with a mock evacuation. Then, in a first series of experiments, here referred to as experiments with placid walkers, all participants were instructed to “head for the door”, without further specification. In the second series, they were told to hurry a bit more (andar con más ganas in Spanish), but without running, pushing or hitting others”; in this case, the walkers are said to be in a hurry or hurried. Therefore, the experiments are controlled by two orthogonal ’behavioural’ parameters, the fraction of selfish participants and the global placidity vs. hurry of the crowd. Overall, the experiments lasted for somewhat more than one hour.
Finally, the often reported lack of stationarity in the flow, along with the word of caution in Ref. [15] about the risk of faulty statistics with too small crowds, raised strong concerns in our minds about finite-size effects. To curb these effects, we decided to innovate by imposing “periodic boundary conditions” on the crowd: after egressing, participants followed a circuit that led to their re-injection into the room. In fact, to optimise the randomisation and limit the clustering of, say, fast participants, two re-injection circuits were set up, a short one and a longer one, and the evacuees were directed to either one alternatively. With this contrivance, about 250 passages through the door (between 177 and 352, to be precise) were obtained in each experiment.
Observation of uncontrolled egresses
To complement our controlled experiments, we filmed the egresses from a conference room at the various breaks of the TREFEMAC conference, a three-day Physics workshop held at CAB. The participants were informed of the recording once and for all. Some tendency to align before passing through the 82-cm-wide exit door was observed; the door was opened by an angle of more than . The data, presented in Fig. 3e, consist of about 260 individual passages. We also filmed two collective egresses from the auditorium of CAB at the end of the weekly seminars. The 75-cm-wide door was fully open and the 50 to 100 participants were unaware of the recording. Some were carrying a chair when passing through the doorway. The data, presented in Fig. 3f, consist of about 150 individual passages.
Video analysis
The controlled evacuations were recorded with two 60Hz, large-angle Go Pro cameras and one standard 60Hz camera. Two cameras were placed above the door, and one filmed the crowd in the room from a more distant point of view. Some of the videos are available as Supplemental Materials.
With respect to the image analysis, a standard method to get the egress times is to build a time line of passages (see Supplementary Fig. S1) by extracting a few lines of pixels just past the door from all video frames and then stitching them together. But to get more comprehensive information, we resort to a more exhaustive semi-manual analysis. We flick through all video frames, down-rated to 30Hz, clicking on the participants’ heads when they enter the semi-circular exit zone shown in Fig. 2 and pressing a dedicated key when they cross a line beyond the door. Both methods agree very well regarding the exit times.
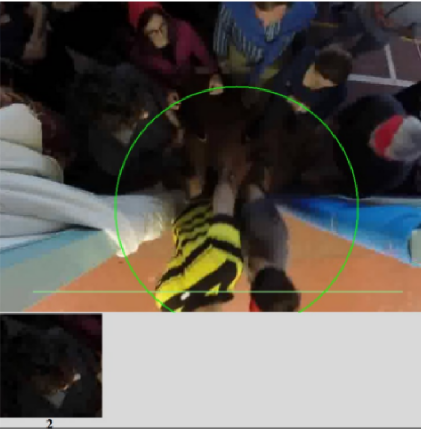
The density near the door is assessed on the basis of the occupancy of the exit zone, which is evaluated by detecting the pedestrians’ first entrance into this zone and their time of egress. The area of this zone () was chosen small enough to provide an estimate the local density at the door, while being large enough to limit the noise in the data. (Preliminary tests with a slightly larger rectangular zone yield similar results.) This method creates a small artefact in the most competitive evacuations, in which a few participants were shortly pushed out of the zone, due to a crowd movement, before moving in again and passing the door, a possibility that is discarded in our routine, hence a slight overestimation of the density. Moreover, no correction for optical distortion was performed, because we used the central part of the images. Despite this central position, the parallax resulting from the camera not being strictly at the zenith (owing to the impossibility to place it high enough) implies that the moment of detection of a given participant’s entrance into the exit zone somewhat depends on their height. This results in some inaccuracy with respect to the effective area of the zone in front of the door. To reflect this uncertainty, we introduced a pre-factor in the definition of the density unit (). Coarse geometric considerations lead to an upper bound of 30%, roughly speaking, on the error in the absolute value of the density in the worst case, for an uncertainty about the pedestrians’ heights of 30cm; this error is however expected to become smaller upon averaging density over time. All in all, our density evaluation method has its shortcomings, but given the experimental conditions under consideration and our video recordings, we deem it satisfactory.
Error bars and confidence intervals
Wherever relevant, we show error bars on the graphs to give an idea of the uncertainty due to the finite number of measurements we performed. In these cases, the data points are obtained as averages over a sub-sample of our measurements; the error bars are systematically on each side of the plotted data point, where is the standard deviation of the sub-sample and is the sub-sample size. If the sample points are uncorrelated, the central limit theorem implies that these error bars represent 95% confidence intervals. But two caveats should be heeded. First, not all the observables for which we plot error bars are uncorrelated. Still, their correlations are short-termed and weak, with relative magnitudes always below 13%, so it is reasonable to neglect these correlations. Secondly, perhaps more importantly, this definition of the confidence interval is valid only in the limit of large , whereas in our case is generally of order 100-300 (except for Fig. 7(right)).
Results
General observations
The experiments went as planned, without incident. The re-injection process operated properly, insofar as no gap in the inflow of pedestrians at the door was seen until the end of each evacuation: The flow was thus limited by the passage through the doorway, and not by travel times in the re-injection circuits.
Some selfish agents tried to overtake the rest of the crowd by walking near the lateral boundaries of the delimited area, instead of going into the thick of the crowd. More generally, we observed the formation of files of a few selfish agents following each other and taking advantage of the ‘voids’ opened by their predecessors. We believe that this follows from a general mechanism of clustering via a coupling between the structure of the medium and the motion of the particles (for instance, the pairing of electrons in a superconductor [34]), although it is true that, here, the formation of files may have been facilitated by the conspicuousness of the headscarf-wearing selfish agents. Importantly, given that selfish agents made their way faster, they were re-injected into the room more frequently. Accordingly, the effective fraction of selfish evacuees is generally larger than the prescribed (nominal) fraction . The results below will be presented as a function of , where relevant, rather than .
For polite crowds, i.e., at low , the egress looks orderly and contacts between pedestrians are avoided. Some polite participants yield deliberately and may even wave to their neighbours to go ahead. Very generally, there is no more than one pedestrian crossing the door at each time. For larger , the crowd in front of the door becomes more compact, contacts surge, and the flow looks more chaotic as several pedestrians try to walk through the door simultaneously. Such endeavours sometimes lead to clogs due to the formation of ‘arches’ of three to four participants across the door, particularly at . But these clogs are rapidly resolved, in about one second or less, and do not substantially delay the flow. In the most competitive evacuations ((hurried) and (hurried)), some agents grasp the door jamb and use it to pull themselves past the door; a few pedestrians spin around upon egressing, because of the contacts with their neighbours.
Macroscopically stationary, but intermittent dynamics
To go beyond these general observations, we extract the exit times of each pedestrian , numbered according to their order of egress, regardless of their identity (see the Video Analysis section for details). This allows us to compute the time-dependent flow rate , which is a moving average over a time interval , for each evacuation, viz.,
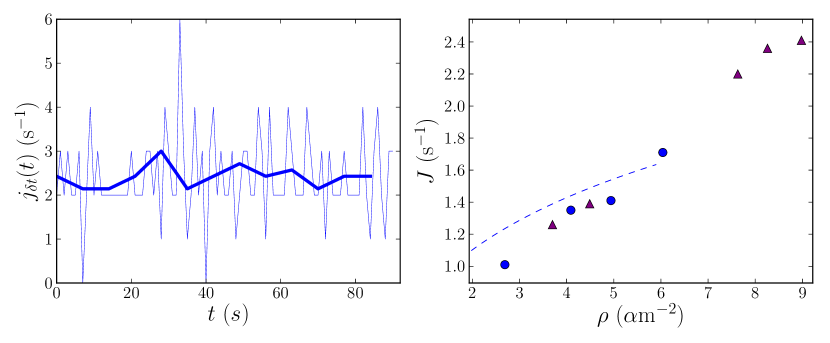
where is the Heaviside function, viz., if , 0 otherwise. For , the curve is extremely jagged, as can be seen in Fig. 3(left). It consists of somewhat irregular spikes that are all the larger as the evacuation is competitive (at large ). But averaging over a larger time window, , smears out these spikes (i.e., high-frequency oscillations) and yields a smoother curve, whose relative flatness proves that, macroscopically, the pedestrian flow is quasi-stationary: there is no upward or downward trend over extended periods of time (compared to the experiment duration). Interestingly, this quasi-stationary regime is reached almost immediately after the beginning of the experiments and persists until at least a dozen seconds before their ends222The experiment at (hurried) is a slight exception, insofar as the flow rate wanes moderately in the last 30 or 40 seconds.. The density of pedestrians in the exit zone is also roughly stationary in general (see Supplementary Fig. S2).
Our observation of macroscopically quasi-stationary dynamics contrasts with the non-stationary flows found in a number of related works [6, 12, 15]. We see two main reasons for this contrast: a 3-m-large gap (1-m-large in Ref. [15]) in front of the exit was initially left free of participants in Ref. [6], which explains the existence of a transient regime, and no re-injection of the participants was enforced in those earlier experiments. No matter how limited the transient effects are in our case, to further reduce them, we henceforth discard the first three and the last ten seconds of all experiments.
| Density () | Flow rate () | Number of full turns | ||
| Placid walk: ”Head for the door” | ||||
| 0% | 0% | 2.69 | 1.01 | 0 |
| 30% | 45% | 4.09 | 1.35 | 0 |
| 30% | 47% | 4.94 | 1.41 | 0 |
| 60% | 71% | 6.04 | 1.71 | 0 |
| Hurried walk: ”Head for the door more hurriedly” | ||||
| 0% | 0% | 3.70 | 1.26 | 0 |
| 10% | 18% | 4.49 | 1.39 | 0 |
| 60% | 71% | 7.63 | 2.20 | 3 |
| 90% | 92% | 8.26 | 2.36 | 3 |
| 100% | 100% | 8.98 | 2.41 | 5 |
Dependence of the flow rate on the density
We now compute the global flow rates for each experiment as time averages of the . The result is independent of and can also be expressed as , where is the number of passages and and are the first and last egress times, respectively. The values are listed in Table 1. Overall, grows monotonically with the concentration of selfish agents, and a peak value of 2.4 persons per second is reached at . But also increases when the placid crowd is asked to walk with more hurry (irrespective of the individual behaviours): for the same value of , namely 71%, surges by almost 30% following this change. The sensitivity of to the participants’ attitudes, while the geometry and the crowd are kept fixed, renders the divergence of published values for the exit capacity quite understandable.
Turning to a comparison with these published values, we see that the specific capacity corresponding to the placid polite crowd () is comparable to the rather conservative specification of the SFPE handbook [2], namely, , while the specific capacity for the polite but more hurried crowd () is similar to Kretz et al.’s measurement [5] () for a flow through -wide, -long bottleneck in normal conditions, and comparable to the value reported by Seyfried et al. [6] for a flow through -wide, -long bottleneck in normal conditions. At the other extreme, the highest flow rate that we measured, for (hurried), is slightly below, but similar to, the range of flow rates obtained in the more or less competitive evacuations of Pastor et al. [30] () for a 69-cm-wide (instead of 72 here) door.
The increase of with and with the agents’ degree of hurry in our experiments points to the absence of a ‘faster-is-slower’ effect, or, better said, a ‘more-competitive-is-slower’ effect. This may seem to be at odds with the conclusions of Pastor et al. [30, 15], but we claim that there is no contradiction: Unlike [30, 15], our experiments are not (all) above the threshold of competitiveness required to observe this effect. Indeed, in [30, 15], competitive participants were allowed to push each other with stretched arms, unlike in ours; the larger competitiveness is also reflected by the larger flow rates that they measured. The granular analogy then helps clarify the consequence of this difference [16] : In a granular hopper flow, as the panel supporting the grains is tilted and the effective gravity increases accordingly, in a first regime the flow becomes faster, because grains fall faster, but then it slows down under higher gravity. This slowdown is due to the stabilisation of clog-inducing arches by pressure. Models for pedestrian dynamics premised on Newton’s equations with “social forces” predict a similar non-monotonic effect of the pedestrians’ desired velocity [35]. As this velocity is increased, in a first regime the evacuation gets faster, but a second regime then emerges, where the repulsive forces between clustered pedestrians at the exit exceed the driving force associated with the desired velocity; the ensuing clogs reduce the flow rate. We presume that the evacuations of [30, 15] are all within the second regime, whereas ours are not.
Dependence of the flow rate on the pedestrian density
We have already noted that the flow rate is not uniquely determined by in our experiments. Following Seyfried et al.’s [6] idea that the discrepancies between the exit capacities in the literature are largely due to different initial crowd densities, we investigate the dependence of on the average density in the exit zone (shown in Fig. 2). Recall that the pre-factor in the density unit () was introduced so as to reflect the experimental uncertainty in our measurements, as explained in the Video Analysis section. In any event, the absolute density values would certainly be different for a different crowd (composed of, say, bulkier participants), but the evolution of flow properties with the density is expected to be robust. It is also worth mentioning that the highest values that we report for the density () are obtained for a tightly-packed crowd. These values may appear intriguingly large; it should however be emphasised that here is not the average density in the crowd, but its local value near the exit, where pedestrians are most densely packed; previous works have already shed light on the considerable deviations between the average density and its peak local value [36, 12].
The graph plotted in Fig. 3(right) confirms the relevance of the density parameter: the flow rates measured for different behavioural prescriptions collapse onto a smooth master curve (this is not achieved when plotting as a function of ). The monotonic increase of the flow rate with is remarkable. At low densities, the order of magnitude of and its growth with can be rationalised rather straightforwardly. First, notice that pedestrians in the exit zone are separated by on average. Besides, they generally egress one by one and lower their velocity when the door is blocked by somebody else’s passage. Should one crudely assume that this produces a halt, after which they gather speed as with a final velocity and a response time , one will easily obtain the time interval required to walk a distance , (provided that ), hence a flow rate . This is undoubtedly a very crude model, but its prediction, represented as dashed lines in Fig. 3(right)), is in broad agreement with the low-density data.
Much more surprisingly, keeps increasing up to high densities, , despite the fact that most fundamental diagrams in the literature suggest a decline of the flow above much smaller densities, due to jams [9, 37, 2, 38] (see Fig. 11 of Ref. [6]). The uncertainty in our assessment of the density can hardly be responsible for this discrepancy: The tight packing of the crowd in our most competitive evacuation is compatible with the value that we report. Instead, at such high densities the flow rate is probably not uniquely determined by , but strongly depends on other parameters, such as the pressure in the crowd. Indeed, since the tightly-packed crowd is nearly incompressible, mechanical pressure can increase vastly, hence stabilising clogs, while changes only little. Crowd turbulence [36, 39] may also arise, thereby affecting the density and flow. In our settings, excessive mechanical pressures and turbulence were warded off thanks to the strict instructions given to the participants.
Importantly, the dependence of the flow rate on the density holds not only for the mean values of these quantities, but often also for their temporal fluctuations and . Here, the time-dependent local density is defined as the average number of pedestrians in the exit zone between and , divided by the zone area. Indeed, the correlator
where the brackets denote a time average, indicates the existence of statistically significant positive correlations between the flow rate and the density fluctuations (Supplementary Fig. S3), when they are averaged over time intervals of a few seconds. However, correlations are only moderate. It should be noted that these correlations are not visible in the most competitive experiments, and to a lesser extent 100% (hurried).
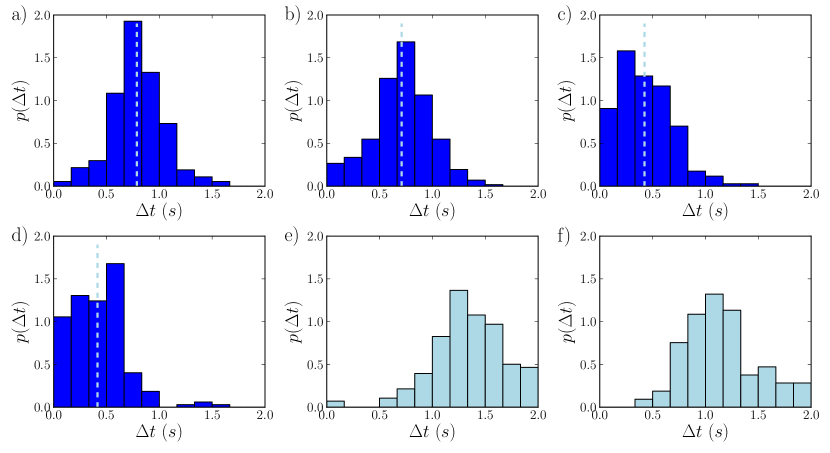
Distribution of time lapses between successive egresses
On average, the flow rate is related to the mean time lapse between successive egresses via . But, since fluctuations are large, it is actually worth considering the full distribution of time lapses. Figure 4 reveals substantial differences in these distributions when the crowd behaviour is varied. Pedestrian flows with a mostly polite crowd display a relatively sharp peak at a characteristic time slightly below one second, and a depleted region at low . Interestingly, these features are also observed in uncontrolled collective egresses from conference rooms through doorways of similar widths, as shown in Fig. 4e-f (these uncontrolled egresses were described above). In these uncontrolled settings, the part of the distribution corresponding to large is irrelevant, insofar as it is due to the foot-dragging of participants within the conference room, rather than to the dynamics at the exit.
On the other hand, competitive egresses at large (in our controlled experiments) do not present a very well defined peak and the most frequent time lapses are shifted to smaller values. Most conspicuously, they include a non-negligible fraction of very short time lapses , which correspond to quasi-simultaneous egresses.
Focusing on the large values of , caused by jams, the data corresponding to our most competitive evacuation (, hurried) seem to support Garcimartin et al.’s [29, 30, 15] claim of a slow decay of at large , characterised by a power-law-like tail: We find a higher likelihood for the tail to be power-law-like than exponential ( for a continuous data set, according to the method of Clauset et al. [40] implemented in [41]). In other situations, our data are insufficient to validate this claim, and even tend to contradict it in the presence of polite crowds.
Temporal correlations in the flow
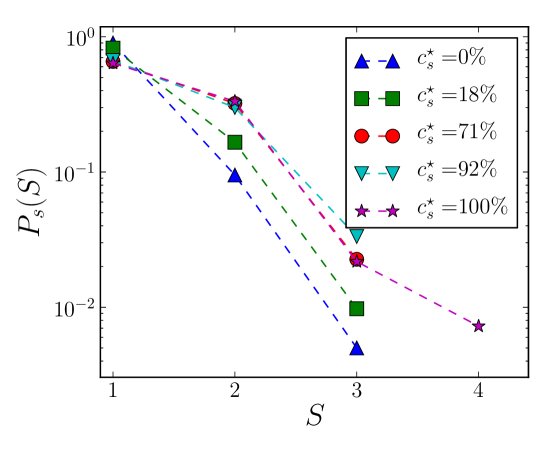
Bursts of escapes
The existence of short time lapses hints at bursty dynamics. Here, passages through the door will belong to a burst of escapes if they are separated by less than 60% of the mean time lapse of the considered experiment, viz., (we have checked that the results are robust to small variations of this criterion). Thus defined, bursts do not correspond to intervals of fast flow separated by long clogs (only short-lived clogs were observed here), but to almost simultaneous escapes. The distribution of burst sizes is plotted in Fig. 5. As expected, egresses of polite crowds consist of isolated escapes, with a small proportion of bursts of pedestrians or more (, with probability ), whereas bursts of up to pedestrians are observed with more selfish and competitive crowds. Our data are perfectly compatible with the (fast) exponential decay of reported in [15], but are insufficient to be assertive in this regard. Incidentally, note that, in all but one experiment ((hurried)), the average fraction of selfish agents in a burst increases with the size of the burst. This is particularly noticeable in the “placid” experiments. However, collecting statistics over the entire evacuation, we have not detected substantial temporal correlations in the behaviours of successively egressing participants.
Alternation between short and long time lapses, generalised ”zipper effect”
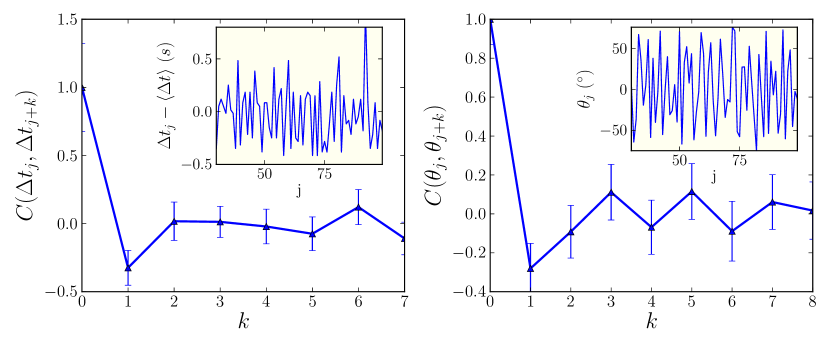
Although successions of short time lapses exist (bursts of size ), statistically significant anti-correlations between successive prevail by far, in all experiments but two ((placid) and, to a lesser extent, (placid)). This is apparent in the negative dip in the correlation functions of successive time lapses (ordered by the rank of egress),
where the brackets denote an average over all pedestrians in the experiment, an example of which is shown in Fig. 6. This means that, in general, there is an alternation between shorter time lapses and longer ones. Such an alternation has already been observed in cooperative pedestrian flows at the entrance of (long) bottlenecks [27, 8, 6]. It was then ascribed to a “zipper effect”, whereby pedestrian lanes form in the bottleneck and need to be intercalated, because the bottleneck width does not allow pedestrians from different lanes to stand shoulder to shoulder. Within each lane, the headway that pedestrians maintain with respect to the walker just in front of them (of order one second in [8]) imposes a finite minimal distance between the pedestrians. But there is no such headway between distinct lanes, so that a pedestrian may come close to contact with a walker from a neighbouring lane, without being able overtake this neighbour because of the constrained lateral space. Albeit alluring, this scenario does not apply for our experiments, where
strong anti-correlations are also seen in very competitive and disorderly evacuations, for instance at (hurried). In the latter, no lanes whatsoever can form. To explain the alternation, we believe that a more general mechanism should be put forward: If some free space is available right in front of them, pedestrians will step forward and try to cross the door at (almost) the same time as their predecessor (who comes from another direction). But they will not risk this manoeuvre if there is not sufficient headway just in front of them, in particular if a competition for the exit already blocks the door.
To bolster our claim, let us study the pedestrians’ angles of incidence into the exit zone, the angle corresponding to normal (“central”) incidence. The distributions of are approximately flat over an interval of the form , where the maximal angle seems to increase with the competitiveness of the evacuation (Supplementary Fig. S4). More relevantly, we remark that the directions exhibit strong anti-correlations in time, pointing to the prevalence of alternations between small and large . This is striking, for instance, in the autocorrelation function,
plotted in Fig. 6(right) for (hurried), where the negative dip for successively egressing pedestrians () lies more than below 0, where is the standard deviation of the autocorrelations of (whose average gives ) and is the number of points used to compute the average. Moreover, if pedestrians and egress in fast succession (), on average their angles of incidence differ more than if their egresses are separated by a longer delay (). This is true in strictly all experiments, with the most marked contrasts for polite crowds, e.g.,
It confirms that the short time lapses correspond to a participant from another direction passing through the door very shortly after the previous one. Conversely, the headway left behind a participant coming from the same direction is reflected by the fact that one systematically has to wait longer (on average and in median) to see another participant egress from the same direction (within ) than from a randomly selected direction in the empirical distribution of . The foregoing discussion implies that time lapses longer than the median value are not due to slower, lazier, or more patient pedestrians, but result from the microscopic organisation of the constricted flow.
We should mention that alternations between short and long are not seen in the uncontrolled egresses, where people generally passed through the door one by one, in an orderly and non-competitive way, sometimes even starting to align beforehand.
Dynamics in the exit zone
Dwell time in the exit zone
So far we have focused on the time lapses between egresses. But, from the individual pedestrian’s perspective, a possibly more relevant duration is the time they have to wait in the above-defined exit zone, of area , before they can egress. Let us call this dwell time (or waiting time) . Its mean value is related to the mean time lapse via ; the derivation is presented as Supplementary Information.
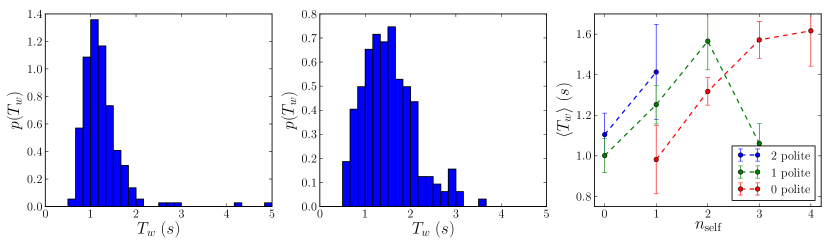
Sharply peaked distributions correspond to orderly evacuations, with approximately equal waiting times for all. This case is exemplified in Fig. 7(left), for (hurried). On the contrary, broad reveal the presence of heterogeneity and/or disorder. For (hurried), since the crowd is behaviourally homogeneous, the breadth of (Fig. 7(right)) has to be ascribed to disorder. On the other hand, for inhomogeneous crowds, the overall distribution mingles the two distinct types of pedestrians.
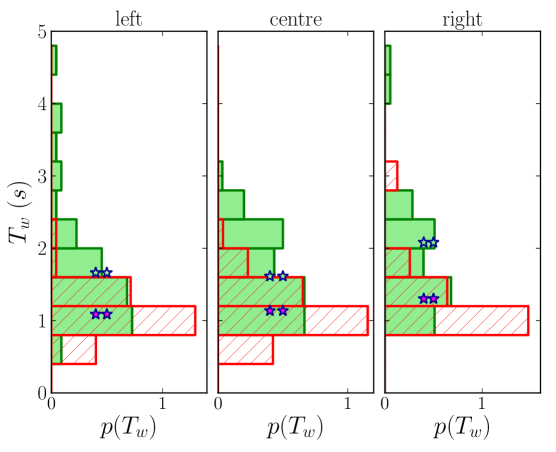
To refine the analysis, we study the histograms of as a function of the pedestrian’s behaviour, namely, whether they are polite agents (PolA) or selfish moving agents (SelMA), and their direction of incidence into the exit zone: from the left (), from the centre (), or from the right (). An example of such a histogram is shown in Fig. 8. Beyond the statistical noise, we see that, in all cases, the distributions are peaked at a value around 1s and, as expected, PolA’s distributions are shifted to larger , and stretched, compared to SelMA’s. For either type of behaviour, the distributions look relatively similar for all incident directions 333We observed a surprising asymmetry between right and left, in some cases, e.g., (hurried), where the average waiting time differs by more than . This could be due to statistical noise, individual preferences for one side, or a slight, unnoticed asymmetry in the setup., with a noticeable exception: PolAs display more frequent outliers at large if they come from the sides than if they come from the centre. Indeed, PolA tends to be swept along by the pedestrian stream if she comes from the centre, whereas she can be blocked at the sides of the door otherwise. There is no such a marked effect for SelMA, probably because the latter tries her hardest, and manages, to egress rapidly in any event.
How do the depend on the population in the exit zone (averaged over the pedestrian’s dwell time)? Figure 7(right) evinces that, in the experiments with hurry, SelMA’s mean waiting time very generally grows with the number of selfish agents in the zone, for any fixed number of polite ones, and also increases when there are more polite participants, for a fixed number of selfish ones. These features hold true in the placid experiments (Supplementary Fig. S5), with the exception that seems to shorten in the competitive situations where 3 participants are simultaneously in the zone, perhaps due to a sampling bias. On the whole, these observations also apply for PolA’s waiting times, but the picture is less clear. The positive correlation between the waiting time and the occupancy of the zone is rather intuitive, but it is not trivial, for at least two reasons. First, it implies that statistically the influence of the global evacuation competitiveness on is outshone by the effect of some local parameters, more precisely, the exit zone occupancy. Secondly, escapes come in faster succession (shorter ) if the zone is more crowded.
Priority rules in the zone
The aforementioned correlations are only valid in a statistical sense. We have not found any law that can accurately predict as a function of the local parameters. Nevertheless, can some generally valid “priority rules” for the flow be unveiled? Let us study to whom an agent of a given type yields, that is to say, who entered the zone later than this agent but egressed before. By listing these pedestrians, we find that overall SelMA yields to fewer pedestrians than PolA and that, for both types, it is more common to yield to selfish pedestrians than to polite ones, which is not so surprising. It should however be stressed that this tendency is not systematic: polite agents (possibly carried along by the pedestrian flow) also overtake their selfish counterparts from time to time. On the other hand, in virtually no instance does SelMA yield to a polite pedestrian coming from the same direction (left, centre or right). This rule only suffers two exceptions over the whole set of experiments.
Disorder, pressure, and pedestrian “vortices”
Clearly, these “priority rules” are limited in scope and cannot tell us how orderly the flow is. To quantify disorder, we choose to compute the average difference between the order of entrance of pedestrian i in the zone and their order of egress , viz., . The disorder estimator increases with (see Supplementary Fig. S6), but also with ; which of these two parameters is best correlated with is not obvious. But it is noteworthy that the crowd at has a larger value than that at , which points to the enhancement of disorder due to behavioural heterogeneity.
Besides disorder, another practically relevant feature of the evacuation is the pressure exerted on the participants. Indeed, suffocation and compressive asphyxia, originating in the compression of the lungs, have been reported as a cause of death in major crowd disasters [42]. Accordingly, after each experiment, we asked a dozen randomly picked participants to rate the level of mechanical pressure that they experienced during the evacuation from 1 to 10, for want of more objective measurements of pressure. Admittedly, this is a subjective evaluation by the participants, which will yield mostly qualitative results. Still, the perceived pressure follows a clear trend, more precisely, a monotonic increase with the density in the exit zone (and thus also with ), as shown in Supplementary Fig. S7). Therefore, competitive evacuations, associated with larger densities at the door, involve more disorder and higher pressure than their more cooperative counterparts. The most competitive ones even feature signs of incipient turbulence, in the form of “vortices” at the exit, i.e., participants spinning around a full 360∘ when egressing (see Table 1 and videos in the Supplemental Materials).
Summary and outlook
In summary, we have performed pedestrian flow experiments through a 72-cm-wide door, in which a (variable) fraction of the participants were asked to behave selfishly, while the rest behaved politely. Irrespective of these behaviours, a first series of experiments was conducted with placid walkers and a second one with hurried walkers. By re-injecting egressing participants into the room, we managed to improve the statistics. Furthermore, despite instantaneous fluctuations, the pedestrian flow was found to be quasi-stationary at the macroscopic scale, unlike in other experiments [6, 15].
The flow rate gets higher for larger and with more hurried walkers. The absence of a ‘faster-is-slower’ effect does not contradict its possible occurrence [29, 30] when one considers crowds above a competitiveness threshold.
Regardless of the behaviours, the flow rate and other flow properties such as the disorder in the passages and the pressure perceived by the participants exhibit a simple dependence on the density in the exit zone. Thus, our results suggest that in a coarse macroscopic approach, and for a given composition of the crowd, the behavioural aspects can be left aside in favour of the density ; this confirms the key role played by the latter in determining the flow rate [6]. These variations with suggest corrections to simple traffic theories based on the assumption that at a bottleneck the system adopts the local parameters that maximise the flow rate, if the inflow is sufficiently large. Instead, our findings indicate that the selected density at the bottleneck is controlled by the pedestrians’ behaviours.
Somewhat surprisingly, was observed to grow monotonically with up to close-packing (), despite the jams predicted by most fundamental diagrams in the literature at these densities [9, 37, 2, 38]. In fact, we believe that at high densities the global flow rate will strongly depend on other parameters, in particular, the pressure in the crowd, thus, to what extent people are pushing their neighbours. Here, the participants were not allowed to push. Yet, the evacuation dynamics clearly became more disorderly with increasing and increasing hurry. This disorder was notably reflected in the distribution of time lapses between successive escapes: displays a relatively sharp peak at of order for polite crowds. In more competitive evacuations the low- region gets populated; bursts of quasi-simultaneous escapes occur and seem to be exponentially distributed in size. In the most competitive evacuations, some signs of incipient flow turbulence were even detected, e.g., pedestrian “vortices”. To what extent these features can be extrapolated to extreme conditions of emergency still needs to be ascertained.
Shorter and longer time lapses were found to alternate between successive escapes in almost all experiments. We explained this in terms of a generalised zipper effect, whereby pedestrians strive to keep a finite headway behind an agent walking in the same direction, while coming close to contact with those from another direction. This idea is supported by the marked anti-correlations in the angles of incidence at the door.
Finally, we investigated the pedestrians’ dwell time in the exit zone. The mean dwell time clearly increases with the occupancy of the zone, especially for selfish agents. Not surprisingly, is shorter and more narrowly distributed for selfish agents. Also, polite pedestrians coming from the sides display more outliers at large .
Several of the effects observed in our “microscopic” analysis of the evacuation dynamics are rather intuitive. But their quantitative characterisation opens the door (so to speak) to more thorough tests of pedestrian flow models, as in Ref. [43], and, accordingly, more precise understanding of the process. Our study may also prompt the idea that the effect of the pedestrians’ behaviours on the evacuation dynamics is amenable to a simple description.
Acknowledgements
The authors are grateful to the Grupo de Higiene y Seguridad of CAB for their help in devising safe evacuation experiments, to all members of the FiEstIn group, in particular to Guillermo Abramson and Damián Zanette, to Alejandro Kolton and Pablo Gleiser for lending us their cameras, and to all the voluntary participants. A.N. thanks Iker Zuriguel for a useful discussion. This work received partial funding from CONICET (under Grant No. PIP 11220110100310) and CNEA, both Argentinian agencies.
Author contributions statement
A.N., S.B., and M.K. conceived and conducted the experiments. A.N. analysed the results and wrote the paper. All authors discussed the analysis and reviewed the manuscript. (S.B. and M.K. contributed equally to this work.)
Additional information
The authors declare no competing financial interests.
References
- [1] A. H. Buchanan, Fire engineering design guide. Centre for Advanced Engineering, University of Canterbury, 2001.
- [2] P. J. DiNenno, SFPE handbook of fire protection engineering. SFPE, 2008.
- [3] W. Daamen and S. Hoogendoorn, “Emergency door capacity: influence of door width, population composition and stress level,” Fire technology, vol. 48, no. 1, pp. 55–71, 2012.
- [4] D. Yung, G. Hadjisophocleous, and G. Proulx, “Modelling concepts for the risk-cost assessment model firecam’,” Fire Safety Science, vol. 5, pp. 619–630, 1997.
- [5] T. Kretz, A. Grünebohm, and M. Schreckenberg, “Experimental study of pedestrian flow through a bottleneck,” Journal of Statistical Mechanics: Theory and Experiment, vol. 2006, no. 10, p. P10014, 2006.
- [6] A. Seyfried, O. Passon, B. Steffen, M. Boltes, T. Rupprecht, and W. Klingsch, “New insights into pedestrian flow through bottlenecks,” Transportation Science, vol. 43, no. 3, pp. 395–406, 2009.
- [7] J. Zhang, W. Klingsch, A. Schadschneider, and A. Seyfried, “Transitions in pedestrian fundamental diagrams of straight corridors and t-junctions,” Journal of Statistical Mechanics: Theory and Experiment, vol. 2011, no. 06, p. P06004, 2011.
- [8] S. P. Hoogendoorn and W. Daamen, “Pedestrian behavior at bottlenecks,” Transportation science, vol. 39, no. 2, pp. 147–159, 2005.
- [9] V. Predtechenskii and A. I. Milinskiĭ, Planning for foot traffic flow in buildings. National Bureau of Standards, US Department of Commerce, and the National Science Foundation, Washington, DC, 1978.
- [10] A. Seyfried, M. Boltes, J. Kähler, W. Klingsch, A. Portz, T. Rupprecht, A. Schadschneider, B. Steffen, and A. Winkens, “Enhanced empirical data for the fundamental diagram and the flow through bottlenecks,” in Pedestrian and Evacuation Dynamics 2008, pp. 145–156, Springer, 2010.
- [11] J. Liddle, A. Seyfried, W. Klingsch, T. Rupprecht, A. Schadschneider, and A. Winkens, “An experimental study of pedestrian congestions: influence of bottleneck width and length,” arXiv preprint arXiv:0911.4350, 2009.
- [12] J. Liddle, A. Seyfried, B. Steffen, W. Klingsch, T. Rupprecht, A. Winkens, and M. Boltes, “Microscopic insights into pedestrian motion through a bottleneck, resolving spatial and temporal variations,” arXiv preprint arXiv:1105.1532, 2011.
- [13] A. Seyfried, B. Steffen, A. Winkens, T. Rupprecht, M. Boltes, and W. Klingsch, “Empirical data for pedestrian flow through bottlenecks,” in Traffic and Granular Flow’07, pp. 189–199, Springer, 2009.
- [14] R. Nagai, M. Fukamachi, and T. Nagatani, “Evacuation of crawlers and walkers from corridor through an exit,” Physica A: Statistical Mechanics and its Applications, vol. 367, pp. 449–460, 2006.
- [15] A. Garcimartín, D. Parisi, J. Pastor, C. Martín-Gómez, and I. Zuriguel, “Flow of pedestrians through narrow doors with different competitiveness,” Journal of Statistical Mechanics: Theory and Experiment, vol. 2016, no. 4, p. 043402, 2016.
- [16] I. Zuriguel, D. R. Parisi, R. C. Hidalgo, C. Lozano, A. Janda, P. A. Gago, J. P. Peralta, L. M. Ferrer, L. A. Pugnaloni, E. Clément, et al., “Clogging transition of many-particle systems flowing through bottlenecks,” Scientific reports, vol. 4, 2014.
- [17] N. Shiwakoti, M. Sarvi, G. Rose, and M. Burd, “Animal dynamics based approach for modeling pedestrian crowd egress under panic conditions,” Transportation research part B: methodological, vol. 45, no. 9, pp. 1433–1449, 2011.
- [18] S. Soria, R. Josens, and D. Parisi, “Experimental evidence of the “faster is slower” effect in the evacuation of ants,” Safety science, vol. 50, no. 7, pp. 1584–1588, 2012.
- [19] A. Garcimartín, J. Pastor, L. M. Ferrer, J. Ramos, C. Martín-Gómez, and I. Zuriguel, “Flow and clogging of a sheep herd passing through a bottleneck,” Physical Review E, vol. 91, no. 2, p. 022808, 2015.
- [20] I. Zuriguel, J. Olivares, J. M. Pastor, C. Martín-Gómez, L. M. Ferrer, J. J. Ramos, and A. Garcimartín, “Effect of obstacle position in the flow of sheep through a narrow door,” Physical Review E, vol. 94, no. 3, p. 032302, 2016.
- [21] D. R. Parisi, S. A. Soria, and R. Josens, “Faster-is-slower effect in escaping ants revisited: Ants do not behave like humans,” Safety science, vol. 72, pp. 274–282, 2015.
- [22] M. Casanova, Resumen Histórico del Gran Incendio de la Compañía. Libr. Española de Nicasio Ezquerra, 1863.
- [23] A. P. Hatch, Tinder Box: The Iroquois Theatre Disaster 1903. Chicago Review Press, 2003.
- [24] N. Kugihara, “Effects of aggressive behaviour and group size on collective escape in an emergency: A test between a social identity model and deindividuation theory,” British Journal of Social Psychology, vol. 40, no. 4, pp. 575–598, 2001.
- [25] A. Nicolas, S. Bouzat, and M. N. Kuperman, “Statistical fluctuations in pedestrian evacuation times and the effect of social contagion,” Phys. Rev. E, vol. 94, p. 022313, Aug 2016.
- [26] H. C. Muir, D. M. Bottomley, and C. Marrison, “Effects of motivation and cabin configuration on emergency aircraft evacuation behavior and rates of egress,” The International Journal of Aviation Psychology, vol. 6, no. 1, pp. 57–77, 1996.
- [27] S. P. Hoogendoorn, W. Daamen, and P. H. Bovy, “Extracting microscopic pedestrian characteristics from video data,” in Transportation Research Board Annual Meeting, pp. 1–15, 2003.
- [28] W. Daamen and S. Hoogendoorn, “Experimental research of pedestrian walking behavior,” Transportation Research Record: Journal of the Transportation Research Board, no. 1828, pp. 20–30, 2003.
- [29] A. Garcimartín, I. Zuriguel, J. Pastor, C. Martín-Gómez, and D. Parisi, “Experimental evidence of the ¨faster is slower¨ effect,” Transportation Research Procedia, vol. 2, pp. 760–767, 2014.
- [30] J. M. Pastor, A. Garcimartín, P. A. Gago, J. P. Peralta, C. Martín-Gómez, L. M. Ferrer, D. Maza, D. R. Parisi, L. A. Pugnaloni, and I. Zuriguel, “Experimental proof of faster-is-slower in systems of frictional particles flowing through constrictions,” Physical Review E, vol. 92, no. 6, p. 062817, 2015.
- [31] M. Moussaïd, M. Kapadia, T. Thrash, R. W. Sumner, M. Gross, D. Helbing, and C. Hölscher, “Crowd behaviour during high-stress evacuations in an immersive virtual environment,” Journal of The Royal Society Interface, vol. 13, no. 122, p. 20160414, 2016.
- [32] D. Helbing, L. Buzna, A. Johansson, and T. Werner, “Self-organized pedestrian crowd dynamics: Experiments, simulations, and design solutions,” Transportation science, vol. 39, no. 1, pp. 1–24, 2005.
- [33] A. Nicolas, S. Bouzat, and M. Kuperman, “Influence of selfish and polite behaviours on a pedestrian evacuation through a narrow exit: A quantitative characterisation,”, Proceedings of the 8th International Conference on Pedestrian and Evacuation Dynamics (2016), p. 84, arXiv preprint arXiv:1608.04863, 2016.
- [34] J. Bardeen, L. N. Cooper, and J. R. Schrieffer, “Theory of superconductivity,” Physical Review, vol. 108, no. 5, p. 1175, 1957.
- [35] D. Parisi and C. Dorso, “Why ’faster-is-slower’ in evacuation process,” in Pedestrian and Evacuation Dynamics 2005, pp. 341–346, Springer, 2007.
- [36] D. Helbing, A. Johansson, and H. Z. Al-Abideen, “Dynamics of crowd disasters: An empirical study,” Physical review E, vol. 75, no. 4, p. 046109, 2007.
- [37] U. Weidmann, Transporttechnik der Fussgänger: Transporttechnische Eigenschaften des Fussgängerverkehrs (Literaturauswertung). ETH, IVT, 1993.
- [38] G. Flötteröd and G. Lämmel, “Bidirectional pedestrian fundamental diagram,” Transportation research part B: methodological, vol. 71, pp. 194–212, 2015.
- [39] W. Yu and A. Johansson, “Modeling crowd turbulence by many-particle simulations,” Physical review E, vol. 76, no. 4, p. 046105, 2007.
- [40] A. Clauset, C. R. Shalizi, and M. E. Newman, “Power-law distributions in empirical data,” SIAM review, vol. 51, no. 4, pp. 661–703, 2009.
- [41] J. Alstott, E. Bullmore, and D. Plenz, “powerlaw: a python package for analysis of heavy-tailed distributions,” PloS one, vol. 9, no. 1, p. e85777, 2014.
- [42] D. Helbing and P. Mukerji, “Crowd disasters as systemic failures: analysis of the love parade disaster,” EPJ Data Science, vol. 1, no. 1, pp. 1–40, 2012.
- [43] T. Robin, G. Antonini, M. Bierlaire, and J. Cruz, “Specification, estimation and validation of a pedestrian walking behavior model,” Transportation Research Part B: Methodological, vol. 43, no. 1, pp. 36–56, 2009.