Role of nonlinearity in resistive switching phenomena of lanthanum calcium manganate heterostructures
Abstract
The present paper examines the influence of a nonlinear relationship between the local oxygen-vacancy concentration and the local resistivity on resistive switching effects in complex oxides. The continuity equation has been used as a model for the motion of oxygen vacancies when a periodic time-dependent electrical current is applied. The question of endurance of the switching cycles is discussed. It is found that nonlinearity of the resistivity-concentration dependence enhances the endurance.
pacs:
73.40.-c, 73.50. -hI Introduction
It has been recently shown Tang et al. (2016) that the shock-wave formation strongly influences resistive switching effect in manganese oxides. These authors first pointed out that it is a shock wave of oxygen vacancies that provides the change of the resistance.
Resistive switching was discovered in 1960s in oxides sandwiched between metal electrodes Hickmott (1962); Nielsen and Bashara (1964); Gibbons and Beadle (1964). It had been realized that this effect was promising for non-volatile memory applications Nielsen and Bashara (1964). Since then resistive switching phenomena has puzzled a lot of scientists. The burst of scientific activities begun in 2008 when two-terminal devices that demonstrate hysteretic current–voltage behavior were understood as memristor devices Strukov et al. (2008). Nowadays, the resistive switching effect is one of the best-known phenomena in complex oxide-based heterostructures proposed for a novel memory cell. A lot of scientists and engineers are engaged in studies and applications of the resistive switching. Presently, some plausible models for resistive switching in oxides have been reportedWaser Rainer and Aono Masakazu (2007); Sawa (2008); Lee et al. (2015). Among them is the voltage-enhanced oxygen-vacancy migration model (VEOVM) for bipolar resistive switchingRozenberg et al. (2010).
An essential role of oxygen vacancies and their motion on the resistive switching effect in transition-metal oxides has been established in last decades Waser Rainer and Aono Masakazu (2007); Sawa (2008); Bryant B. et al. (2011). In particular, oxygen diffusion is considered to be a key factor of the switching in Pr0.7Ca0.3MnO3 with Schottky-like barrier at the interface Nian et al. (2007); Sawa (2008). The experimentally observed asymmetry of current-voltage characteristics has been recently explained using the oxygen diffusion scenario in yttrium barium copper oxide Plecenik et al. (2012). Rearrangements of oxygen vacancies diffusing to and away from metal-complex oxide interfaces can although correlate with the evolution of the resistance of the La0.5Ca0.5MnO3 based memristive device Wang et al. (2012).
In this paper, we chose lanthanum calcium manganate to model the resistive switching phenomenon in metal-complex-oxide-metal heterostructures. The doped manganese oxide La0.7Ca0.3MnO3 (LCMO) is attractive due to its benefits for practical applications at room temperature, it is already being actively investigated Shang et al. (2006); Dong et al. (2007). It was shown that the LCMO-based memristive device can demonstrate good endurance of switching cycles Yang et al. (2010).
It is known that the oxygen nonstoichiometry of complex oxides affects their resistivity. For instance, a shift of the metal-to-insulator transition as a function of the oxygen deficiency () in perovskite-type La0.7Ca0.3MnO3-δ thin films exists in the range of 00.21Rubio-Zuazo et al. (2014). The film-substrate interface can influence the resistive properties of epitaxial La0.7Ca0.3MnO3 thin films as well Lu et al. (2000).
Previous studies assumed that there is a linear relationship between the local resistivity and the oxygen-vacancy concentration in manganites Rozenberg et al. (2010); Ghenzi et al. (2010); Tang et al. (2016). However, in reality the form of such dependence is more complicated. For example, the local electrical resistivity of transition-metal oxides with a perovskite-type structure as a nonlinear function of the oxygen-vacancy concentration was obtained experimentally in a wide temperature range Malavasi et al. (2004); Baskar (2008). As was pointed out, the type of such dependence can strongly affect the hysteresis observed in metal-oxide heterostructures Zhao-Liang and Dong-Min (2013). The goal of this paper is to explore how it controls the resistive switching in La0.7Ca0.3MnO3-δ .
II Model
We follow the idea that the formation of a shock wave provides a sharp change in the resistance of manganese oxides Tang et al. (2016) and start with the one-dimensional continuity equation for mobile oxygen vacancies
| (1) |
where the local concentration of mobile vacancies changes in time , and the total oxygen-vacancy current is divided in two parts: a diffusion current and a drift current , so that .
The flow of vacancies from high to low concentrations along the space coordinate normal to the cross-section of the LCMO-based heterojunction can be described by the Fick’s first law of diffusion , while the electric field is involved in the resistance switching as the driving force for the drift . We note that according to the Einstein relation the mobility of the moving charge is connected with the diffusion constant via , where is the Boltzmann constant, and is the absolute temperature in kelvins.
The probability for oxygen vacancy to overcome the energy barrier and jump back () or forth () by the distance between any two neighbouring lattice sites is
with being the attempt frequency, and , the activation energy for vacancy motion. Due to the activation-barrier lowering caused by the electric field applied to the metal electrodes oxygen vacancies in LCMO are mobile enough to migrate detectably at room temperatureWarnick et al. (2011).
The average velocity of such motion is given by
We restrict ourselves to the case of small electric fields when the average mobility of the oxygen vacancies is
| (2) |
The connection between the local electric field and the electrical current is determined by the Ohm’s law , where the resistivity is some function of the oxygen-vacancy concentration. In La0.7Ca0.3MnO3-δ compounds, as can be extracted from the electrical resistivity versus temperature measurements for the samples with the oxygen deficiency = 0, 0.01, 0.025, the relationship between the local resistivity and the oxygen-vacancy concentration is a nonlinear one Malavasi et al. (2004):
| (3) |
where the , , and are constants derived from the experimental data.
Note that the effect of oxygen vacancies in metallic LCMO is negligible and the resistivity tends to zero . So we can write the total content of oxygen vacancies as , where has the meaning of the concentration of mobile oxygen vacancies, and is the vacancy concentration at which the metal-insulator transition occurs.
The diffusivity is usually of the form , where being the frequency factor. Therefore, the drift of diffusing species with the average mobility (2) is given by
To include the possibilities for non-harmonic driving current , by which oxygen vacancies are transported from one site to another, let us model its time dependence as , where is Jacobi elliptic sine function and is the complete elliptic integral of the first kind. This function is periodic with period and its shape can be continuously varied between the sine-wave (at ) and the square-wave (at ).
Based on the continuity equation (1), migration of the charged species in a thin film of manganese oxide with a thickness normal to the metal/LCMO interface can be modeled by the equation
| (4) |
in which the first term tells us that the oxygen-vacancy content changes in time, the second term represents a drift current of charged species, and the third one describes diffusion driven by the concentration gradient.
On introducing new scales for variables
and such that being the maximum value of the electrical current applied, the nonlinear equation (4) becomes a dimensionless one:
| (5) |
where
, , and the diffusion coefficient can assumed constant at the given temperature.
Note that if , then the equation (5) reduces to the well known nonlinear Burgers’ equation. For small enough diffusion it has shock wave solutions in the form of an abrupt step (that is a jump) in concentration.
Consider the uniform distribution of the oxygen vacancies initially. As it was noted Dong et al. (2007); Liu et al. (2010), the system of interest is able to switch continuously between two resistive states as long as there is a source of oxygen vacancies at the metal/LCMO interface. Therefore, we suggest that the concentration at the surface of the LCMO is maintained at the initial value, , due to surface oxygen-exchange processes Bryant B. et al. (2011), while surface flux across the interface between the substrate and the LCMO is assumed to be zero (cause, in practice, there is no flow of the moving species through it). This can be expressed as boundary conditions
| (6) |
When the electric current is supplied, oxygen vacancies are driven backwards or forwards depending on its polarity. Such a motion is strongly coupled with the resistivity of the complex oxide. To elucidate the effects of this coupling on the transport properties, the simplest approach is to solve the nonlinear diffusion equation (5) numerically.
III Results and discussion
Let us investigate the Eq. (5) with the boundary conditions (6) to establish the interdependence between the concentration profile in LCMO thin film and the switching of the contact resistance. This requires the values of dimensionless parameters and to be specified. The parameter incorporates the thin-film thickness , the diffusion coefficient of the medium, as well as the period of the electrical signal . To make the specific calculations we assume , which gives us stable switching behavior. The parameter is estimated from the condition that the resistive switching effect at room temperature in the lanthanum calcium manganate is typically observedDong et al. (2007); Yang et al. (2010); Liu et al. (2010) at the voltage of about between the electrodes, which yields . The initial concentration of mobile oxygen vacancies in the manganese oxide (and on the boundary ) is fixed to be constant, (not very large, which ensures that we do not exceed the range of experimental values).
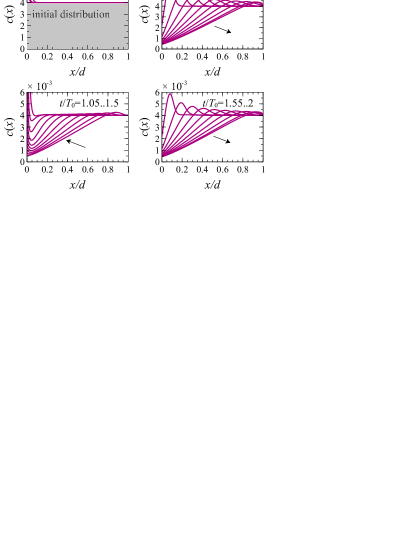
Spatial distribution of the oxygen-vacancy concentration is sampled with equal time step of in Fig. 1. Initially at (top-left panel) the concentration profile is a constant, the even half-periods (right panels) show the development of a shock-wave profile forming at times . Notice that at times (left panels), vacancies pile up at the metal/LCMO interface. The vertical range in the left graphs is reduced to show the formation of the shock-wave front at times 0.5;1.5, otherwise the concentration at can be as high as .
The interface (where most changes occur) is nontransparent for oxygen vacancies with zero-flux boundary conditions (6). So, the positively charged oxygen vacancies drift to that interface and accumulate at the metal/LCMO interface (left panels in Fig. 1). After changing the polarity of the electrical signal, the oxygen vacancies travel back from the surface into the bulk of the manganese oxide, and the solution of the equation (5) transforms into some form of a steep shock wave (right panels in Fig. 1), and the final traveling wave profile at .
Now let us discuss the relationship between the oxygen-vacancy distribution and the corresponding changes in the resistance.
The total resistance for a film between and can be computed as
| (7) |
where the local resistivity , which is a function of the local vacancy concentration or local mobile vacancy concentration , is given by the Eq. (3). According to the experimental data Malavasi et al. (2004) the constant for the sample with is .
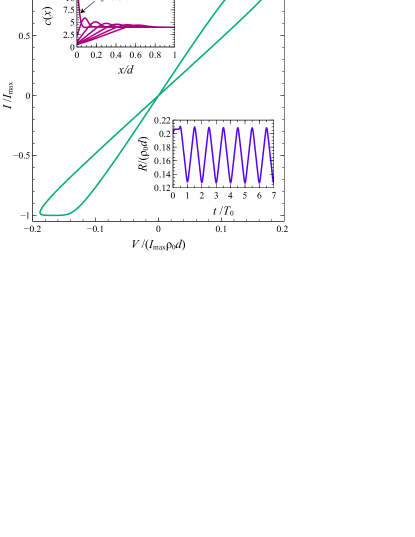
The current-voltage (-) characteristics, shown in Fig. 2, represent the sharp switching between the high-resistance state and the low-resistance state. The top inset of Fig. 2 shows the shock-wave formation of the oxygen-vacancy concentration at . The bottom inset depicts the corresponding time evolution of the resistance calculated using Eq.(7). After the first forming cycle the total resistance of the heterostructure changes periodically. In our numerical calculations, these reversible changes between the two resistive states occur up to fifty times (which is not shown in Fig. 2) that proves the stability of switching. Initially, the resistivity of the junction is high due to the presence of some amount of oxygen vacancies in the equilibrium doped manganese oxide. It is then somewhat increased in the forming process. As the oxygen vacancies leave the interface, the resistance decreases. We can also see that the rise in oxygen deficiency at the interface brings the system into a high resistive state.
Thus, the oxygen-vacancy species moving forwards and backwards can produce the sharp increase or decrease in the resistance, but also the way the oxygen-vacancy concentration profile is changing tells us about the formation of the shock wave within the nanoscale layer at the nontransparent metal/LCMO interface. The moment , when the concentration wave changes its profile, directly corresponds to the sudden switching of the resistance of the sample, and it can be seen clearly how each time the resistivity and the oxygen-vacancy distribution change together.
Obviously, a sudden switching of the resistance is an unavoidable feature of Eq. (5), mediated by the shock-wave profile of the vacancy concentration. But the relevant feature is that, as shown in Fig. 2, the system demonstrates reproducible switching between the two resistive states after only a few electrical cycles. It is the effect of the nonlinear term entirely.
To obtain a linear function from the dataMalavasi et al. (2004) we fit the dependence of the local resistivity on the oxygen-vacancy contentMalavasi et al. (2004) by
| (8) |
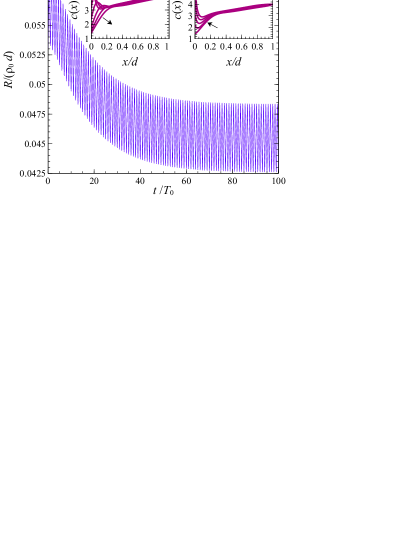
Using this function in Eq. (4) results in the concentration profiles, shown in the inset to Fig. 3. As can be seen, abrupt jumps in the vacancy content also occur at the interface. Meanwhile, in the bulk of LCMO, the concentration remains nearly constant, which implies a much smaller switching of the total resistance.
We can see in Fig. 3 that the sudden changes between the high-resistance state and the low-resistance state is observed. However, there are significant changes in both the local concentration and the contact resistance behavior in the sample. It looks like an excellent switching – very reversible and stable, but the stability of the contact resistance in high and low resistance states is only achieved after about 80 time periods.
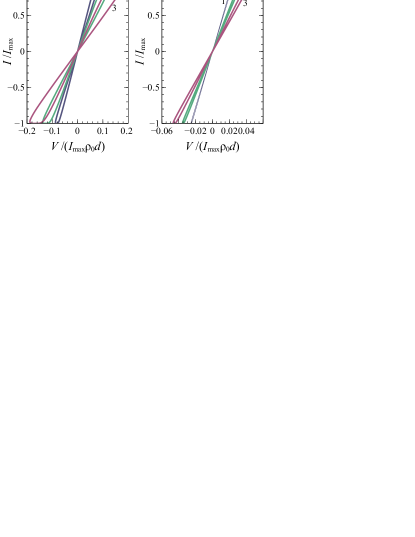
In Figs. 4 and 5 we plot the hysteresis loops corresponding to three different values of the initial concentration . These hysteresis loops are sensitive to the initial conditions both in the case of linear (right) and nonlinear (left) dependence : the larger is the mobile-vacancy content, the more significant is the switching effect.
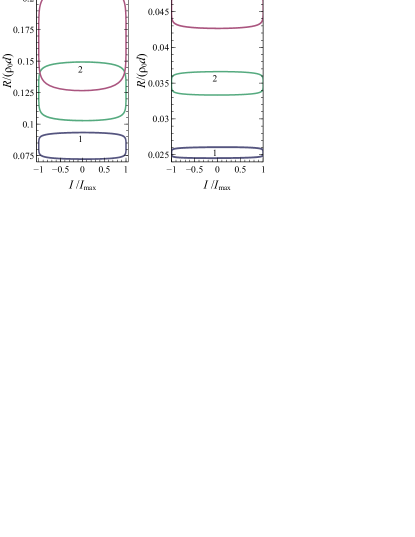
The electrical resistance-versus-electrical current () hysteresis loops for LCMO-based heterostructures are shown in Fig. 4. Even if the initial concentration of mobile oxygen vacancies is small, reproducible hysteresis windows are clearly visible. Each curve in Fig. 4 actually consists of five loops, which illustrates high reversibility of the switching. When is linear, the - characteristics show a little window. In the case of nonlinear , the shape of dependence does not change, but the difference between high and low resistance is significantly larger.
In the two cases described above the current-voltage (-) characteristics also display hysteresis (see Fig. 5). Even if the relationship between the local resistivity and the vacancy content is linear some hysteresis occurs. If nonlinear term exists in the function , the stable hysteresis takes place.
IV Conclusions
The first question for electronic applications of the resistive switching phenomena in complex oxide-based devices is how to stabilize the switching process by getting a good endurance of switching cycles. To make switching behavior reliable, experiments have to be designed by fine tuning the set of constants - the film thickness , the diffusion coefficient of the medium, the period of the electrical signal as well, which should correspond to specific parameter . If the relationship between the local oxygen-vacancy concentration and the local resistivity is linear, we have to wait a long time for switchings become reversible (in the case of interest - about 80 cycles of the electrical signal). The main finding here is that effect of nonlinear dependence on hysteresis is such that switchings become reversible after few cycles of the electrical signal. Furthermore, nonlinear behavior of the local resistivity leads to the larger hysteresis windows than in the case of linear dependence.
Another result is that the sudden switching of the contact resistance is accompanied by the development of the shock-wave profile that have a common time . The shock-wave formation at the metal/LCMO interface has been captured in the numerical solutions. For this reason, we can conclude that the resistance switching effect in manganese oxides is correlated simultaneously with the shock wave formation and propagation, produced by the flow of oxygen vacancies from the nontransparent interface into the bulk of LCMO. On the contrary, in the case of linear fit , the traveling concentration wave does not propagate across the whole bulk and the hysteresis loses its endurance. This suggests that the design of the nonlinear dependence of the resistivity on the vacancy concentration is necessary to obtain strong and reliable resistance switching.
References
- Tang et al. (2016) S. Tang, F. Tesler, F. G. Marlasca, P. Levy, V. Dobrosavljević, and M. Rozenberg, Phys. Rev. X 6, 011028 (2016).
- Hickmott (1962) T. W. Hickmott, Journal of Applied Physics 33, 2669–2682 (1962).
- Nielsen and Bashara (1964) P. H. Nielsen and N. M. Bashara, IEEE Transactions on Electron Devices 11, 243 (1964).
- Gibbons and Beadle (1964) J. F. Gibbons and W. Beadle, Solid-State Electronics 7, 785–790 (1964).
- Strukov et al. (2008) D. B. Strukov, G. S. Snider, D. R. Stewart, and R. S. Williams, nature 453, 80–83 (2008).
- Waser Rainer and Aono Masakazu (2007) Waser Rainer and Aono Masakazu, Nat Mater 6, 833–840 (2007), 10.1038/nmat2023.
- Sawa (2008) A. Sawa, Materials Today 11, 28–36 (2008).
- Lee et al. (2015) J. S. Lee, S. Lee, and T. W. Noh, Applied Physics Reviews 23, 031303 (2015).
- Rozenberg et al. (2010) M. J. Rozenberg, M. J. Sánchez, R. Weht, C. Acha, F. Gomez-Marlasca, and P. Levy, Phys. Rev. B 81, 115101 (2010).
- Bryant B. et al. (2011) Bryant B., Renner Ch., Tokunaga Y., Tokura Y., and Aeppli G., Nat Commun 2, 212 (2011), 10.1038/ncomms1219.
- Nian et al. (2007) Y. B. Nian, J. Strozier, N. J. Wu, X. Chen, and A. Ignatiev, Phys. Rev. Lett. 98, 146403 (2007).
- Plecenik et al. (2012) T. Plecenik, M. Tomasek, M. Belogolovskii, M. Truchly, M. Gregor, J. Noskovic, M. Zahoran, T. Roch, I. Boylo, M. Spankova, S. Chromik, P. Kus, and A. Plecenik, J. Appl. Phys. 111, 056106 (2012), arXiv:1204.2598v1 [cond-mat.mes-hall] .
- Wang et al. (2012) Z.-H. Wang, Y. Yang, L. Gu, H.-U. Habermeier, R.-C. Yu, T.-Y. Zhao, J.-R. Sun, and B.-G. Shen, Nanotechnology 23, 265202 (2012).
- Shang et al. (2006) D. S. Shang, L. D. Chen, Q. Wang, W. Q. Zhang, Z. H. Wu, and X. M. Li, Appl. Phys. Lett. 89, 172102 (2006).
- Dong et al. (2007) R. Dong, W. F. Xiang, D. S. Lee, S. J. Oh, D. J. Seong, S. H. Heo, H. J. Choi, M. J. Kwon, M. Chang, M. Jo, M. Hasan, and H. Hwang, Appl. Phys. Lett. 90, 182118 (2007).
- Yang et al. (2010) R. Yang, X. M. Li, W. D. Yu, X. D. Gao, D. S. Shang, and L. D. Chen, J.of Appl. Phys. 107, 063703 (2010).
- Rubio-Zuazo et al. (2014) J. Rubio-Zuazo, L. Onandia, P. Ferrer, and G. R. Castro, Appl. Phys. Lett. 104, 021604 (2014).
- Lu et al. (2000) C. J. Lu, Z. L. Wang, C. Kwon, and Q. X. Jia, J. Appl. Phys. 88, 4032–4043 (2000).
- Ghenzi et al. (2010) N. Ghenzi, M. J. Sánchez, F. Gomez-Marlasca, P. Levy, and M. J. Rozenberg, J. Appl. Phys. 107, 093719 (2010).
- Malavasi et al. (2004) L. Malavasi, M. C. Mozzati, P. Ghigna, G. Chiodelli, C. B. Azzoni, and G. Flor, “Role of Point Defects on the Properties of Manganites,” (2004), arXiv:cond-mat/0412606 .
- Baskar (2008) D. Baskar, High Temperature magnetic properties of transition metal oxides with perovskite structure, Ph.D. thesis (2008).
- Zhao-Liang and Dong-Min (2013) L. Zhao-Liang and C. Dong-Min, Chin. Phys. Lett. 30, 047701 (2013).
- Warnick et al. (2011) K. H. Warnick, Y. Puzyrev, T. Roy, D. M. Fleetwood, R. D. Schrimpf, and S. T. Pantelides, Phys. Rev. B 84, 214109 (2011).
- Liu et al. (2010) X. J. Liu, X. M. Li, Q. Wang, R. Yang, X. Cao, W. D. Yu, and L. D. Chen, Physica Status Solidi Applied Research 207, 1204–1209 (2010).