ProQ3D: Improved model quality assessments using Deep Learning.
Abstract
Summary: Protein quality assessment is a
long-standing problem in bioinformatics. For more than a decade we have
developed state-of-art predictors by carefully selecting and
optimising inputs to a machine learning method. The
correlation has increased from 0.60 in ProQ to 0.81 in ProQ2
and 0.85 in ProQ3 mainly by adding a large set of carefully tuned
descriptions of a protein. Here, we show that a substantial improvement can
be obtained using exactly the same inputs as in ProQ2 or ProQ3 but
replacing the support vector machine by a deep neural network. This
improves the Pearson correlation to 0.90 (0.85 using ProQ2
input features).
Availability: ProQ3D is freely available both as a
webserver
and a stand-alone program at http://proq3.bioinfo.se/
Contact: arne@bioinfo.se
Supplementary information: Supplementary data are available
at arXiv online.
1 Introduction
In 2003 we developed the first real model quality estimation program ProQ (Wallner and Elofsson,, 2003). In contrast to earlier methods, such as Park and Levitt, (1996), ProQ is not trained to recognise the native structure but to estimate the quality of a model. ProQ uses a machine learning approach and many features describing a protein model. In ProQ the quality is calculated for the entire model but in 2005 we extended it to estimate the quality of each residue (Wallner and Elofsson,, 2006). The quality of the entire model was then estimated by summing up the predicted qualities for each residue. In ProQ2 profile weights were added to improve the predictions (Ray et al.,, 2012) and in ProQ3 (Uziela et al.,, 2016) we added energy terms calculated from Rosetta (Leaver-Fay et al.,, 2011). The ProQ methods have since their introduction been the best single-model based quality assessors in CASP (Kryshtafovych et al.,, 2016).
ProQ, ProQ2 and ProQ3 use a large number of carefully tuned inputs that are calculated from each protein model. All parameters are optimised to be independent of protein size and to have a limited range. These parameters are then used to train a support vector machine using a linear kernel (ProQ used a neural network). More advanced kernels are computationally expensive and do not produce any significant improvements. This means that ProQ2 and ProQ3 basically are linear combinations of a large set of features that all independently show a weak correlation with model quality. When these features are combined a much better correlation is achieved. However, the ProQ2 and ProQ3 methods can not identify relationships where the different features provide opposite results, i.e. it can not identify more complicated, non-linear, relationships between the features.
In the last few years machine learning using so called deep neural networks has proven to be clearly superior to other machine learning methods. These networks are able to identify non-linear relationships between input features. We find that using identical inputs as in ProQ2 and ProQ3 but replacing the support vector machine with a deep neural network a substantial improvement can be obtained for both ProQ2 and ProQ3. The improvement is of a similar magnitude as obtained by the years of optimisation that was used to optimize the input features for ProQ3, and the gap to the consensus based assessor, Pcons (Lundstrom et al.,, 2001) has never been this small (CC=0.90 vs 0.95).
2 Methods
As in ProQ2 and ProQ3 a large number of features are calculated describing a model and then used to predict the quality, as measured by the S-score (Ray et al.,, 2012), for a single residue. Training was done using all models from CASP9 and CASP10, this is substantially more than we could use when training ProQ3. Testing was done on all models from CASP11 excluding cancelled targets and targets shorter than 50 residues. The Pearson correlation for local and global quality was used to evaluate the performance.
The learning was performed using the Keras Python library with the Theano backend. We used two dense hidden layers with 200 and 600 neurons respectively. Increasing the number of layers and neurons did not improve the results. The final model was trained with Adadelta and penalty for the regularization and shuffling the training data, for details see supporting information.
3 Results and Discussion
| CC-glob | CC-target | CC-loc | CC-model | GDT_loss | |
| ProQ | 0.60 | 0.44 | 0.50 | 0.39 | 0.06 |
| Qprob | 0.71 | 0.56 | - | - | 0.07 |
| Qmean | 0.73 | 0.57 | 0.57 | 0.42 | 0.08 |
| ProQ2 | 0.81 | 0.65 | 0.69 | 0.47 | 0.06 |
| ProQ3 | 0.85 | 0.65 | 0.73 | 0.51 | 0.06 |
| ProQ2D | 0.85 | 0.68 | 0.72 | 0.49 | 0.05 |
| ProQ3D | 0.90 | 0.71 | 0.77 | 0.54 | 0.06 |
| Consensus based methods | |||||
| Pcons | 0.95 | 0.77 | 0.87 | 0.68 | 0.07 |
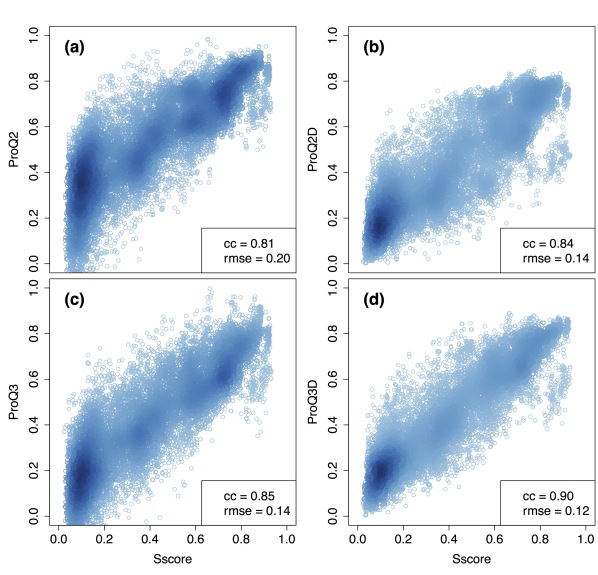
To estimate the global quality of a protein model with ProQ the predicted qualities for each residue are summed and the sum is divided by the protein sequence length. The correlation of overall (global) quality is substantially improved using either ProQ2 or ProQ3 inputs both when we calculate the correlation for all models together (CC-glob) or when the per target correlations are studied (CC-target), Table 1 and Figure 1. In addition, protein model quality assessment can be used to identify good and bad regions of a model, i.e. the local quality. Here we obtain a similar improvement as achieved for the global quality estimation independently if it is measured for all residues (CC-loc) or per model (CC-model) Table 1.
Finally, we examined if better top-ranked models could be selected using the new quality estimators. We calculated the average GDT loss of the first ranked models for each method. Unfortunately, the selection of top ranked models does not show any significant improvement between any of the top QA methods. However, the same is observed when using Pcons, although the correlation is probably quite close to the theoretical limit, as it is higher than the correlation between different methods used to evaluate the quality of a model Wallner and Elofsson, (2007). This indicates that to advance further it will be necessary to use a different approach.
Funding
This work was supported by grants from the Swedish Research Council (VR-NT 2012-5046 to AE and 2012-5270 to BW) and Swedish e-Science Research Center (BW). Computational resources were provided by the Swedish National Infrastructure for Computing (SNIC) at NSC.
References
- Kryshtafovych et al., (2016) Kryshtafovych, A., Barbato, A., Monastyrskyy, B., Fidelis, K., Schwede, T., and Tramontano, A., 2016. Methods of model accuracy estimation can help selecting the best models from decoy sets: Assessment of model accuracy estimations in CASP11. Proteins, 84 Suppl 1:349–369.
- Leaver-Fay et al., (2011) Leaver-Fay, A., Tyka, M., Lewis, S., Lange, O., Thompson, J., Jacak, R., Kaufman, K., Renfrew, P., Smith, C., Sheffler, W., et al., 2011. ROSETTA3: an object-oriented software suite for the simulation and design of macromolecules. Methods Enzymol, 487:545–574.
- Lundstrom et al., (2001) Lundstrom, J., Rychlewski, L., Bujnicki, J., and Elofsson, A., 2001. Pcons: a neural-network-based consensus predictor that improves fold recognition. Protein Sci, 10(11):2354–2362.
- Park and Levitt, (1996) Park, B. and Levitt, M., 1996. Energy functions that discriminate x-ray and near native folds from well-constructed decoys. J Mol Biol, 258(2):367–392.
- Ray et al., (2012) Ray, A., Lindahl, E., and Wallner, B., 2012. Improved model quality assessment using proq2. BMC Bioinformatics, 13:224.
- Uziela et al., (2016) Uziela, K., Shu, N., Wallner, B., and Elofsson, A., 2016. Proq3: Improved model quality assessments using rosetta energy terms. Sci Rep, 6:33509.
- Wallner and Elofsson, (2003) Wallner, B. and Elofsson, A., 2003. Can correct protein models be identified? Protein Sci, 12(5):1073–1086.
- Wallner and Elofsson, (2006) Wallner, B. and Elofsson, A., 2006. Identification of correct regions in protein models using structural, alignment, and consensus information. Protein Sci, 15(4):900–913.
- Wallner and Elofsson, (2007) Wallner, B. and Elofsson, A., 2007. Prediction of global and local model quality in CASP7 using pcons and proq. Proteins, 69 Suppl 8:184–193.