Fermi Surface of Metallic V2O3 from Angle-Resolved Photoemission:
Mid-level Filling of Bands
Abstract
Using angle resolved photoemission spectroscopy (ARPES) we report the first band dispersions and distinct features of the bulk Fermi surface (FS) in the paramagnetic metallic phase of the prototypical metal-insulator transition material V2O3. Along the -axis we observe both an electron pocket and a triangular hole-like FS topology, showing that both V 3 and states contribute to the FS. These results challenge the existing correlation-enhanced crystal field splitting theoretical explanation for the transition mechanism and pave the way for the solution of this mystery.
pacs:
79.60.-i,71.27.+a,71.30.+hSince its seminal report in 1969 mcwhan-69 ; mcwhan-70 ; mcwhan-73 , the metal-insulator transition (MIT) in the alloy system (V1-xCrx)2O3 has stood as a mystery for many decades. For =0 and with decreasing temperature () there is a transition from a paramagnetic metal (PM) to an antiferromagnetic insulator (AFI). With increasing the AFI phase persists but the PM phase gives way to a paramagnetic insulator (PI) along an () line terminating at higher in a critical point. The initial identification of the latter transition as the long sought experimental example of the Mott MIT mott-68 inherent in the one-band Hubbard model was quickly challenged goodenough-71 on the grounds that the complexity of the actual multi-orbital electronic structure must be essential for the transition. This complexity consists of four V3+ ions per rhombohedral unit cell with each ion having two 3 electrons to distribute in the two lowest energy trigonal crystal field split 3 states, an orbital singlet and an orbital doublet . Scenarios for reducing this complexity back to a one-band model castellani-78 were eventually abandoned after X-ray absorption spectroscopy (XAS) showed that the V3+ ions are in a Hund’s rule S=1 state and that both the and states are always occupied, albeit with different occupation ratios (=:) in the three phases park-00 .
The advent of dynamic mean field theory (DMFT) georges-96 combined held-07 with band structure from density functional theory (DFT), supported by bulk sensitive angle integrated photoemission spectra for (V1-xCrx)2O3 mo-03 ; mo-06 , gave the first real hope that the mystery could be solved within a realistic multi-orbital calculation. Indeed a series of DFT+ DMFT studies in the first decade of this century held-01 ; laad-03 ; poteryaev-07 gradually coalesced around a narrative in which the MIT is enabled by a strong many-body enhancement of the trigonal crystal field splitting and thus the orbital polarization of the quasi-particle (QP) bands based on the and states. In 2007 the claim in Ref. poteryaev-07 “to have demystified the nature of the metal-insulator transition in V2O3” seemed well justified by the consensus. The study suggested that in the PM phase the Fermi surface (FS) is formed entirely from an QP band, while all the QP bands lie entirely below the Fermi energy, , a scenario consistent with electron counting only by virtue of QP weights sufficiently reduced from 1 and the concomitant presence of the lower and upper Hubbard bands below and above , respectively QPweights . This strongly polarized and strongly correlated situation brings the PM phase to the very brink of the MIT and the opening of a complete - gap. Since then however, technical advances in DMFT aimed at achieving full charge self-consistency find much reduced orbital polarizations grieger-14 ; deng-14 ; leonov-15 , implying that what had seemed to be a finished narrative might actually be far from the true implication of DMFT for this problem.
All this detailed DMFT effort for V2O3 has been conducted without any guidance whatsoever from experimental -resolved information on the QP band structure, i.e. no angle resolved photoemission spectroscopy (ARPES). In this Letter we report the first such ARPES data for the PM phase. We find that both and contribute to the FS, with cutting roughly through the center of the manifold, i.e. a much weaker orbital polarization. Our results reveal the PM phase electronic structure and suggest that the correlation-enhanced crystal field splitting plays a less important role in driving the MIT than was previously thought. We find some agreement with recent fully charge self-consistent DFT+DMFT calculations, thus demonstrating that this could be the way to solve the V2O3 mystery.
Flat (0001) and (1000) surfaces of V2O3 suitable for ARPES measurements were prepared by annealing polished Laue-oriented single crystals to 750∘C in a 10-6 Torr oxygen partial pressure resulting in 11 surface order measured by low energy electron diffraction. Also, room temperature blade cleaving of millimeter sized (0001)-oriented single crystals revealed similar data as for polished single crystals, but with less reproducibility of spectral clarity due to spatial variations fujiwara-15 . The ARPES measurements were performed using the 2009 configuration of Beamline 7.0 of the Advanced Light Source utilizing photon energies from 80 eV to 900 eV and a beam spot-size of 5050 m. Data were acquired using a Scienta R4000 hemispherical electron analyzer with the sample placed in a vacuum better than 1 10-10 Torr. The transport MIT transition temperature for these samples is TMIT=165 K with a hysteresis of 10 K. Thus the measurements were taken at T=200 K in order to be fully in the PM phase lupi-10 .
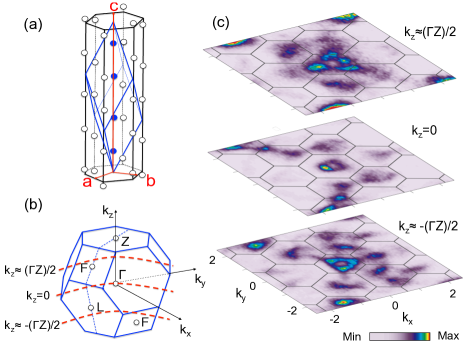
Fig. 1(a) shows the vanadium atom only crystal structure of V2O3 with two unit cell representations. The primitive rhombohedral unit cell contains two formula units (four solid blue circles along the -axis) while the non-primitive hexagonal unit cell contains six formula units and a -axis notation of (0001). Fig. 1(b) shows the corresponding reciprocal space rhombohedral Brillouin zone with high symmetry point labeling. Fig. 1(c) presents the first ARPES result of three constant energy maps (-) of the Fermi-edge intensity acquired for different values of perpendicular to the (0001) surface (accesed by varying the photon energy between 280 and 360 eV). The locations kz of the maps relative to the bulk BZ correspond to =9.456 Å-1 -plane, and half-way between and Z (=Z/2), as shown schematically with dashed arc lines in Fig. 1(b). In the -plane, a nearly six-fold intensity pattern is observed in the first and second BZs, whereas at =Z/2 an overall three-fold intensity pattern is evident with a strong intensity triangular-like contour in the first BZ. The directional pointing of the triangular FS intensity is observed to reverse in the maps above and below the -plane. This reversal is consistent with the symmetry of the bulk BZ and provides strong evidence for the bulk origin of these states.
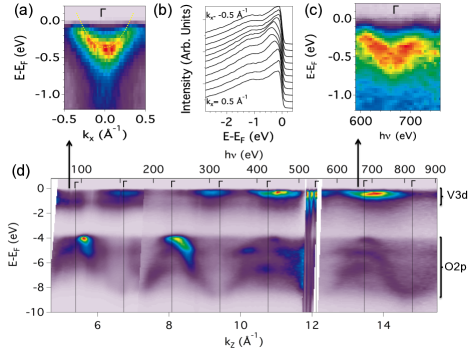
Fig. 2 shows the electronic structure for the (0001) and (1000) surfaces. Panel (d) shows the energy dispersion as a function of the out-of-plane momentum for normal emission with respect to the (0001) surface (i.e. along the axis), over multiple Brillouin zones, by varying the photon energy over a 800 eV wide energy range kz . The wide binding energy scale shows both the dispersions of the O 2p bands between 4 and 8 eV and the V 3d states below 1 eV. The points (Brillouin zone center) for each BZ are indicated by a vertical line. The photon dependence is interrupted between 510-560 eV due to strong variations from the V L- and oxygen K-absorption edges. Both the O 2p band dispersion and the V 3d states near show a spectral intensity variation with half unit-cell periodicity. These indicate that the half unit-cell is the primary -axis periodicity of the potential felt by oxygen orbitals. At more surface sensitive lower photon energies the O 2p band dispersion resembles a single 4 eV wide sinusoidal band whereas at higher photon energy the increasing bulk-sensitivity results in greater partitioning of the O 2p states into sub-bands grieger-14 .
Fig. 2(c) shows an expanded zoom of the V 3d dispersion around 670 eV, showing an electron pocket centered at . The reduced visibility of the vanadium states at lower photon energy may be related to the existence of a structural relaxed and/or vanadyl surface termination feiten-15 resulting in a non-metallic half-unit cell surface and a surface dead layerborghi-09 . Nevertheless, electron pockets can be observed at low photon energy -points for the orthogonal (1000) polished surface with the -axis in plane and the unit cell -vector perpendicular to the surface. We conjecture that no such insulating dead layer exists for this (1000) surface. Fig 2(a) shows the -point electron pocket for this surface measured at 88 eV which allows finer quantification of the electron dispersion to be 0.4 eV deep and 0.75 Å-1 wide. The Fig. 2(b) stack plot of spectra illustrates the relative amplitude of the dispersing component of electron pocket states at 88 eV relative to a broad non-dispersing component of the QP peak and relative to the incoherent band between 0.5 eV and 1.5 eV. The presence of a non-dispersive component in the metallic QP energy region is in part why ARPES of V2O3 has been such a challenging task. Also it produces the visual artifact of the dispersion peak (in color intensity images) not reaching the Fermi level, whereas the metallic dispersion to is confirmed by momentum distribution curves cuts of the data set(s).
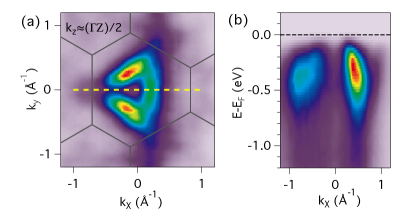
The Fermi contour at =Z/2 is shown in Fig. 3(a). Data are taken at a lower photon energy (h=180 eV) than that in Fig. 1. The overall contour resembles a triangular like shape with open tips, thus suggesting three arc-like features. A clear hole-like dispersion is visible in the energy distribution curve cut in Fig. 3(b) corresponding to the dashed line in panel (a). The Fermi velocity is 1.63 eV-Å. This FS feature is stable with small percentages of doping within the metallic phase, as indicated by data taken on (V0.988Cr0.012)2O3 and (V0.955Ti0.045)2O3 (not shown). The very existence of this triangular FS contour halfway between and Z strongly contradicts the DFT + DMFT calculation reported in [poteryaev-07, ] in which only a single zone-centered electron FS is remaining while the top of the states is pushed fully below . Moreover the predicted depth of the electron band at is shallower than the experimental ARPES value of 0.4 eV suppl .
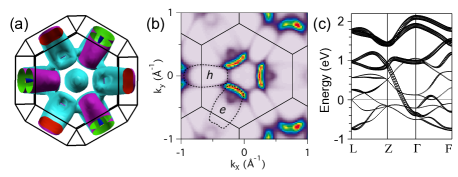
We have explored constant energy contours of various non-magnetic DFT+ calculations, under the assumption that the DMFT energy renormalization, quasiparticle weight reduction and spectral weight redistribution, absent in DFT, does not radically change the shape of the QP band dispersions. Fig. 4(a) and (b) show the 3D Fermi surface of a DFT+ (6.5 eV) calculation wien2k with constrained zero moment and a =0.4 Å-1 (0.6) “spectral” image cut of Lorentzian-broadened Fermi-energy contours. The calculation exhibits three-fold symmetric electron (e) and hole (h) sheets pointing upwards away from the center -Z axis towards the square and hexagonal zone-boundary faces, respectively. The spectral weight of the inner edges of the electron sheets, containing vertical edges along the -axis, are strongly enhanced with -broadening suppl relative to the highly -dispersing parts of the electron or hole sheets. These three-fold arcs give rise to the appearance of an open-tipped triangular Fermi surface that is very similar in size and shape to that of the ARPES measurement shown in Fig. 3(a). The increased value relative to that in earlier DMFT calculationspoteryaev-07 produced the best agreement with the experimental results and is generally consistent suppl with the values used in more recent DMFT calculations grieger-14 ; deng-14 ; leonov-15
The band dispersion for the DFT+ calculation is shown in Fig. 4(c). The lowest of 4 bands crosses approximately half-way along -Z and the other 3 bands are unoccupied. The zone-centered electron sheet corresponding to this partially occupied band is visible in the 3D Fermi surface in Fig. 4(a). The plot of band dispersions also clearly shows that then cuts in the middle of the bands. It is very encouraging that two more recent -resolved DFT + DMFT calculations grieger-14 ; deng-14 incorporating full charge self-consistency predict QP bands above and crossing corresponding to less than half-filling of the QP states suppl . Our experimental result supports this scenario and does not support the earlier filled QP band scenario poteryaev-07 in which the PM phase is at the threshold of the formation of an - insulator gap at .
The mid-filling of the QP states in the PM phase, as opposed to being at the brink of an - direct gap, challenges theory anew as to how the lattice constant or magnetic ordering perturbations of the PI and AFI phases are able to open an insulating gap. A possible answer may lie with new charge self consistent but non--resolved GGA + DMFT calculations that find the MIT to be driven by a strong orbital selective renormalization featuring the QP weight going to zero leonov-15 . A calculation of -resolved QP bands for comparison to our data would be required to more fully evaluate this line of study. Recent hard x-ray photoemission and absorption experiments have provided additional MIT model constraints on the variation of between the metal and insulating phases fujiwara-11 and on the different variation of the orbital occupancies for the pressure-induced PI phase rodolakis-10 as compared to the Cr-doping and temperature induced PI phases. Thus the mystery of the MIT lives on.
In conclusion we have reported experimental electron- and hole-like band dispersions in the metallic phase of V2O3 at specific -locations in the bulk Brillouin zone and with distinct Fermi surface topologies. We associate them with and roughly half filled QP bands, thus supporting the scenario of partially filled states, in disagreement with previously reported -resolved DMFT calculations that described the metallic phase at the brink of a MIT driven by correlation-enhanced crystal field splitting. These results are a major new spectroscopic contribution to the long sought goal of a final and complete understanding of the (V1-xCrx)2O3 MIT paradigm.
We gratefully acknowledge theoretical advice and stimulating discussions with Byung Il Min, Richard Martin and especially Frank Lechermann. This work was supported by the National Science Foundation grant number DMR-1410660. J. W. A. thanks the Advanced Light Source (ALS) for supporting a visit to the ALS during the time that this paper was written. Theory calculations used resources of the National Energy Research Scientific Computing Center (NERSC). Both the ALS and NERSC user facilities are supported by the Office of Science of the U.S. Department of Energy under Contract No. DE-AC02-05CH11231.
References
- (1) D. B. McWhan, T. M. Rice, and J. P. Remeika, Phys. Rev. Lett. 23, 1384 (1969).
- (2) D. B. McWhan and J. P. Remeika, Phys. Rev. B 2, 3734 (1970).
- (3) D. B. McWhan, A. Menth, J. P. Remeika, W. F. Brinkman, and T. M. Rice, Phys. Rev. B 7, 1920 (1973).
- (4) N. F. Mott, Rev. Mod. Phys. 40, 677 (1968).
- (5) J. B. Goodenough, Ann. Rev. Mater. Sci. 1, 101 (1971).
- (6) C. Castellani, C. R. Natoli, and J. Ranninger, Phys. Rev. B 18, 4945 (1978).
- (7) J.-H. Park, L. H. Tjeng, A. Tanaka, J. W. Allen, C. T. Chen, P. Metcalf, J. M. Honig, F. M. F. de Groot, and G. A. Sawatzky, Phys. Rev. B 61, 11506 (2000).
- (8) A. Georges, G. Kotliar, W. Krauth, and M. J. Rozenberg, Rev. Mod. Phys. 68, 13 (1996).
- (9) K. Held, Adv. Phys. 56, 829 (2007).
- (10) S.-K. Mo, J. D. Denlinger, H.-D. Kim, J.-H. Park, J. W. Allen, A. Sekiyama, A. Yamasaki, K. Kadono, S. Suga, Y. Saitoh, T. Muro, P. Metcalf, G. Keller, K. Held, V. Eyert, V. I. Anisimov, and D. Vollhardt, Phys. Rev. Lett. 90, 186403 (2003).
- (11) S.-K. Mo, H.-D. Kim, J. D. Denlinger, J. W. Allen, J.-H. Park, A. Sekiyama, A. Yamasaki, S. Suga, Y. Saitoh, T. Muro, and P. Metcalf, Phys. Rev. B 74, 165101 (2006).
- (12) K. Held, G. Keller, V. Eyert, D. Vollhardt, and V. I. Anisimov, Phys. Rev. Lett. 86, 5345 (2001).
- (13) M. S. Laad, L. Craco, and E. Müller-Hartmann, Phys. Rev. Lett. 91, 156402 (2003).
- (14) A. I. Poteryaev, J. M. Tomczak, S. Biermann, A. Georges, A. I. Lichtenstein, A. N. Rubtsov, T. Saha-Dasgupta, and O. K. Andersen, Phys. Rev. B 76, 085127 (2007).
- (15) As a rough illustration that considers only the states which account for very nearly all 8 of the electrons per unit cell, i.e. neglects the small fraction in the QP bands, it is consistent that the QP weight is 0.2 and that the division of the -integrated spectral weight below is roughly equal between the QP bands and the lower Hubbard band.
- (16) D. Grieger and F. Lechermann, Phys. Rev. B 90, 115115 (2014).
- (17) X. Deng, A. Sternbach, K. Haule, D. N. Basov, and G. Kotliar, Phys. Rev. Lett. 113, 246404 (2014).
- (18) I. Leonov, V. I. Anisimov, and D. Vollhardt, Phys. Rev. B 91, 195115 (2015).
- (19) H. Fujiwara, T. Kiss, Y. K. Wakabayashi, Y. Nishitani, T. Mori, Y. Nakata, S. Kitayama, K. Fukushima, S. Ikeda, H. Fuchimoto, Y. Minowa, S.-K. Mo, J. D. Denlinger, J. W. Allen, P. Metcalf, M. Imai, K. Yoshimura, S. Suga, T. Muro, and A. Sekiyama, J. Synchrotron Rad. 22, 776 (2015).
- (20) S. Lupi, L. Baldassarre, B. Mansart, A. Perucchi, A. Barinov, P. Dudin, E. Papalazarou, F. Rodolakis, J. -P. Rueff, J. -P. Itié, S. Ravy, D. Nicoletti, P. Postorino, P. Hansmann, N. Parragh, A. Toschi, T. Saha-Dasgupta, O. K. Andersen, G. Sangiovanni, K. Held, and M. Marsi, Nat. Commun. 1, 105 (2010).
- (21) At normal emission (=0) and lower photon energy in Å is related to the photon energy in eV by =0.512, where =4.5 eV is the work function of the analyzer and =14 eV is the so-called inner potential. At higher photon energy this basic relation has been modified to include quantitatively important effects of the photon momentum.
- (22) F. E. Feiten, J. Seifert, J. Paier, H. Kuhlenbeck, H. Winter, J. Sauer, and H.-J. Freund, Phys. Rev. Lett. 114, 216101 (2015).
- (23) G. Borghi, M. Fabrizio, and E. Tosatti, Phys. Rev. Lett. 102, 066806 (2009).
- (24) See Supplementary Materials, which includes additional Refs. keller-04 ; laad-06 ; hansmann-13 ; mattheiss-94 ; dasgupta-09 ; grieger-15 ; elfimov-03 ; tran-09 , for -resolved DMFT comparison and other details of all the various calculations, including band occupations and the effect of -broadening.
- (25) G. Keller, K. Held, V. Eyert, D. Vollhardt, and V. I. Anisimov Phys. Rev. B 70, 205116 (2004).
- (26) M. S. Laad, L. Craco, and E. Müller-Hartmann, Phys. Rev. B 73, 045109 (2006).
- (27) P. Hansmann, A. Toschi, G. Sangiovanni, T. Saha-Dasgupta, S. Lupi, M. Marsi, and K. Held, Phys. Satus Solidi B 250, 7 (2013).
- (28) L.F. Mattheiss, J. Phys.: Cond. Matter 6, 6477 (1994).
- (29) T. Saha-Dasgupta, O. K. Andersen, J. Nuss, A. I. Poteryaev, A. Georges, and A. I. Lichtenstein, arXiv:0907.2841 (2009).
- (30) D. Grieger and M. Fabrizio, Phys. Rev. B 92, 075121 (2015).
- (31) I. S. Elfimov, T. Saha-Dasgupta, and M. A. Korotin, Phys. Rev. B 68, 113105 (2003).
- (32) F. Tran and P. Blaha, Phys. Rev. Lett. 102, 226401 (2009).
- (33) P. Blaha, K. Schwarz, G. K. H. Madsen, D. Kvasnicka, and J. Luitz, WIEN2k, (Karlheinz Schwarz, Techn. Universitat Wien, Austria, 2001).
- (34) H. Fujiwara, A. Sekiyama, S.-K. Mo, J. W. Allen, J. Yamaguchi, G. Funabashi, S. Imada, P. Metcalf, A. Higashiya, M. Yabashi, K. Tamasaku, T. Ishikawa, and S. Suga, Phys. Rev. B 84, 075117 (2011).
- (35) F. Rodolakis, P. Hansmann, J.-P. Rueff, A. Toschi, M. W. Haverkort, G. Sangiovanni, A. Tanaka, T. Saha-Dasgupta, O. K. Andersen, K. Held, M. Sikora, I. Alliot, J.-P. Itié, F. Baudelet, P. Wzietek, P. Metcalf, and M. Marsi Phys. Rev. Lett 104, 047401 (2010).