Diogenes NunezTufts University, USAdan@cs.tufts.edu \authorinfoSamuel Z. GuyerTufts University, USAsguyer@cs.tufts.edu \authorinfoEmery D. BergerUniversity of Massachusetts Amherst, USAemery@cs.umass.edu
Prioritized Garbage Collection:
Explicit GC Support for Software Caches
Abstract
Programmers routinely trade space for time to increase performance, often in the form of caching or memoization. In managed languages like Java or JavaScript, however, this space-time tradeoff is complex. Using more space translates into higher garbage collection costs, especially at the limit of available memory. Existing runtime systems provide limited support for space-sensitive algorithms, forcing programmers into difficult and often brittle choices about provisioning.
This paper presents prioritized garbage collection, a cooperative programming language and runtime solution to this problem. Prioritized GC provides an interface similar to soft references, called priority references, which identify objects that the collector can reclaim eagerly if necessary. The key difference is an API for defining the policy that governs when priority references are cleared and in what order. Application code specifies a priority value for each reference and a target memory bound. The collector reclaims references, lowest priority first, until the total memory footprint of the cache fits within the bound. We use this API to implement a space-aware least-recently-used (LRU) cache, called a Sache, that is a drop-in replacement for existing caches, such as Google’s Guava library. The garbage collector automatically grows and shrinks the Sache in response to available memory and workload with minimal provisioning information from the programmer. Using a Sache, it is almost impossible for an application to experience a memory leak, memory pressure, or an out-of-memory crash caused by software caching.
category:
D.3.4 Programming Langauges Processorskeywords:
Memory management and garbage collectionkeywords:
garbage collection, soft references, software caching1 Introduction
Software caching and garbage collection (GC) do not play well together. The problem is that they embody conflicting goals and tradeoffs. Caching aims to achieve the highest hit rate given a particular storage budget: the larger the cache, the higher the hit rate. Unfortunately, most widely-used garbage collection algorithms have a cost proportional to live memory 1094836 . In this setting, the benefits of a larger cache are less clear because improvements in hit rate are offset, to some degree, by additional GC costs. The penalty can become particularly high if the cache starts competing with the rest of the program for resources, increasing memory pressure and GC overhead.
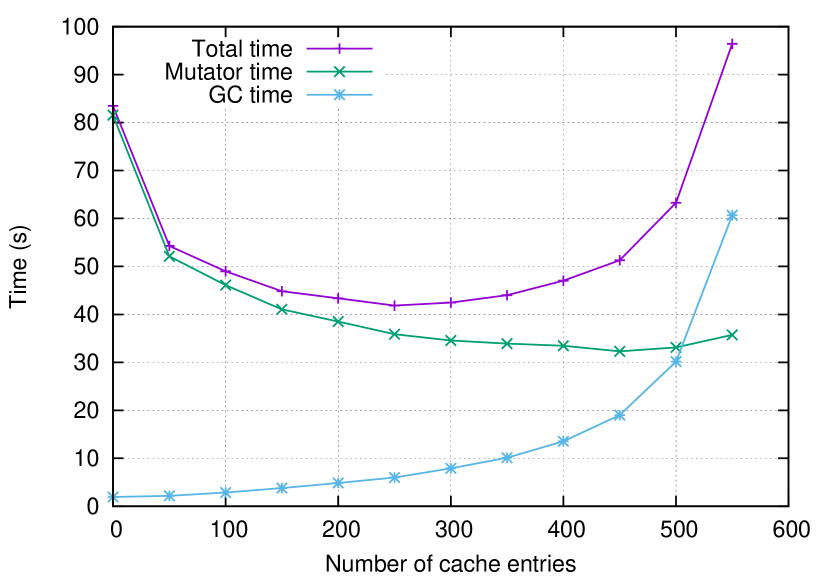
Figure 1 shows how the performance of a cache changes as we vary the number of entries while keeping the overall heap size fixed. This benchmark uses Google’s Guava caching library configured with a least-recently-used (LRU) eviction policy. We measured the time it takes (Y-axis) to serve a predefined sequence of requests under each cache configuration (X-axis). Looking from left to right, the two opposing trends are clearly visible. Larger caches have higher hit rates, incurring fewer misses and lowering mutator time. At the same time, though, larger caches increase GC time. At the far right, the cache occupies almost all of available memory, increasing not only the per-GC cost, but also the frequency of collection, causing GC time to dominate total time. At the limit, the program runs out of memory and crashes. Unbounded growth of caches (and related structures, such as indexes) is a primary cause of memory leaks and performance problems in Java mitchell03leakbot ; xu11leakchaser .
The scenario above is a simple and controlled experiment – real applications have much more complex behavior, including multiple caches, possibly with different eviction policies, different memory footprints, and different patterns of locality, as well as significant non-cache data structures. Getting the most out the available memory resources without triggering memory pressure poses a significant challenge.
Existing runtime systems provide some mechanisms to support memory-sensitive data structures, but they are sorely lacking in ways to configure and control the policies that govern these mechanisms. As an example, the Java runtime provides soft references, which the garbage collector can clear at its discretion to avoid running out of memory. A common programming strategy is to store each cache entry in a soft reference, allowing the collector to reclaim individual entries if necessary. The application, however, has little or no control over when this process is triggered, or over which soft references are cleared and in what order. Some Java Virtual Machines (JVMs), such as HotSpot, use LRU-like policies that are clearly designed for caches, but are too coarse for complex applications where a single global policy is not appropriate. In Section 2 we describe this problem in more detail, and in Section 4 we show its effect on hit rate.
Not surprisingly, soft references are widely shunned. In fact, the official documentation for the Android runtime library explicitly warns against using them for caches androidsoftrefs : “In practice, soft references are inefficient for caching. The runtime doesn’t have enough information on which references to clear and which to keep. Most fatally, it doesn’t know what to do when given the choice between clearing a soft reference and growing the heap. The lack of information on the value to your application of each reference limits the usefulness of soft references. References that are cleared too early cause unnecessary work; those that are cleared too late waste memory.” In Section 2 we present detailed empirical measurements showing that these are real problems.
This paper presents prioritized garbage collection, an automatic memory management system designed to address the deficiencies outlined above by providing explicit support for software caches and other space-sensitive data structures. The key idea is to enable better cooperation between the application and the garbage collector. In our system, the collector provides the mechanisms for measuring and enforcing memory usage, while the application dictates the policies that drive these mechanisms. The application and the collector cooperate through a simple API that is designed around a new kind of reference object we call a PrioReference (short for “priority reference”). It resembles a soft reference, except that the application can specify both the global policy (when to trigger eviction and how much memory to reclaim) and the local policy (which priority references to clear and in what order). Our paper makes the following contributions:
-
1.
We quantify the performance problems of existing cache implementations by driving them with a range of workloads across a range of sizes. Not surprisingly, choosing a fixed cache size, particularly in terms of number of entries, is brittle. We also demonstrate the limitations of soft references as a mechanism for implementing these data structures.
-
2.
We present a new reference type called PrioReference that allows application code to communicate the relative value of not reclaiming its referent object (and transitively, reachable objects). PrioReferences are grouped into PrioSpaces, which specify the details of the total memory limit and eviction policy for each group. A common configuration is one PrioSpace for each cache, but the mapping is up to the application to decide.
-
3.
We describe the design and implementation of a garbage collector that enforces these policies. The key mechanism is a modified closure phase that visits PrioReferences in order from highest to lowest priority, stopping when the target space bound is reached. Unmarked references are implicitly evicted, and are reclaimed immediately by the sweeper without touching them.
-
4.
We present a space-sensitive cache, which we call a Sache, built on our new API. The Sache supports LRU and GreedyDual cao97 eviction policies by changing the way it computes the reference priorities. Our system allows the user to set the target memory footprint in terms of available memory, so the Sache expands and contracts automatically to avoid memory pressure.
-
5.
We report performance results obtained by driving a key-value store with a range of workloads. We use representative workloads to systematically explore the performance space and quantify the problems. We compare our cache to Google’s Guava caching library on web traffic traces.
The remainder of this paper is organized as follows. Section 2 describes the problem in more detail and explores the space of interactions between caches and garbage collection. Section 3 describes the design and implementation of our garbage collector mechanisms and the Sache data structure. Section 4 presents Sache performance results and compares them to traditional caches. Finally, Sections 5 and 6 review related work and conclude.
2 Problem
It is not easy to implement software caching in a garbage collected language. One reason is that cache performance is governed by a space-time tradeoff that is in direct opposition to the tradeoff in garbage collection. Another reason is that garbage collected languages provide poor support for implementing any algorithm or data structure that is inherently space sensitive. In this section, we discuss these issues in detail, and present measurements that illustrate the problem.
The results below are obtained using JikesRVM version 3.1.2 JikesRVMWeb . While our benchmarks can run on any JVM, we use JikesRVM for these experiments both because it can report many detailed measurements, and because it allows direct comparison with our new algorithm, which we implemented in JikesRVM. Section 4 contains a detailed description of the experimental setup and methodology.
2.1 Existing cache implementations
Google’s Guava library is a widely-used infrastructure for implementing software caches. It implements a simple get/put interface for keys and values, and offers a variety of eviction policies to manage the capacity of the cache. Even with this library, however, there are several significant challenges to obtaining good cache performance:
Choosing a cache size is difficult. The most straightforward eviction trigger is capacity-based: the programmer chooses the maximum number of entries (key-value pairs) that the cache will hold. When the cache grows beyond this limit, it evicts entries in least-recently-used order.
The challenge of this policy is how to choose a good size: too small and the cache will underperform; too large and the program will slow significantly or crash due to memory pressure. In many cases, the cached values vary widely in size, so the same set of entries could account for wildly varying quantities of data.
One potential solution is to measure representative workloads during testing and configure the cache accordingly (e.g., by assuming an average size key and value). Unfortunately, this approach is brittle: unless the workload is extremely uniform and predictable, the number of entries is not a reliable predictor of the memory footprint of the cache. If actual workloads in deployment differ substantially, then performance will suffer.
There is no easy way to measure memory footprint. To handle these cases, Guava can manage cache capacity in terms of an application-specific “weight”. The programmer implements a weigh() method that can compute a weight value for any entry. The weight method could, for example, count the number elements in a container. Entries are evicted in LRU order to keep the total weight under the limit. Example code is shown in Figure 2.
Implementing an accurate weighing method, however, is not always easy. Ideally, we would like to know the exact size (in bytes) of each cached value. In the case of simple structures, such as strings, an accurate size is easy to compute. Measuring the size of complex data structures is more difficult. One problem is encapsulation: it might not be possible to access the hidden implementation of a class. Another problem is structure sharing: when measured independently, the shared substructures could be counted multiple times, distorting the total weight.
One alternative is to explicitly measure the size of a data structure at runtime using reflection. This is the approach taken by JAMM, which is based on the JVM Tool Interface jamm . While accurate, its cost is so high that it is not practical for use in production settings. For example, measuring a data structure with 1 million objects can take 5 seconds of wall clock time, and causes the benchmark to run over 100 slower than the approach we propose here.
Eviction doesn’t work. The purpose of eviction is to control cache memory use by freeing low-value entries. In a garbage collected language, however, eviction does not achieve this goal. The cache can remove entries and null out all references to them, but the memory is not actually reclaimed until a garbage collection occurs. Guava attempts to address this problem by performing eviction lazily, but we have observed cases where eviction actually makes memory pressure worse. If the cache misses on a recently-evicted entry, then it will create a new one, resulting in two copies in memory at the same time. A secondary effect, which we show at the end of this section, is an increase in the allocation rate. One of our observations is that it only makes sense to do eviction at collection time, when memory is actually reclaimed.
Soft references don’t do the right thing. Recognizing that caches can be a source of memory pressure, Guava also offers the option of storing entries in soft references. The Guava documentation claims that soft references are reclaimed in LRU order when memory is tight. While this policy is not required by the Java standard, we found that Oracle’s HotSpot JVM does implement such a strategy oraclesoftrefs . It has two serious limitations, however: first, the policy is hard-wired to LRU, and second, the LRU ordering is global for all soft references. Large Java programs, such as web applications, can have multiple caches, and the global LRU order is particularly problematic if these caches are accessed with different frequencies. Entries in a less-frequently used cache all wind up at the end of the LRU queue, resulting in the entire cache being dumped. Figure 11(a) illustrated this effect: the bigger the differences between the caches, the worse the impact of the soft reference policy.
2.2 Exploring cache-GC interaction
To study these problems in detail, we implemented a simple key-value store in Java that we can drive with a range of workloads and under a range of conditions. Our goal is to isolate cache performance and its interaction with the garbage collector. In the context of a larger application, these effects might be hard to separate from unrelated program behavior.
Trace files. The input to the driver is a trace file that specifies the workload as a sequence of key-value requests. The keys are just names, but the values represent data structures of varying sizes. The goal is to model caching of data that has a non-trivial structure (as opposed to strings, for example). Real-world examples might include a parsed XML document in tree form, or memoized computations in an optimizing compiler. The trace file itself just specifies the size of each tree in number of nodes. Figure 3 shows an example fragment of a trace file.
We generate each trace file according to a set of parameters: (1) number of unique keys, (2) minimum and maximum sizes of the values, (3) the distribution of value sizes, (4) the number of key requests (trace length), and (5) the temporal distribution of keys in the trace.
The set of unique key/value pairs is generated by choosing value sizes at random from a Pareto distribution. Many kinds of workloads, including web requests and file accesses, have been found to follow this kind of power law distribution atikoglu2012 ; cunha95 ; newman05 . The sequence of key requests is also drawn from a Pareto distribution, which governs the temporal locality of the trace. Here, higher alpha values create more locality, and lower values spread out the distribution more evenly. We use an alpha value of 0.1, which is on the low end and requires caches to be larger to achieve a high hit rate. The traces range in length from 10,000 to 50,000 key requests, with 2000 to 5000 unique keys.
key_8 179074 key_12 180434 key_1 150999 key_188 126021 key_2 154588 key_28 119220 ...
Execution. Our driver initializes the cache, reads the trace and sends the cache a sequence of get and put operations. Its behavior is configured using several parameters: (1) size of the cache (number of entries for Guava), (2) the max heap size, and (3) the cost of a miss. The miss cost models the time to fetch data from a remote source or recompute it, which is proportional to the size of the resulting data. In these experiments the miss cost only represents the time it would take to transmit the data over a 10MB/s network connection. Higher miss costs (for example, modeling a more expensive computation or a database query) would only exaggerate the shape of our graphs. The trace is processed as follows:
-
1.
For each key in the trace, call Cache.get(K).
-
2.
If it misses, the driver uses the value number in the trace file to construct a tree of the given size. It delays execution for a time proportional to the size of the tree and the miss cost. It then stores the key and value (tree) in the cache using Cache.put(K,V).
-
3.
If it hits, the cache returns the associated tree data structure. The driver performs a modest computation on the tree that visits all the nodes.
Measurements. We record several measurements for each complete run of a trace file:
-
•
Total time, mutator time, and GC time (with GC time broken down into sub-categories).
-
•
Hit and miss rate, as well as time spent servicing misses
-
•
Number of garbage collections
-
•
Total memory allocation
2.3 Guava performance
(a) Workload of small values (10K-50K)
(b) Workload of medium values (50K-100K)
(c) Workload of large values (100K-200K)
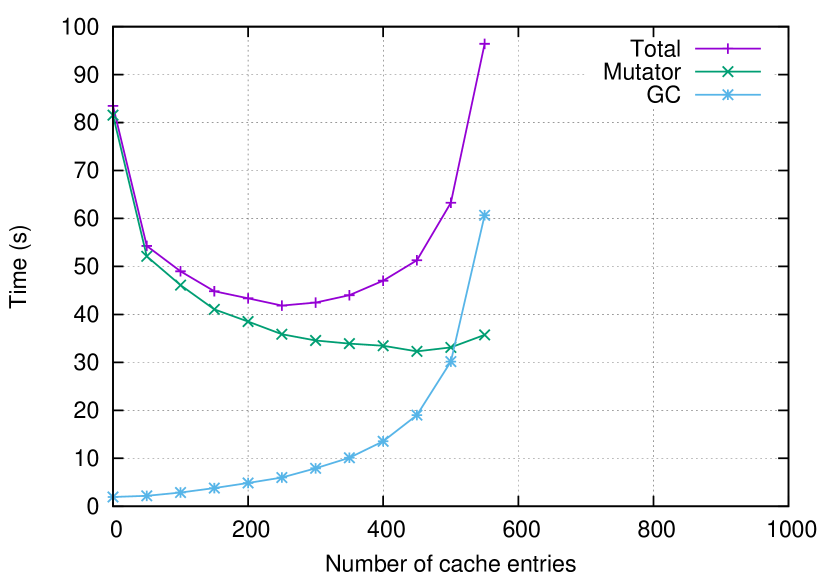
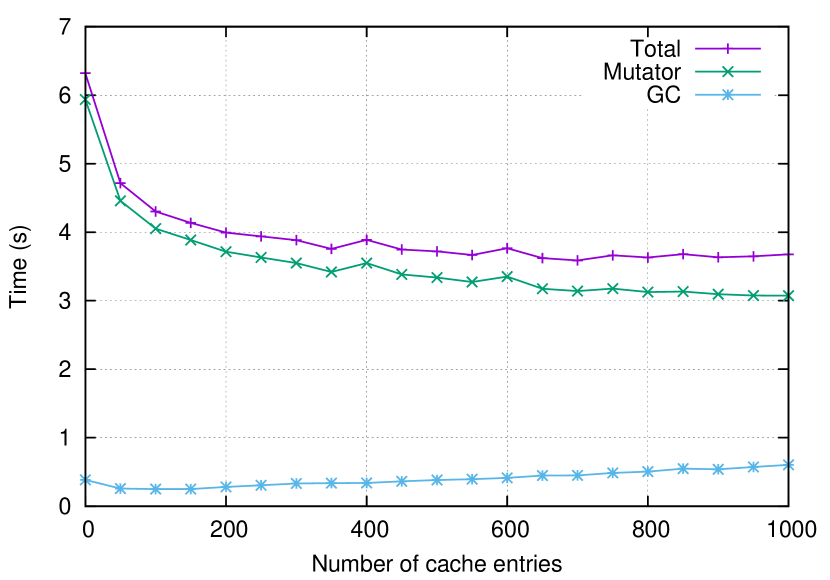
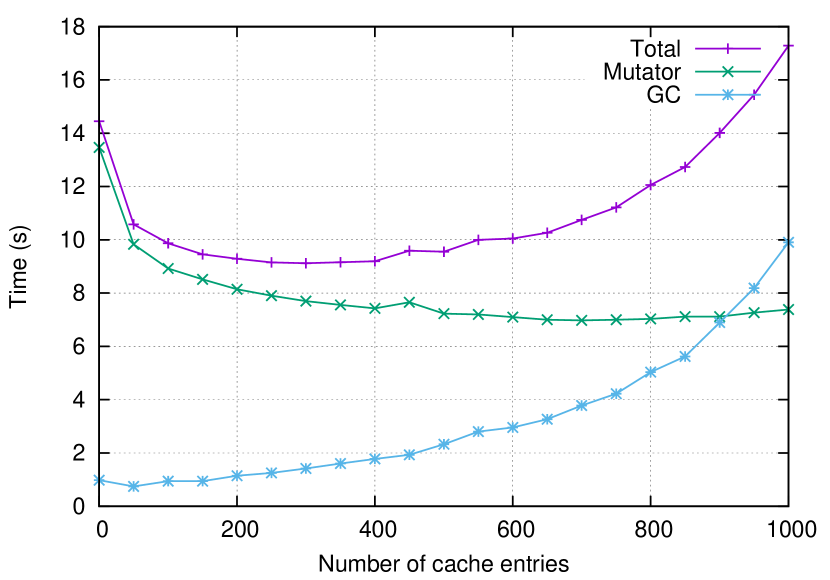
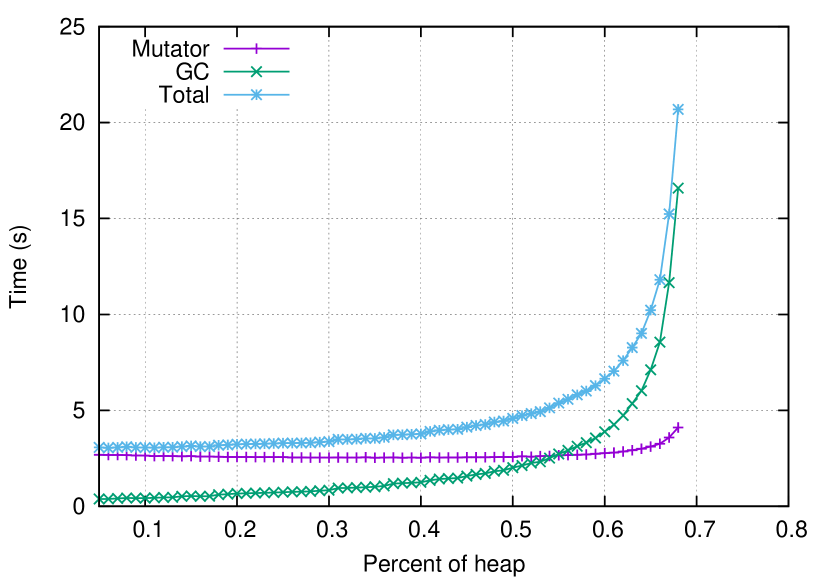
The three graphs in Figure 4 are typical of the performance we see for a traditional cache implementation. For these experiments, we vary the capacity of the cache from 100 to 1000 entries (the X axis) and measure the time to process the entire trace (Y axis). The heap size is fixed at 115MB. We show mutator (application) time, GC time, and total time. The three graphs differ in the sizes (in bytes) of the cached values, which affects both the memory footprint of the cache and the cost of a cache miss:
-
•
Figure 4(a) shows the performance on a trace with small-sized values (10K to 50K bytes). In this case, the total time continues to drop all the way out to 1000 entries, suggesting that the cache could probably accommodate more before incurring a memory cost.
-
•
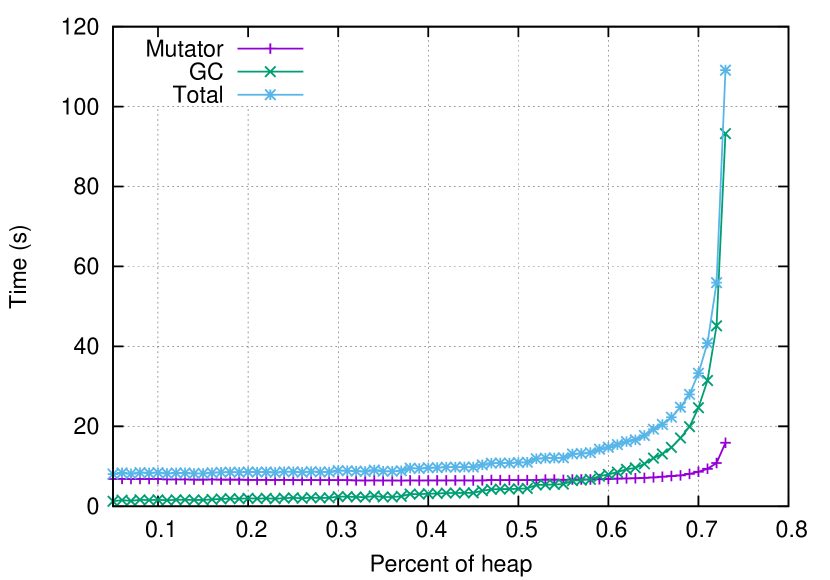
Figure 4(b) shows the same graph for medium-sized value (50K to 100K bytes). It exhibits the typical “bowl” shape for the total time, which is explained by the opposing curves of the miss cost (going down) and GC time (going up). Miss costs are accounted for in the mutator time. GC costs at the right edge go up steeply because the cache is approaching the maximum heap size and causing memory pressure.
-
•
Figure 4(c) shows the results for larger values (100K to 200K bytes). Under this workload, only a narrow range of cache sizes is usable. Too few and the miss costs are huge; too large and the cache runs out of memory.
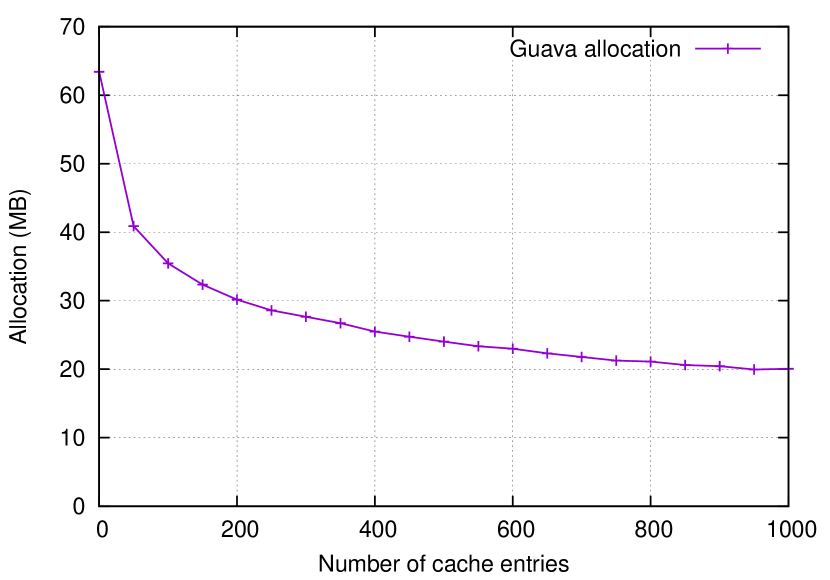
Looking at other metrics provides further insight into this behavior. At the left of the graph (when the number of entries is small) several factors are hurting performance. First, the number of misses is higher, incurring the cost of “fetching” (rebuilding) the value. Second, evictions are more frequent, filling up memory with garbage. Third, rebuilding the values increases total allocation costs. Figure 5 plots the total amount of allocation for a run of the trace under different cache sizes. The smaller sizes cause a significantly higher allocation rate.
These results suggest that bounding a cache unnecessarily when more memory is available can lead to performance degradations that are nearly as great as having a cache that is too large. In fact, we conclude that it does not make sense to evict entries at all if there is sufficient memory to hold them.
3 Prioritized Garbage Collection
In this section, we introduce new runtime support for software caches and other space-sensitive data structures. The primary goal is to provide an effective mechanism for implementing eviction policies that take into account both memory utilization (which only the garbage collector knows) and the relative value of cache entries (which only the application knows).
3.1 API
Prioritized garbage collection is a cooperative technique, so the central feature of our system is an API that allows application code to communicate directly with the garbage collector. Our API is modeled after Java reference objects, which already play a similar role. Each reference object points to a single target referent, and the particular type of reference object chosen tells the collector how to treat the referent – typically, it specifies when the referent can be reclaimed even if it is still reachable. For example, the Java garbage collector will clear a WeakReference to an object when there are no other ordinary (strong) references to it. Since the application is not aware of when collection occurs, it discovers that a reference has been cleared only when it attempts to get the referent and the result is null.
3.1.1 PrioReference
Following this model, a priority reference is a new reference type that may be cleared by the collector in order to bound memory use, but only after all other references of lower priority have already been cleared. The PrioReference class definition is shown in Figure 6. Each PrioReference has a priority value, which is simply an integer – higher values represent higher priorities. The application is free to choose and change this value in any way. In our cache implementation (below), for example, each cached value is held in a PrioReference, and we implement LRU eviction by ensuring that the most recently hit entry has the highest priority.
The getGCSize() method allows the application to find out the total memory footprint of all objects reachable only through this reference. Ordinarily, this information is difficult or inefficient to compute, but our collector computes it as part of its normal marking phase, incurring little overhead. It needs to know this information in order to determine whether the size bound has been exceeded, so we opt to make it available to the application as well. The only caveat is that it is only computed at GC time, and so it is not guaranteed to be fresh or even computed at all. The hasGCSize() method asks whether or not the collector has computed the size. Once getGCSize() is called, the flag is reset until the next collection.
In Section 3.3, we describe the details of how size information is computed and used in the collection algorithm.
3.1.2 PrioSpace
In order to support multiple independent caches, priority references are grouped into priority spaces, each with its own memory bound. The PrioSpace class definition is shown in Figure 7. PrioSpaces are not spaces in the memory management sense, but rather a collection of references that are considered together. The collector considers each priority space separately, evicting the lowest priority references until the total memory footprint reachable from the remaining references is smaller than the target bound. At the lowest level, this bound is expressed in bytes, but our API also allows it to specified as a fraction of total memory or as a fraction of available memory, which can change dynamically as the program runs.
In a typical configuration, each cache would be managed in its own PrioSpace, but this one-to-one mapping is not required. For example, we can emulate SoftReferences by placing all PrioReferences in one PrioSpace and associating the priority of a reference with the time the program last uses a reference.
3.2 Measuring Memory Footprint
The job of our collector is to bound the total memory footprint of each priority space by keeping as many high-priority entries as will fit in the available space, and freeing the rest. In order to do this job the collector must be able to accurately measure the memory footprint of each entry, as well as its contribution to the total memory footprint of the priority space. There are several factors that complicate this computation. First, entries may consist of complex, pointer-based data structures, so it is not sufficient to measure only the size of the object directly pointed to by the priority reference. Second, we need to properly handle shared structures to avoid counting them multiple times. Third, we need to account for fragmentation to make sure that the sum of the sizes properly reflects the actual fraction of total memory used.
3.2.1 Fragmentation
Many kinds of memory allocators can suffer from fragmentation, in which small chunks of memory become unusable, taking away from the total available. Fragmentation is a concern for our algorithm because it could cause us to underestimate the total memory cost of a set of objects. Traditionally, fragmentation is divided into two categories: internal and external wilson95 . Our algorithm can easily account for internal fragmentation, but external fragmentation is more complex, as discussed below. In general, though, fragmentation has not been found to be a major problem for dynamic memory management johnstone98 .
Internal fragmentation is created when the allocator reserves more memory than is requested for an object in order to comply with alignment, padding, or size restrictions. For example, our current implementation uses a free list allocator with fixed size classes, so all small objects must be allocated into one of the 51 possible size denominations. Objects that do no fit perfectly are allocated in the next size up, leaving some number of bytes unused. Luckily, internal fragmentation is easy to account for: whenever the algorithm needs the size of an object, denoted in this section, we use the allocated size, which includes unused padding, if any.
External fragmentation is created when sequences of allocations and deallocations leave unused memory in between objects. Unlike internal fragmentation, our algorithm cannot directly account for external fragmentation because it cannot determine if a given unused fragment should be charged to any particular priority space (or none at all). As a result, our algorithm views all free space as available for non-cache objects, potentially reducing the usable free space by the amount of the fragmentation. In practice, the free list allocator in MMTk has been observed to have low fragmentation blackburn04 , but if it became a problem we could change the underlying allocator or collection algorithm, both of which are largely orthogonal to our technique. There is no reason we could not use a compacting collector, for example.
3.2.2 Reachability
If we consider only the memory used by the objects immediately pointed to by each priority reference, computing size is easy and requires little additional collector machinery. However, many data structures have complex internal structure. Even strings typically consist of two objects: a string object and a character array. From a memory use standpoint, it makes sense for the size of a string to include the size of its character array.
We therefore define the total memory footprint of a priority space as the sum (in bytes) of the sizes of all objects transitively reachable only from the priority references in that space. We purposely exclude any objects that are also reachable from roots because clearing the associated priority references will not cause them to become garbage. In other words, we exclude the parts of the memory footprint that the priority space cannot control.
3.2.3 Structure Sharing
The size computation has algebraic properties that are crucial to ensuring we meet the target memory bound. If the size computed for a particular referent o is , the total size of a set of objects should be given by the following formula:
While the formula seems obvious, consider the case where two priority references share some internal structure. We need to be careful that common objects are only counted once. Otherwise, the sum of the sizes could overestimate the total memory footprint. Our algorithm guarantees this property by visiting each object only one time (see algorithm below for details), but this choice affects the measured sizes of the individual entries. For example, if two structures with roots and share a common object , only one of their sizes will account for – the one that is traced first. In this case, will not consider any objects reachable from . Let represent the objects only reachable from . Then the sizes of and are as follows:
The sum, however, still accurately reflects how much memory is actually in use by all of the priority references together:
The property above is crucial to our enforcement mechanism because it means we can trace a sequence of cache entries in any order, and the running sum of their sizes at any point represents how much memory would be occupied if all remaining entries were evicted.
To see why tracing the sequence in order is important, consider an extreme example in which three small entries, , , and , each of size bytes alone, share a large common structure of size bytes. Visiting the references in order will cause to have size , and and to have size . If the space bound is less than it might be tempting to evict only . This choice will not achieve the expected space savings because and hold references to the shared state so only bytes will be recovered. If we inspect them in order, though, we can see that the bound is reached during tracing of , and all three entries need to be evicted in order to get below target size .
A similar issue exists for structures shared between priority spaces, although we consider this case to be more unusual. At each collection, the PrioSpace learns the total memory footprint of its PrioReferences. Consider the case where two PrioSpaces hold PrioReferences to the same data with memory footprint of . bytes At first, we may consider that the total memory footprint of both PrioSpaces includes those bytes. However, we use the marking bit to measure , implying we can only measure once per collection. While each collection processes all PrioSpaces, only the first PrioSpace to measure those bytes and add it to their total memory footprint. Any other space will regard as a structure in use elsewhere in the program and pass over it.
3.3 Collection Algorithm
The Prioritized Garbage Collector is built on a standard full-heap mark/sweep collector. The algorithms are amenable, however, to any tracing collector, including copying collectors and generational collectors. The reason that we focus on pure mark/sweep is that caches are highly non-generational data structures: none of the entries are short-lived, and under LRU, entries must sit in the cache for some time before they become the least-recently used and are evicted. In addition, this collector performs full-heap collections more frequently, so eviction policies built on it run more frequently.
Our collection algorithm is based on two key ideas:
-
•
We reorder heap tracing so that we can visit specific regions of the heap graph based on their reachability – specifically, the regions reachable from priority references. No significant additional work is required, so this overhead is very low. This technique has been used by other systems to check heap properties using the garbage collector aft09 .
-
•
We introduce bounded marking, in which the garbage collector traces a region until a condition is met (for example, the memory bound is reached); then it simply stops marking and nulls out potential dangling pointers. Unmarked objects are reclaimed immediately by the sweeper without being touched again.
The key to our algorithm is that it does not explicitly free low priority references to satisfy the memory bound; rather, it protects high priority references (by marking them) until the memory footprint grows to the bound. Once the bound is reached, the algorithm ceases to mark any other objects in the priority space. With a small amount of fixup to avoid dangling pointers, the remaining low priority references will be reclaimed immediately by the sweeper. This approach guarantees that the memory bound will be respected (see reasoning below). A secondary benefit is that the collector does not need to touch the evicted objects, which might improve CPU cache performance, although we do not measure this effect here.
To ensure that the collector counts only objects reachable solely from the priority space, we reorder the phases of the collector as follows:
-
Phase (1):
Compute exact target sizes (in bytes) for priority spaces that are specified in fractional terms. For example, if a priority space specifies its bound as 20% of the total heap, the collector uses computes as the bound.
-
Phase (2):
Premark all PrioReference objects held by the PrioSpace.
-
Phase (3):
Perform a complete mark over transitive closure from the root references. This process will stop at each PrioReference, so the only objects that will remain unmarked are either garbage or are reachable only through a priority reference.
-
Phase (4):
Revisit each PrioReference in priority order, from highest to lowest, and perform a transitive closure starting at its referent object. During this phase, the collector computes a running sum of the object sizes. If the total size hits the memory bound for the space then this phase ends immediately. Since it visits the priority references in order, the remaining unmarked instances must all be lower priority.
-
Phase (5):
Any PrioReferences with unmarked referents are nulled out (the pointer to the referent is set to null).
-
Phase (6):
If Phase (3) ended early, it could leave part of a data structure marked, with outgoing pointers to unmarked objects. To preserve memory safety the collector also nulls out all potentially dangling pointers as well as the priority reference containing this partial structure – in effect, evicting the entire structure.
-
Phase (7):
Evicted objects are garbage, and can be immediately reclaimed by the sweeper.
Notice that since the collector is doing the work, eviction only occurs at GC time. But this makes sense: we cannot assess the global memory situation until GC time, and we don’t have an effective way to recycle memory in between GCs.
Partial eviction.
Phase (5) of the algorithm handles the case in which bounded marking stops part-way through a data structure, leaving pointers from marked objects to unmarked objects. In order to preserve memory safety, this phase nulls out all of these references. In addition, we null out the PrioReference itself, which makes even the partially marked portion of the structure unreachable.
There is a case, however, in which a program could observe a partially evicted structure. We believe this case would be rare, however, since it only happens under very specific conditions. If the program creates a weak reference to an object in the cache, and that object is part of the marked portion of the partially evicted structure, then our JVM will preserve the weak reference and the object it points to. This weak reference will be cleared at the next GC, since the strong reference from the cache entry is now unreachable, but there is a brief period where the program could follow the weak reference and find a structure with null fields in unexpected places.
We have not been able to find a satisfactory and performant solution to this problem. If a program cannot tolerate partial eviction, however, our implementation provides a switch that forces eviction only at cache entry boundaries – that is, when the space limit is reached, the mark phase continues until the current entry is completely marked. The downside of this option is that it allows the cache to grow beyond the size limit. In practice, however, we find that it only hurts performance when cache entries are very large (100’s of KB each) and keeping the extra objects is a substantial burden on memory resources.
3.4 Overheads
3.4.1 Runtime Overhead
Phase (3) of the algorithm above requires the collector to visit PrioReference objects in priority order. In our current implementation, the PrioSpace class keeps its priority references in a max heap, so that common operations are time. This cost, however, is paid every time the priority of a reference changes: the priority space must re-insert it into the heap. It is possible that in some configurations the total cost of these inserts would exceed the cost of simply sorting the list immediately before garbage collection. In practice, we have not observed a significant performance penalty.
3.4.2 Space Overhead
Each PrioSpace stores its PrioReferences in a max heap, which is implemented as an array. Furthermore, we arrange the PrioSpaces into a linked list in the VM, using an extra reference in each PrioSpace to point to the next one. So, if we have PrioReferences spread across PrioSpaces, then the total space overhead is references, in addition to the space required for each PrioReference and PrioSpace instance.
3.5 Sache: A Space-aware Cache
Using these mechanisms, we implemented a space-aware cache that we call a Sache. The interface to the Sache is essentially the same as the Guava LRU cache, and it can be used as a drop-in replacement. An overview of the Sache class is shown in Figure 8.
As with a cache built around a HashMap, we can put key-value pairs in, get a value using a key, and remove a value using a key. The Sache stores all values in PrioReference objects, so that the collector can measure and evict them as necessary. The Sache increments the highest_priority value as necessary to ensure that the most recently hit value has the highest priority. The methods work as follows:
Constructor: create an empty hash map and an empty PrioSpace with the given space bound maxSize. We also support a version that specifies the size as a fraction of available memory.
get(K): If there is an entry in the map for the given key, update the priority on its PrioReference to highest_priority (incrementing if necessary) and return the referent value. If not, return null.
put(K, V): Create a new PrioReference in the Sache’s priority space with the value V as the referent and give it the highest priority. Store the pair of key K and priority reference in the hash map.
remove(K): If there is an entry in the map for the given key, remove it from the map and remove the corresponding PrioReference.
update: Periodically scan the hash map looking for entries that have null values in their PrioReferences, indicating that they were evicted by the garbage collector. This method runs when the program accesses the Sache after a collection and does not interact with the PrioSpace. Since the collector already evicted the PrioReferences from the PrioSpace, we can complete this operation in , where is the number of entries in the Sache.
It is possible to add collector support to remove an entry from the Sache whenever the collector decides to evict its corresponding PrioReference. In particular, we can manipulate the Sache’s outgoing pointers directly. This would improve the performance of the update operation. However, we decided against this to provide a more general reference type versus a cache-specific reference type.
3.6 Adaptive Sizing
The Sache is an efficient and effective bounded-size cache supported directly by the garbage collector. The problem remains, however, of how to choose its size. As we show in Section 4, choosing a fixed size, measured as a fraction of total bytes in the heap, yields good performance across a range of workloads for our simple key-value store. Many applications that use caching, however, are not just key-values stores – they have other computations going on that are competing for resources. For example, looking at the results we might choose a Sache sized to occupy about half of the heap. If other parts of the program need the other half, however, the resulting memory pressure will cause massive GC overhead.
Our solution is to adaptively size the Sache according to available memory. Our current policy is simple: at each garbage collection we choose a Sache size that ensures a minimum amount of free memory (if possible). Other policies are certainly possible, and we discuss some of them in the future work section.
To ensure a free memory reserve of size bytes, we need to know the size of the heap ( bytes), and the total live size of all the data not in the Sache (). Using this information, the maximum size of the Sache is set to .
We can efficiently recompute this value at every garbage collection, growing or shrinking the Sache adaptively. Phase 2 of our algorithm visits all objects not in the Sache, so we can augment it to also compute their total size, which is . Before Phase 3 starts, we compute the target bound for the Sache, and the algebraic properties of the bounding mechanism guarantee that evicted entries will leave at least R bytes free.
4 Results
In this section, we evaluate how prioritized garbage collection helps overcome the conflicting space-time tradeoffs of software caching and automatic memory management. Note that there is nothing particularly innovative about our core caching algorithm or data structure. The Sache is essentially just a hash map. The difference is in how it manages provisioning – specifically, how it manages the number of entries in the hash map. Given a fixed configuration, it performs almost identically to the Google Guava cache on a given workload. What we show here is that with support from the collector, the Sache can automatically vary its configuration to make the best use of available memory regardless of the characteristics of the workload. In addition, it can adapt online to changes in memory use or workload.
4.1 Experiments
We evaluate our system using two caching applications: a key-value store driven by the same synthetic workloads presented in Section 2, and a web caching implementation driven by real traces of web traffic. Since the Sache API is almost identical to the Guava LRU cache API, we can easily switch between cache implementations in each benchmark system. We show results for the following experiments:
-
•
First, we repeat the experiments shown in Section 2 using a Sache configured with a range of fixed sizes (non-adaptive). Specifying the size in terms of memory footprint instead of number of entries is robust across a range of workloads.
-
•
Second, we enable the adaptive sizing algorithm for the Sache and show that it can dynamically shrink or grow the Sache in response to changing memory demands in other parts of the program.
-
•
Third, we test the two cache implementations under a real workload of web traffic. Software caches perform the work of the central data structure in a web cache (something similar to memcached). This application is challenging to implement in a garbage-collected language, since the goal is to cache as much as possible.
4.2 Methodology
We implemented our GC mechanisms in JikesRVM version 3.1.2 as a modification to the stop-the-world mark/sweep collector. The Sache itself is implemented at the application level. We have also incorporated these mechanisms into a generational collector, but it provides little benefit for cache-heavy applications because caches are so strongly non-generational. In addition, the generational collector delays computation of the size information and enforcement of the eviction policies, since these mechanisms cannot be implemented properly for partial collections.
Building and running.
We build JikesRVM in the FastAdaptive configuration (for performance). The Guava experiments are run on an unmodified version of JikesRVM to avoid incurring any possible penalty related to prioritized GC. All experiments are run on a machine with dual 2.8GHz Xeon X5660 processors (X64) with a total of 12GB of main memory running Ubuntu Linux kernel 3.2.0.
We run each configuration only one time, but due to the length of the traces (tens of thousands) small fluctuations in the cost of any individual cache operation or garbage collection are averaged out. In addition, the performance differences we highlight are orders of magnitude greater than experimental noise, and in many cases it is the difference between running to completion or crashing with an out-of-memory error.
4.3 Non-adaptive Sache
(a) Workload of small values (10K-50K)
(b) Workload of medium values (50K-100K)
(c) Workload of large values (100K-200K)
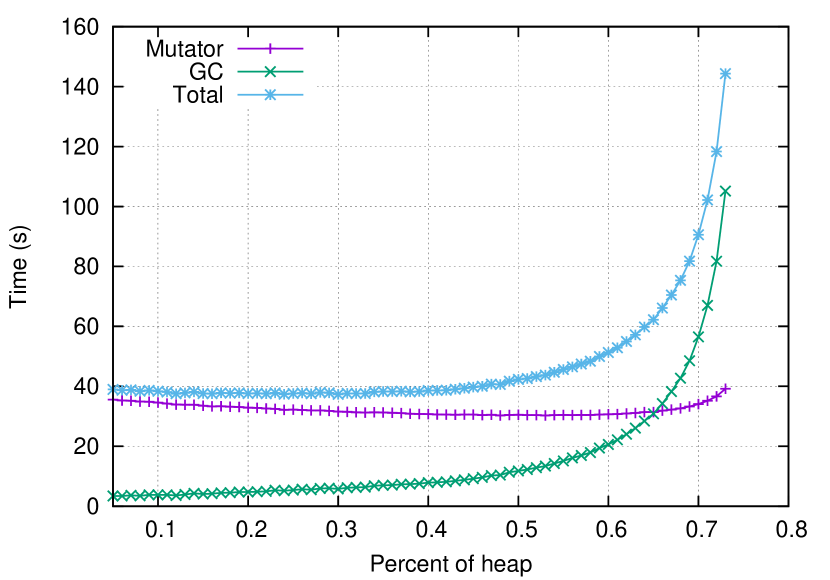
Figure 9 shows the performance of a Sache under the same workloads as the Guava cache. We measure the size as a percentage of the heap instead of a maximum number of entries. Each graph has three curves: one for mutator time, one for GC time, and another for total time.
-
•
Figure 9(a) shows the performance on the trace with small-sized values. The total time is a bowl shape, but the minimum occurs early on at a limit 10% of the heap size. Afterwards, the mutator time remains steady until 65%.
-
•
Figure 9(b) shows the performance on the trace with medium-sized values. The minimum of the bowl is not present on the graph. Just like the graph with small-sized values, the Sache peaks heavily towards the end, dominated by garbage collection cost.
-
•
Figure 9(c) shows the same graph for larger values. The Sache continues to function even when using 75% of the heap. This comes at the cost of increased garbage collections.
All three graphs have the same shape. The mutator time is about the same until after 60% of the heap is reserved for the Sache. Recall that the Sache limit is only enforced at a collection. Therefore, the Sache holds more values and more hits occur. The application does not rebuild values, lowering the mutator cost. On the other hand, the Guava caches have to rebuild many items at when we have a low limit on the number of entries.
Despite the Sache using a lot of memory prior to GC, the GC curve starts low and peaks towards the end. The prioritized GC frees elements of the Sache as soon as it observes the limit would be exceeded. This leaves much less garbage in the heap than simply evicting the value from the Sache outside of GC.
Figure 10 compares the above results with the graphs for Guava in Section 2. To directly compare them, we plot the Sache with the average number of entries after a garbage collection. Recall that prioritized GC only enforces the bound at a collection, so the Sache actually grows larger in between collections. These numbers are approximately the memory bound of the Sache divided by the average size of the values in the trace.
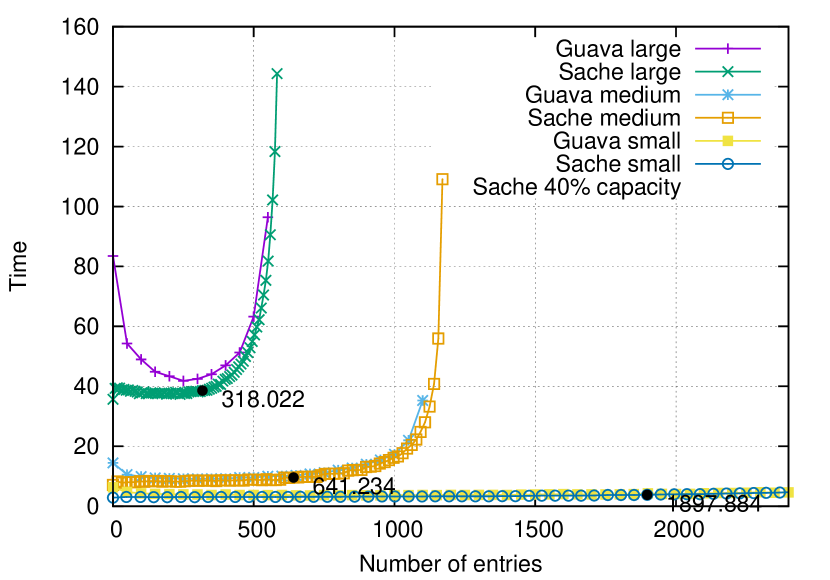
We see that the shapes of the curves between Guava and the Sache are about the same. The key difference is that Sache curves represent the same set of configuration options – 10% of the heap on the low end and 80% of the heap on the high end. A programmer could choose a Sache capacity of 40% and be able to achieve good performance regardless of the workload. The three labeled points on the graph show how this choice leads to different numbers of entries under the different workloads.
Looking at the small workload, the Guava’s curve is about flat while the Sache’s extends further out and eventually starts to move upward. The Sache utilizes as much memory as it can before the limit is enforced. This allows the lower end limits of 5% to perform better than the hard limit of 1500 entries on Guava.
Looking at the larger values, the Guava cache fits less than 600. The size limit on the Sache and prioritized GC allow the Sache to handle a mix of sizes. In particular, the collector frees values that the Sache will not keep because of the size limit. This also allows the Sache to hold more items than the Guava cache can, by prioritizing smaller values.
4.4 Multiple Caches
One of the problems with soft references is that they are managed by the JVM using a single global policy. Even if that policy happens to be the right one (e.g., LRU) treating all soft references as equal can lead to very bad performance. Consider, for example, a program with two caches. If one cache is accessed less often than the other then its entries will tend to appear towards the end of the global soft reference LRU queue. When memory is tight, many more of its entries will be reclaimed regardless of their value to the application (i.e., regardless of the miss cost).
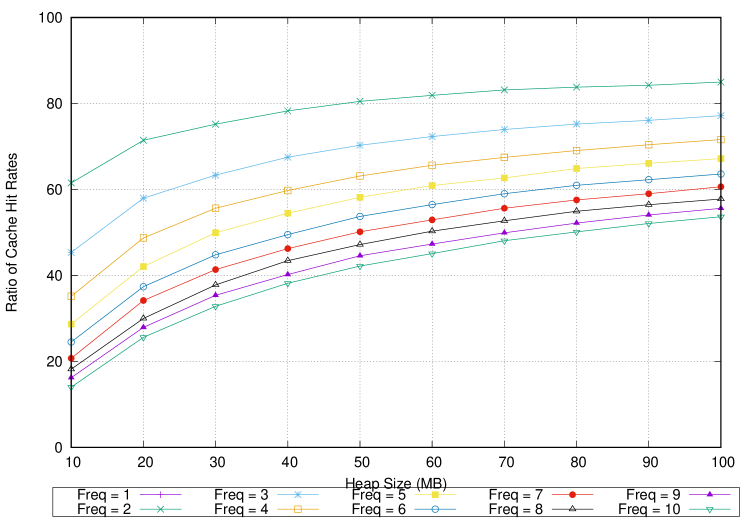
We measure this effect directly using the following experiment: we run two caches simultaneously and have both serve requests from our largest trace, but at different frequencies. One cache processes requests for every request the other cache processes. We also use a larger heap size to measure the effect of having more memory available. We run this experiment on the Hotspot VM with Guava caches using soft references and no explicit size limit or eviction policy. We do this to measure the effectiveness of HotSpot’s soft reference eviction policy alone. We also run the experiment on our modified VM with two Saches, each configured to use 20% of the heap. We use the LRU policy for each Sache’s PrioSpace to match Hotspot’s policy for removing soft references. Hit rates are reported as a number between 0 and 1. We report the difference between hit rates on the same scale. Figure 11 presents the results of this experiment.
Figure 1111(a) shows the results for soft references running on HotSpot, which clearly reflect the global LRU policy. The X-axis shows the heap size; the Y-axis shows the ratio of the measured hit rate to the maximum hit rate. As the difference between the access frequencies of the two caches grows, the hit rate of the slower cache drops significantly. Its entries appear to be less valuable because they are less frequently accessed, so the soft reference eviction policy removes them first. The effect is more pronounced in smaller heaps because the soft reference policy is more aggressive. In the worst case (10-to-1 frequency difference), the hit rate is only 1/4 of its potential, but the degradation at just a 2-to-1 difference is very significant as well.
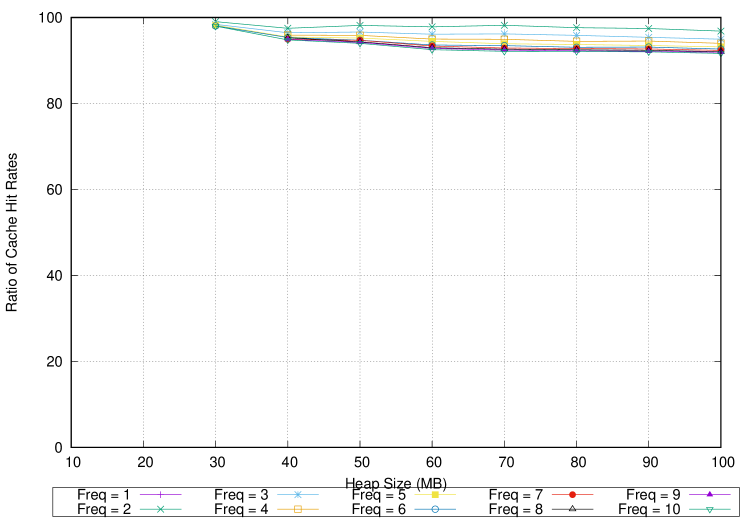
Figure 1111(b) shows the same results for prioritized garbage collection. The hit rates of the two Saches differ by at most 5% because the PrioSpaces manage their references separately, so the VM does not clear the PrioReferences in the less frequently used cache regardless of what is going on in the higher frequency cache.
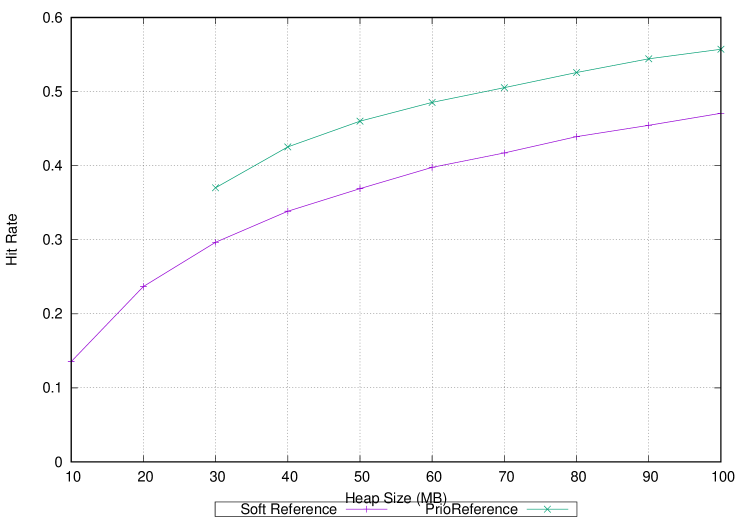
Finally, Figure 1111(c) shows the maximum hit rate (in absolute terms) for both the Guava cache with soft references and the Sache with PrioReferences. As expected, with no competing memory demands, the two systems perform almost identically. Note that for Figures 1111(b) and 1111(c), the Sache does not have data for 10MB and 20MB. Since VM objects share heap space with Java applications in JikesRVM, we needed 30MB to start running the experiment without running out of memory.
4.5 Adaptive Sache
The purpose of the adaptive sizing algorithm is to allow the cache to respond to changes in the available resources. Our goal is to prevent the cache from competing with other application data structures, causing unnecessary memory pressure.
For these experiments, we modified our benchmark to build a separate large data structure that grows as the trace is processed. Each experiment is divided into three phases: during the first 1/3 of the trace, no extra memory is used; during the middle 1/3, the program starts growing the non-cache data structure, consuming more and more memory; during the last 1/3 of the trace, the program slowly dismantles the structure, allowing the collector to alleviate the pressure.
We ran our medium-sized-objects trace through the key-value store using both the Sache and Guava LRU cache. For the Sache, the adaptive algorithm is configured to target a 50% memory reserve. This value corresponds to a heap two times the live size, which is a good target for performance 1094836 . We size the Guava cache using the data collected in Figure 4(b): the best size for this workload appears to be around 350 entries. We fix the heap at 115MB, as in the earlier experiments.
(a) Total time

(b) Mutator time
(c) GC time
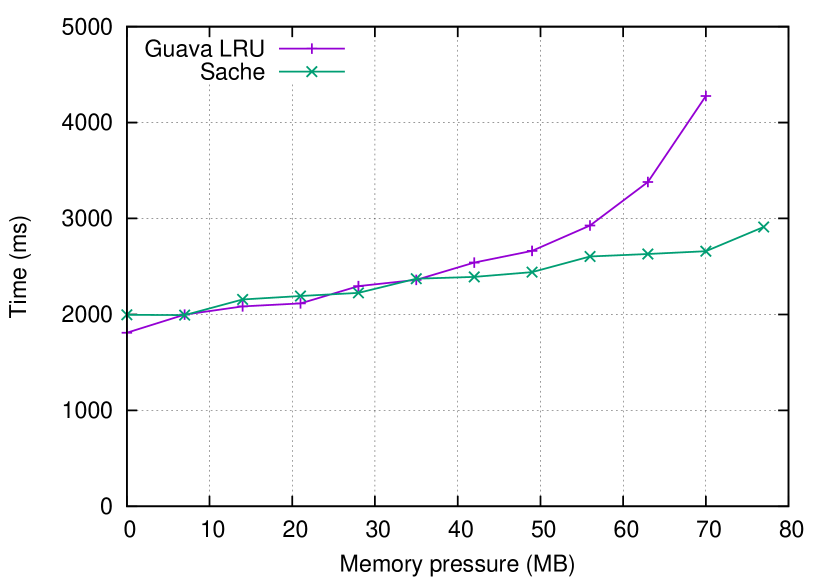
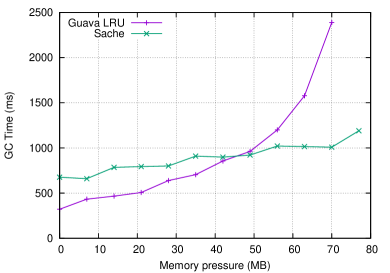
Figure 12 shows the total time, mutator time, and GC time. Unsurprisingly, the Sache and the Guava cache exhibit similar performance as long as memory is plentiful. As memory pressure increases, however, the Guava cache competes with non-cache structures in memory, and GC costs skyrocket. When memory pressure exceeds 77MB, the Guava implementation crashes. The Sache automatically shrinks to ensure sufficient free memory, resulting in a smooth curve and no crashes.
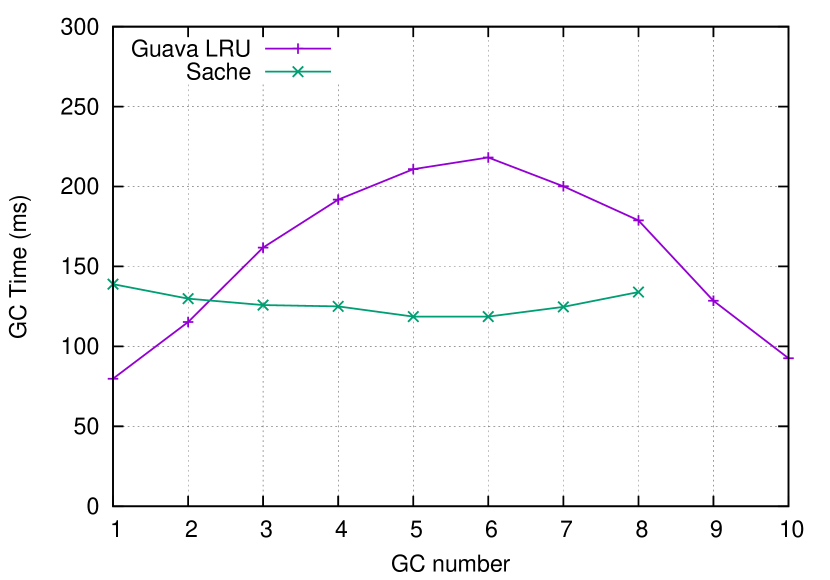
Figure 13 provides some insight into this behavior. It shows the GC time for each collection during a single run of the benchmark. As expected, in the Guava implementation, once the non-cache structure begins to grow, each GC becomes much more expensive. In addition, memory scarcity triggers more frequent GCs. With the adaptive Sache, the GC time is flat: the algorithm guarantees that the cache will not cause the live size to exceed the target reserve.
4.6 Web Caching Workload
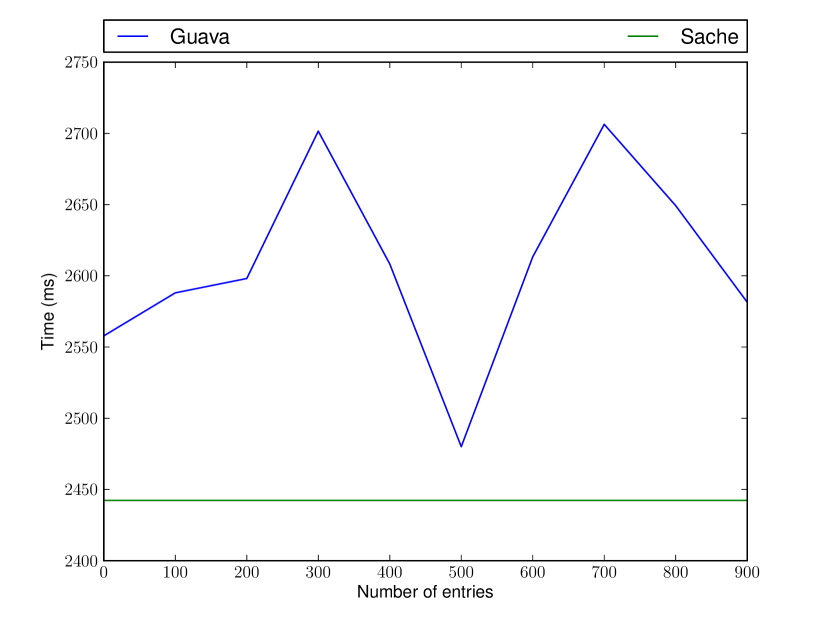
The heart of a web caching application, such as memcached, is a key-value cache like the ones we describe here. We adopted the techniques for testing web caches and applied them to our cache implementations. We use the BU 272 trace, a record of real web traffic, to drive the caches, and measure performance as abovecunha95 . It consists of 15K entries requesting a total of 72MB of web data. Figure 14 shows the performance of the Guava cache across a range of numbers of entries. The Sache is a flat line, since it chooses its own size.
5 Related Work
5.1 Reference Types
Hayes introduced Ephemerons to determine unreachable objects in key-property lists instead of using a list with a weak key and strong value hayes97 . This capability allows entries with dead keys to be removed from the list and properly deleted. We expect items in a cache to be reachable only from the cache. Therefore, removing stale objects is not a priority. Instead, we remove elements that cause our structure to exceed its limit.
5.2 Programs Acting on Resource Limits
There has been considerable work on caching for web traffic. The Greedy-Dual algorithm takes into account the amount of time to obtain a page as well as the size of the page to determine its eviction cao97 . The cached objects are text documents, so their size can be easily measured. Our system allows these kinds of eviction policies to be used in general software caches, where measuring the size of a cached structure is non-trivial.
Yang and Mazières describe resource containers for Haskell that bound the memory usage of untrusted code yang14 . Exceeding the limit of the container kills the accompanying thread. A Sache is a more general structure which allows the program to choose what action to take when memory bounds are exceeded. In principle, it could also be used to implement a similar security policy.
Czajkowski and von Eicken introduced an interface for programmers to monitor the resources used by threads in a Java program czajkowski98 . Furthermore, they allow programmers to implement their own reaction to threads exceeding their resource limits. They use bytecode rewriting to track heap memory usage for each thread. In contrast, we track a list of known objects and use the garbage collector to both track memory usage and enforce the limits. In addition, our technique uses general heap reachability to define bounded structures, rather than thread ownership.
JAMM uses JVMTI to traverse the heap and compute the size of data structures jamm . This approach is flexible and powerful, but very slow. A large data structure can require seconds of runtime to size (according to the documentation). By piggybacking on the garbage collector, we can perform the same measurement with almost no performance overhead. The tradeoff, however, is that we cannot compute sizes at arbitrary points during execution.
Price, Rudys, and Wallach divide a process into tasks and used the garbage collector to track how much memory is attributed to each task price03 . Our work expands on this by allowing arbitrary data structures to be tracked and by providing a way to enforce a size limit.
5.3 Using GC to Assist Running Programs
O’Neill and Burton presented simplifiers as a way to improve the performance of a program o'neill06simp . Objects can add a simplify() method that the garbage collector invokes when the collector traces over it. The Data Structure Aware Garbage Collector lets the program denote which objects are internal nodes for data structures cohen15dsagc . It uses this information to improve garbage collection for these structures and therefore overall performance. Our work uses the GC to allow programs to run when they would run out of memory in normal execution. Furthermore, we can traverse and modify the structures without editing those structures’ code.
6 Conclusions and Future Work
This paper presents a new approach to managing the conflicting tradeoffs between software caching and garbage collection. The key to our approach is widening the interface between the application and the runtime system in order to increase cooperation and break the tradeoffs. Caches are representative of a broader class of resource-sensitive data structures and algorithms that are not well served by existing collection algorithms. Our ongoing work is to look carefully at the particular needs of these applications and provide ways for them to be more effectively served by the runtime system to improve performance and robustness. We also are looking into how to divide available heap space amongst multiple PrioSpaces and therefore multiple Saches.
Emery Berger was supported by NSF grant CCF-1439008. Diogenes Nunez was supported by the Google Research Award.
References
- [1] Edward E. Aftandilian and Samuel Z. Guyer. GC assertions: Using the garbage collector to check heap properties. In Proceedings of the 2009 ACM SIGPLAN Conference on Programming Language Design and Implementation, pages 235–244. ACM, 2009.
- [2] Berk Atikoglu, Yuehai Xu, Eitan Frachtenberg, Song Jiang, and Mike Paleczny. Workload analysis of a large-scale key-value store. In Proceedings of the 12th ACM SIGMETRICS/PERFORMANCE Joint International Conference on Measurement and Modeling of Computer Systems, SIGMETRICS ’12, pages 53–64, 2012.
- [3] Jonathan Bellis. Jamm. https://github.com/jbellis/jamm.
- [4] Stephen M. Blackburn, Perry Cheng, and Kathryn S. McKinley. Myths and realities: the performance impact of garbage collection. In Proceedings of the International Conference on Measurements and Modeling of Computer Systems, pages 25–36, 2004.
- [5] Pei Cao and Sandy Irani. Cost-aware www proxy caching algorithms. In Proceedings of the USENIX Symposium on Internet Technologies and Systems on USENIX Symposium on Internet Technologies and Systems, pages 18–18, 1997.
- [6] Nachshon Cohen and Erez Petrank. Data structure aware garbage collector. In Proceedings of the 2015 ACM SIGPLAN International Symposium on Memory Management, ISMM 2015, pages 28–40, New York, NY, USA, 2015. ACM.
- [7] Carlos Cunha, Azer Bestavros, and Mark Crovella. Characteristics of WWW client-based traces. Technical Report BU-CS-95-010, Computer Science Department, Boston University, Boston, MA, USA, 1995.
- [8] Grzegorz Czajkowski and Thorsten von Eicken. JRes: A resource accounting interface for Java. In Proceedings of the 13th ACM SIGPLAN Conference on Object-oriented Programming, Systems, Languages, and Applications, OOPSLA ’98, pages 21–35, 1998.
- [9] Barry Hayes. Ephemerons: A new finalization mechanism. SIGPLAN Not., 32(10):176–183, October 1997.
- [10] Matthew Hertz and Emery D. Berger. Quantifying the performance of garbage collection vs. explicit memory management. In OOPSLA ’05: Proceedings of the 20th annual ACM SIGPLAN conference on Object oriented programming, systems, languages, and applications, pages 313–326, New York, NY, USA, 2005. ACM.
- [11] Google Inc. SoftReference — Android Developers, 2016 (Accessed March 23, 2016).
- [12] Jikes RVM. IBM, 2005. http://jikesrvm.sourceforge.net.
- [13] Mark S. Johnstone and Paul R. Wilson. The memory fragmentation problem: Solved? In Proceedings of the 1st International Symposium on Memory Management, pages 26–36, 1998.
- [14] Nick Mitchell and Gary Sevitsky. Leakbot: An automated and lightweight tool for diagnosing memory leaks in large Java applications. In ECOOP 2003 - Object-Oriented Programming, 17th European Conference, Darmstadt, Germany, July 21-25, 2003, Proceedings, pages 351–377, 2003.
- [15] M. E. J. Newman. Power laws, Pareto distributions and Zipf’s law. Contemporary Physics, 2005.
- [16] Melissa E. O’Neill and F. Warren Burton. Smarter garbage collection with simplifiers. In Proceedings of the 2006 Workshop on Memory System Performance and Correctness, MSPC ’06, pages 19–30, New York, NY, USA, 2006. ACM.
- [17] Oracle. SoftReference (Java Platform SE 6), 2015.
- [18] David W. Price, Algis Rudys, and Dan S. Wallach. Garbage collector memory accounting in language-based systems. In Proceedings of the 2003 IEEE Symposium on Security and Privacy, SP ’03, pages 263–, Washington, DC, USA, 2003. IEEE Computer Society.
- [19] Paul R. Wilson, Mark S. Johnstone, Michael Neely, and David Boles. Dynamic storage allocation: A survey and critical review. In International Workshop on Memory Management, pages 1–116, September 1995.
- [20] Guoqing Xu, Michael D. Bond, Feng Qin, and Atanas Rountev. LeakChaser: Helping programmers narrow down causes of memory leaks. In Proceedings of the 32nd ACM SIGPLAN Conference on Programming Language Design and Implementation, PLDI ’11, pages 270–282, 2011.
- [21] Edward Z. Yang and David Mazières. Dynamic space limits for Haskell. In Proceedings of the 35th ACM SIGPLAN Conference on Programming Language Design and Implementation, PLDI ’14, pages 588–598, New York, NY, USA, 2014. ACM.