Einasto Profiles and the Dark Matter Power Spectrum
Abstract
We study the mass accretion histories (MAHs) and density profiles of dark matter halos using N-body simulations of self-similar gravitational clustering from scale-free power spectra, . We pay particular attention to the density profile curvature, which we characterize using the shape parameter, , of an Einasto profile. In agreement with previous findings our results suggest that, despite vast differences in their MAHs, the density profiles of virialized halos are remarkably alike. Nonetheless, clear departures from self-similarity are evident: for a given spectral index, increases slightly but systematically with “peak height”, , regardless of mass or redshift. More importantly, however, the “” relation depends on : the steeper the initial power spectrum, the more gradual the curvature of both the mean MAHs and mean density profiles. These results are consistent with previous findings connecting the shapes of halo mass profiles and MAHs and imply that dark matter halos are not structurally self-similar but, through the merger history, retain a memory of the linear density field from which they form.
keywords:
cosmology: dark matter – methods: numerical1 Introduction
The density profiles of dark matter (DM) haloes are well described by the Einasto (1965) profile:
| (1) |
Here and are characteristic values density and radius, and is a “shape” parameter that governs the profile’s curvature. The scaling parameters – commonly cast in terms of virial mass***We define the virial mass, , as that enclosed by a sphere of mean density surrounding the halo particle with the minimum potential energy. This implicitly defines the virial radius as ., , and concentration, – are not independent, but correlate in a way that encodes the formation history-dependence of halo structure: halos collapsing early, when the Universe was dense, inherit higher characteristic densities (or concentrations) than those collapsing later (e.g. Navarro et al., 1997). This idea led to the development of a number of analytic and empirical models that successfully describe the mass, redshift, cosmology and power spectrum dependence of halo concentrations (e.g. Macciò et al., 2008; Diemer & Kravtsov, 2015; Ludlow et al., 2016).
Compared to concentration the shape parameter, , has received little theoretical attention. Its weak but systematic dependence on halo mass and redshift reported by Gao et al. (2008) disclosed a simpler underlying relation when expressed in terms of dimensionless peak height†††The “peak height” is a dimensionless mass variable defined , where is the spherical top-hat collapse threshold and is the rms mass fluctuation in spheres of mass . Note that defines the non-linear mass scale, ., . On average, for all , but increases to 0.3 for the rarest halos in their simulations. This result has been supported by a number of subsequent studies (e.g. Dutton & Macciò, 2014) but the physical origin of the relation has not been pinned down.
Nevertheless, the need for a third parameter is clear and plausible interpretations for its origin have been put forth. Ludlow et al. (2013) suggested that, when expressed in appropriate units, the shape of the average halo mass profile is the same as that of the average MAH: both are approximately universal and well described by an Einasto profile with the same shape parameter (; see Ludlow et al. (2016)). Intriguingly, halos whose MAHs deviate in a particular way from the mean have mass profiles that deviate from the mean in a similar way suggesting that, at fixed mass, halos that assemble more rapidly than average exhibit more “curved” mass profiles, and vice versa. The correlation is weak, however, and substantial deviations from the mean MAH are required to leave a noticeable imprint on .
Cen (2014) argued that profiles similar to eq. 1 may be a natural outcome of gravitational clustering in models seeded by Gaussian density fluctuations. He conjectured that centrally concentrated halos with extended outer envelopes (corresponding to small values of ) form primarily through mergers of many small, dense clumps; the expected outcome for power spectra dominated by short wavelength modes. Conversely, smooth and coherent collapse occurs when the fluctuation field is dominated by long wavelength modes, due to the lack of significant substructure. In this case, diffuse accretion plays a vital role in halo growth and the resulting profile is shallow in the center and steep in the outskirts. This hypothesis is backed-up by numerical experiments (Nipoti, 2015).
Finally, Angulo et al. (2016) showed that a rapid succession of major mergers leads to a remnant whose density profile is more curved than that of its progenitors, supporting the idea that halo profiles are sensitive to the precise details of how their mass was assembled.
What determines the shapes of halo mass profiles? The answer will illuminate the processes that establish the structural properties of DM halos, and may lead to improvements to future models for halo structure. We address this issue here using a suite of self-similar simulations of gravitational clustering. Our simulations and their analysis are described in Section 2; the MAHs and density profiles of halos in each are presented in Sections 3 and 4, respectively. Section 5 summarizes our findings and provides some concluding remarks.
2 Simulations and Analysis
2.1 Scale-Free Models
We consider a suite of Einstein-de Sitter models (matter density ) with self-similar power spectra, , and a scale factor that is a power-law of time, . The only physical scale in such a model is the one at which fluctuations become non-linear at a particular time, which is defined by , where is the non-linear mass. All of our simulations adopt such a model, but change the balance of power between large and small scales by varying the spectral index, . For larger values of , the density field is increasingly dominated by short-wavelength modes, and the characteristic mass grows very slowly. As we will see in Section 3, some control over the growth histories of halos can therefore be attained by varying appropriately.
We simulated four scale-free models (, , and ) using particles to evolve the DM. Gravitational forces were softened at a fraction of the mean inter-particle separation. Although arbitrary, we set the box size to be and normalize the power spectrum so that when linearly extrapolated to ( is the rms mass fluctuation in 8 Mpc spheres). Starting redshifts were chosen to ensure that particle-scale fluctuations were safely in the linear regime, at which point positions and velocities were generated according to second order Lagrangian perturbation theory (Jenkins, 2013) using a different white noise field for each . Our simulations were carried out with a lean version of the gadget code (Springel, 2005).
The simulations were evolved for a range of expansion factors ending either at , or the most recent time at which ( is the box mass). This ensures that fluctuations on the box scale remain close to linear at the final time, limiting the impact of missing large-scale modes. Our simulations probe a very different range of expansion factor: , , 128 and 46.9 for , , and , respectively. For each run 65 snapshots were stored in equally-spaced steps of , with the first output corresponding to the time at which was equivalent to that of particles. Our output sequence ensures that grows by a constant factor between snapshots.
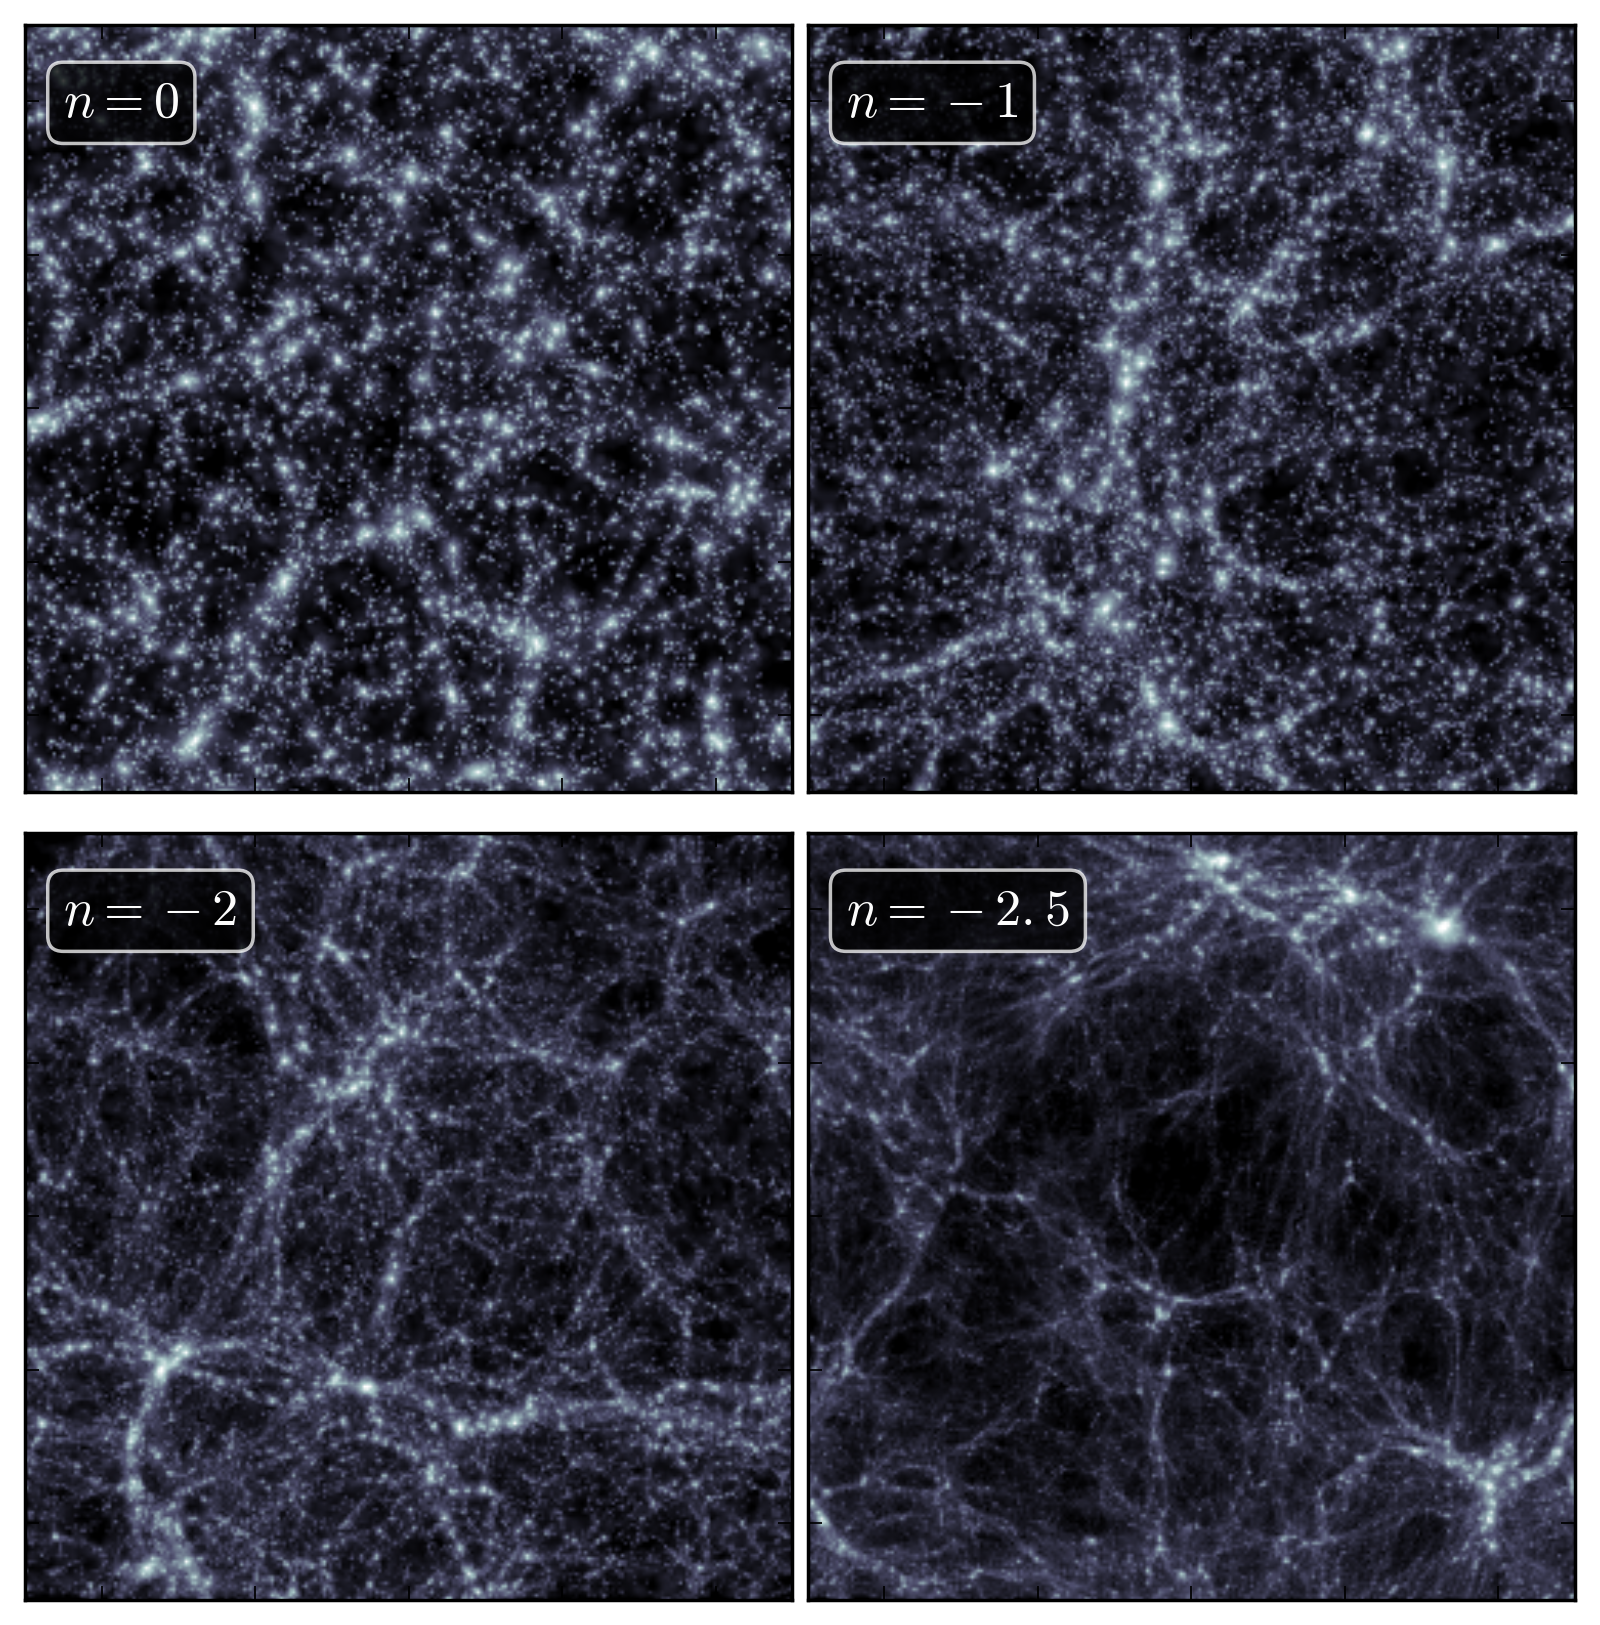
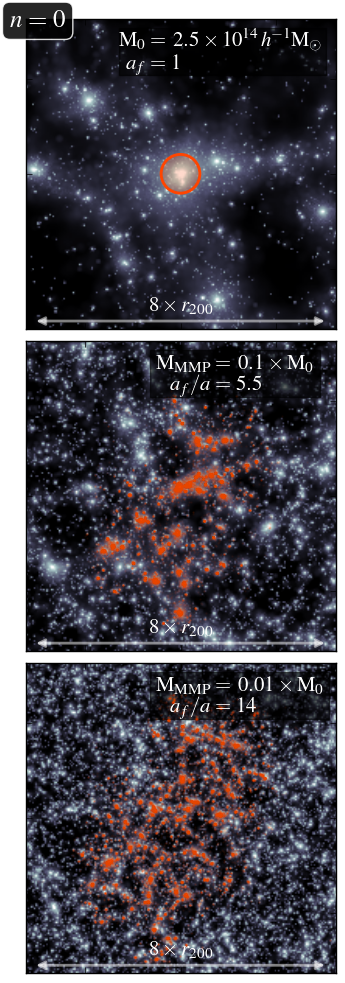
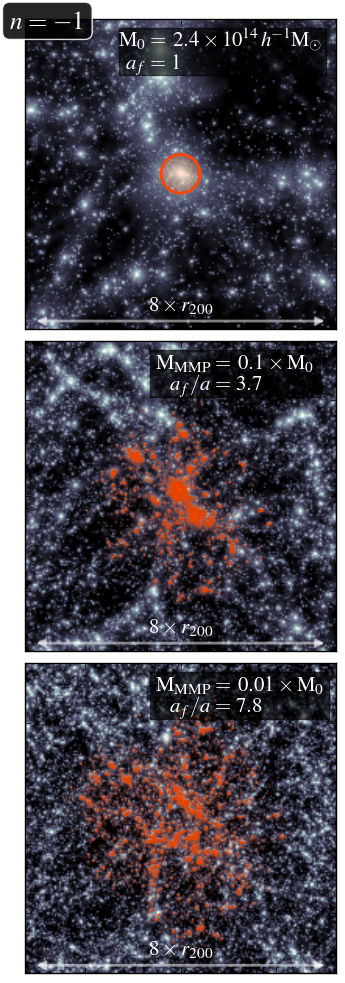
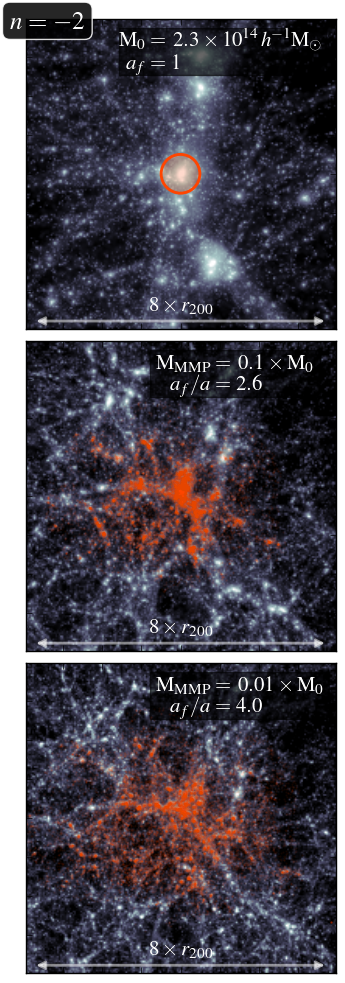
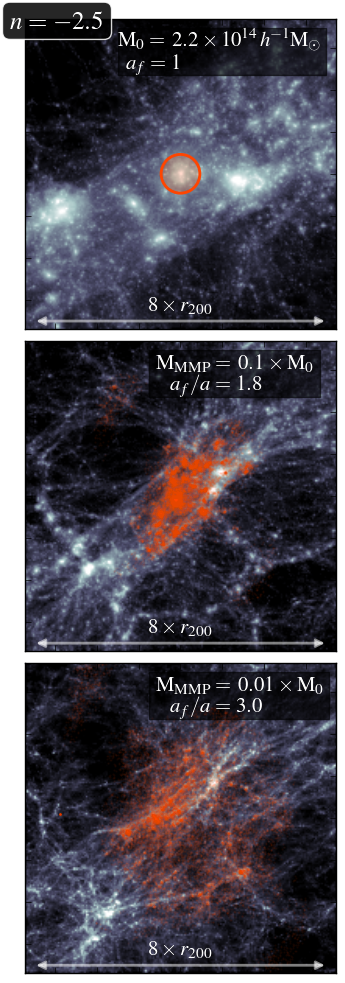
Figure 1 provides a visual impression of the DM distribution in the final output of each simulation. The run is characterized by a large number of dense clumps whose large-scale distribution is close to uniform across the box. As decreases, large scale modes have a more noticeable impact on the flow of DM and prominent features of large-scale structure emerge, such as voids, filaments and rare clusters.
2.2 Analysis
Friends-of-friends (FoF) halos and their associated substructure were identified using subfind (Springel et al., 2001) in all simulation outputs. The halo catalogs were combined into merger trees using the method described in Jiang et al. (2014), which were then used to build MAHs by tracking each halo’s main progenitor back through previous simulation outputs. We also compute the “collapsed mass history” (CMH), defined as the total mass of progenitors larger than times the present-day mass, . In addition to MAHs and CMHs, we compute two equilibrium diagnostics: 1) the center-of-mass offset, , defined as the distance between the halo’s center-of-mass and most-bound particle, and 2) the substructure mass fraction‡‡‡When computing we only consider subhalos whose masses are at least 1% of their host’s virial mass. Our limit of particles thus ensures that the lowest mass subhalos contributing to are resolved with 500 particles., . In the remainder of the paper we will only consider “relaxed” halos, defined as those that satisfy both and , and impose a minimum particle number of .
We construct the spherically-averaged density profiles for these halos in 50 equally-spaced steps in spanning the range to 0.176 (). These profiles are then fit with eq. 1 in order to determine the best-fit values of and . Fits are restricted to the radial range , where is the larger of or . Best-fit models are obtained by simultaneously adjusting the three parameters of eq. 1 in order to minimize a figure-of-merit function, defined
| (2) |
We obtain best-fit parameters for individual halos, as well as for median profiles in logarithmically-spaced bins of .
3 Mass Accretion Histories
As mentioned above, the rate of clustering in self-similar models depends sensitively on . This can be readily seen in Figure 2, where we plot the growth history of a massive cluster in each model. From left to right, columns correspond to , , and , respectively; rows to the final simulation output (top), and to those at which the halo’s main progenitor first reached 10% (middle) and 1% (bottom) of its final mass In all cases the halo is resolved at the final time by particles within , which is marked with an orange circle in the upper panels; all particles within at are highlighted using orange points in other panels.
Halos in different models form differently, and occupy distinct large-scale environments at the simulation’s end point. For , large quantities of DM have assembled into high-density clumps at very early times and structures form leisurely, through the slow merging of many lower mass halos. As decreases the well-structured pattern of progenitors loosens and the main clump forms rapidly by aggregating a number of lower-mass progenitors and diffuse material.
Figure 3 shows these results quantitatively. Here we plot the median MAHs and CMHs of relaxed halos that lie in a narrow range of peak height (), separating models of different spectral index into different panels. Note that we have used the critical density, , as the time variable rather than expansion factor or redshift, and have normalized masses and densities to their present-day values, and , respectively. For clarity, results at specific redshifts are shown as thin lines, and their average as a thick curve. Whether judged by the MAH or CMH, halos in cosmologies with larger collapse earlier, explaining why, e.g., Knollmann et al. (2008), report systematically higher concentrations for such systems.
The CMHs betray the fact that, as decreases, diffuse accretion plays a more prominent role in halo growth. On average, when each halo’s main progenitor first reached just of its final mass, the total collapsed mass fractions were , , and for , , and , respectively. Although smaller implies larger fractions of diffuse accretion, merging remains significant in all model, though more so for larger . The shaded contours in Figure 2, for example, show the full progenitor mass functions of these halos (different levels enclose 1, 2, 5 , 10 and 25 progenitors).
Like the CMHs, the median MAHs are approximately self-similar, but their shapes depend strongly on the spectral index, . As expected from Figure 2, halos in the model grow rapidly, increasing their virial mass by a factor of over just a factor of in expansion history. This is roughly an order of magnitude less than what is required for halos the model to grow by the same amount.
Intriguingly, the halo MAHs in the and models are similar to those of CDM halos. This is not unexpected: the local slope of the CDM power spectrum roughly spans to for halo masses ranging dwarfs to rich clusters, the mass scale over which MAHs are well-studied in CDM models. The dashed black lines in each panel, for example, show an Einasto profile (expressed here as mass-versus-enclosed density) with the same characteristic “formation time”, , as the scale free MAHs. This timescale marks the point at which the main progneitor’s virial mass was first equal to the mass enclosed by its present-day scale radius, (highlighted as an outsized point in each panel). This single point can be used to accurately predict the MAHs of CDM (see Ludlow et al., 2013; Ludlow et al., 2016, for a full discussion). Note, however, that the slow growth of halos in the and models yeild quite distinct MAHs from those expected for CDM. In particular, they are substantially less curved. Do the diversity of MAHs in scale-free models leave a residual imprint on their density profiles?

4 Density Profiles
The left panel of Figure 4 shows the median spherically-averaged density profiles for the same halos whose MAHs were plotted in Figure 3. To aid the comparison all profiles are normalized by their characteristic values of density, , and radius, , and weighted by a factor of to enhance dynamic range. As above, results from our four simulations are shown in separate panels, using different colors. Within each panel thin lines (barely distinguishable here) correspond to different redshifts. Their median is shown using symbols.
For comparison, we also plot an NFW profile in each panel using a thick grey line. This curve matches the simulated profiles reasonably well, even for the white noise model. Nonetheless, important differences are also clear. Dashed lines, for example, show an Einasto profile whose was chosen to match that of the simulated halos. For a given (and ) the density profiles are clearly self-similar, regardless of . The residuals (lower sub-panels), for example, have been computed with respect to these Einasto profiles and are not deviations from individual best-fit models. The deviations are not systematic and, at most radii, remain smaller than 5%.
More importantly, the halo density profiles are not self-similar across different simulations, even when is held fixed. Instead, varies from for to for . These differences are emphasized in the upper-right panel of Figure 4, where we plot the maximum asymptotic power-law slope, , compatible with the inferred mass profiles (for clarity, we have only included the and runs in this panel). Clearly, an Einasto profile with a single value of cannot fit for all models simultaneously.
In the lower right-hand panel we show that the power spectrum-dependence of extends to all values of . Here we plot the best-fit relation obtained for individual halos after combining all redshifts (shaded regions indicate the error on the median values). As with other panels, different colors and symbols correspond to the different simulations. At all overlapping , the shapes of CDM halo density profiles depend systematically on the power spectral index, .


For comparison, the heavy black line in Figure 4 shows the relation obtained by (Gao et al., 2008, see also Dutton & Macciò, 2014) from the Millennium simulation (Springel et al., 2005). This curve matches the results for our and models fairly well, but becomes progressively worse as increases. In particular, halos in our and models have, on average, less curved mass profiles than those of CDM halos of similar , which was precisely the case for their MAHs plotted in Figure 3.
5 Discussion and Conclusions
Overall, our results imply that the spherically-averaged density profiles of DM haloes are not universal but depend systematically on the shape of the DM power spectrum. Haloes that grow slowly through the merger and accretion of many small, dense clumps have steeper, more centrally concentrated density profiles with extended outer envelopes. Those that form rapidly, through a combination of diffuse accretion and loosely-bound mergers, have shallower inner profiles and steep outer ones. These results broadly agree with the qualitative interpretation put forth by Cen (2014, see also Nipoti 2015) for the origin of Einasto-like density profiles.
The results also support the claim of Ludlow et al. (2013), who suggested that the curvature of the MAH is what determines . These authors showed that halos whose MAHs curve more rapidly than average tend to have more sharply curving density profiles, and vice versa. Rapid growth implies rapid merging (see Figure 3), which has also been shown to enhance the curvature of halo mass profiles (Angulo et al., 2016).
Our results, however, disgree with prior work on halo structure in scale-free cosmologies. Knollmann et al. (2008) found that halo mass profiles are insensitive to differences in the fluctuation power spectrum. Although they reported a positive correlation between the power spectral index, , and the innermost asymptotic slope of , they attributed it to the large range of halo concentrations spanned in models of widely different , which lead to difficulties robustly estimating .
We hope our results will motivate future studies that seek to build a holistic model for halo structure that connects all relevant structural parameters to the detailed and unique assembly histories of DM halos. Given the complexities involved such a model is unlikely to be simple, but is within reach of current simulations of halo formation.
acknowledgments
We thank Alejandro Benítez-Llambay for visualization software (https://github.com/alejandrobll/py-sphviewer). ADL is supported by a COFUND Junior Research Fellowship; REA by AYA2015-66211-C2-2. This work used the COSMA Data Centric system at Durham University, operated by the Institute for Computational Cosmology on behalf of the STFC DiRAC HPC Facility (www.dirac.ac.uk). This equipment was funded by a BIS National E-infrastructure capital grant ST/K00042X/1, DiRAC Operations grant ST/K003267/1 and Durham University. DiRAC is part of the National E-Infrastructure.
References
- Angulo et al. (2016) Angulo R. E., Hahn O., Ludlow A., Bonoli S., 2016, ArXiv e-prints
- Cen (2014) Cen R., 2014, ApJL, 790, L24
- Diemer & Kravtsov (2015) Diemer B., Kravtsov A. V., 2015, ApJ, 799, 108
- Dutton & Macciò (2014) Dutton A. A., Macciò A. V., 2014, MNRAS, 441, 3359
- Einasto (1965) Einasto J., 1965, Trudy Inst. Astroï¬Âz. Alma-Ata, 51, 87
- Gao et al. (2008) Gao L., Navarro J. F., Cole S., Frenk C. S., White S. D. M., Springel V., Jenkins A., Neto A. F., 2008, MNRAS, 387, 536
- Jenkins (2013) Jenkins A., 2013, MNRAS, 434, 2094
- Jiang et al. (2014) Jiang L., Helly J. C., Cole S., Frenk C. S., 2014, MNRAS, 440, 2115
- Knollmann et al. (2008) Knollmann S. R., Power C., Knebe A., 2008, MNRAS, 385, 545
- Ludlow et al. (2016) Ludlow A. D., Bose S., Angulo R. E., Wang L., Hellwing W. A., Navarro J. F., Cole S., Frenk C. S., 2016, MNRAS, 460, 1214
- Ludlow et al. (2013) Ludlow A. D., Navarro J. F., Boylan-Kolchin M., Bett P. E., Angulo R. E., Li M., White S. D. M., Frenk C., Springel V., 2013, MNRAS, 432, 1103
- Macciò et al. (2008) Macciò A. V., Dutton A. A., van den Bosch F. C., 2008, MNRAS, 391, 1940
- Navarro et al. (1997) Navarro J. F., Frenk C. S., White S. D. M., 1997, ApJ, 490, 493
- Nipoti (2015) Nipoti C., 2015, ApJL, 805, L16
- Springel (2005) Springel V., 2005, MNRAS, 364, 1105
- Springel et al. (2005) Springel V., White S. D. M., Jenkins A., Frenk C. S., Yoshida N., Gao L., Navarro J., Thacker R., Croton D., Helly J., Peacock J. A., Cole S., Thomas P., Couchman H., Evrard A., Colberg J., Pearce F., 2005, Nature, 435, 629
- Springel et al. (2001) Springel V., White S. D. M., Tormen G., Kauffmann G., 2001, MNRAS, 328, 726