DC Magnetization study of Ni1-xRhx nanoalloy
Abstract
Ni1-xRhx bulk alloys exhibit a ferromagnetic to paramagnetic quantum phase transition (QPT) at the critical concentration 0.37. A spin glass phase arises below the Ferromagnetism by controlling the short range interaction between Ni and Rh atoms. we have synthesized nanoalloys of two different concentrations with two different reaction times by chemical reflux method. From the dc magnetization measurements, existence of ferromagnetism and spin glass phase in these nanoalloys is confirmed. A step like feature in both ZFC and FC curve at certain temperature indicates the existence of the spin glass phase.
pacs:
75.75.-c, 64.70.Tg, 75.30.KzI Introduction
A quantum phase transition (QPT), a continuous order disorder transition at zero temperature, is driven by quantum fluctuations. A ferromagnetic to paramagnetic QPT in the Ni can be archived by adding different non magnetic impurities like Pd,Nicklas99 V, Schroeder10 Pt Ododo77 and Rh Muellner . Out of all these systems the Ni1-xRhx is the system in which the magnetic phase transition is quite complicated. The Ni1-xRhx system exhibit a QPT from ferromagnetic to paramagnetic below a critical composition of 0.626, Carnegie93 ; Muellner ; Krishnamurthy94 The onset of ferromagnetism in these systems are spin glass ordering. In Ni1-xRhx below the percolation threshold of the ferromagnetism a spin glass phase appears due to the interaction between the polarizing spin clusters which form at the Ni rich region.Carnegie93 Bulk Ni1-xRhx alloy show short range ordering which means Ni atom is preferred to be surrounded by Rh atoms however in case of homogenous Ni1-xRhx alloy, the system becomes more random. So the no of Ni nearest neighbor to a Ni given atom increases, giving rise to an increase in Ni clusters. The interaction between such clusters move forward the system from paramagnetic to spin glass type below critical concentration of ferromagnetic order. The heat capacity and the magnetic susceptibility show anomalous behavior at the critical concentration in low temperature region. Materials at nanoscale are known to possess properties different from their bulk counterparts. Specifically studying the magnetic QPT of the above well studied bulk alloy in the nanoscale is very much complicated since the nanosystem itself inherited by multitude of magnetic phases, viz. paramagnetic, superparamagnetic, blocked ferromagnetic. So It is quite enthralling,to investigate the QPT in Ni1-xRhx nanoallys. The synthesis and the catalytic property of Ni1-xRhx nanoalloys were studied previously. Recently lots of studies on Ni1-xRhx nanoalloys and graphene supported nanoalloys are going on due to its high use as catalyst in hydrogen storage Bingquan ; Junfeng ; Wang and hydrogen generation. Changming ; Pingping ; Zhujun However any type report addressing to the magnetic study or possibility of composition driven magnetic QPT in Ni1-xRhx nanoalloys has not been discussed as the best of our knowledge. This leaves us an opportunity to study the magnetism and composition driven QPT in this nanoalloy. In this work, we have desired to study the magnetism of Ni1-xRhx nanoallys and the effects of the reaction time on the magnetism of the nanoalloys. We synthesize nanoparticles of Ni1-xRhx alloys above and below the bulk critical concentration, with keeping an aim of achieving good crystallinity and single phased chemically with two different reaction times. We then examined the size and crystallinity of the nanopaticles by microscopic and spectroscopic techniques. A further study on the magnetization on the nanoalloys was also carried out to get the idea about the different magnetic properties of the nanoalloys.
II Experimental section
II.1 synthesis
For synthesizing Ni, Rh, and Ni1-xRhx alloy nanoparticles a chemical reflux apparatus was employed using Rhodium(III) chloride monohydrate (RhCl3O), Nickel(II) chloride (NiCl2) as metal precursor and hydrazine hydrate as reducing agent in the presence of surfactant diethanolamine. The method was very similar to that reported by P.swain et. al swain15 only some conditions are different. For a typical procedure, for pure Rh or pure Ni 0.5 mmol of RhCl3O or (NiCl2) was taken in a 100 mL round bottom flask containing 20 mL distill water and dissolved completely. For Ni1-xRhx alloy nanoparticles synthesis an appropriate ratio of both metal precursors were added subsequently. In this step the and ions were generated. To the above mixed solution, 5 ml of diethanolamine was added as surfactant followed by 9 mL of hydrazine hydrate as reducing agent.In the last reaction step, 30 ml distilled water was added to this.We have prepared two sets of such solutions. The two sets were refluxed at 110 ∘C one for 6 hours and other set for 25 hours. Finally, the prepared Ni1-xRhx alloy nanoparticles were separated by centrifugation, washed with district water several times and dried under vacuum for 48 hours. We denoted the prepared samples as N6 and N25 with 6 h, 25 h reaction time respectively. In this nomenclature, N stands for nanoparticles and the first numeric is for reaction time in hours.In both the cases only refluxing time was different whiles all other conditions were kept same.
II.2 characterization
Scanning electron microscope (SEM) by a Merlin ZEISS scanning electron microscope and transmission electron microscope measurement by a JEOL JEM-2100 high resolution transmission electron microscope operated at 200 kV were carried out on the Ni1-xRhx nanoalloy for the morphological and microscopical study of the nanoalloys. For the HRTEM sample preparation, nanoalloys were dispersed in acetone with 1 hour sonication. One drop of the suspension solution was then placed on a piece of carbon-coated copper grid. For SEM the pre sonicated solution was dropped on small piece of aluminium sheet. Energy-dispersive X-ray analysis (EDAX) was performed using a JEOL scanning electron microscope for determining the compositions of synthesized alloys. The X-ray diffraction (XRD) analysis were performed on a Philips X-Pert MRD X-ray diffractometer with Cu Kα radiation to confirm the structure and the phase.X-ray photoelectron spectroscopy (XPS), using a PHI5000 Versaprobe system, was also performed to further verify the stoichiometries of the samples. Highly Monochromatic focussed radiation from an Al- source( = 1486.6 eV) X-ray source was used for excitation. The pressure of the analyzer chamber was maintained in the range of 1 during the measurement. The binding energy scale was charge referenced to C 1s at 284.5 eV. High-resolution XPS spectra were acquired at 58.7 eV analyzer pass energy in steps of 0.125 eV.
II.3 Result and discussion
| 6 | 0.30 | 0.27 0.02 |
|---|---|---|
| 6 | 0.65 | 0.64 0.02 |
| 25 | 0.30 | 0.269 0.02 |
| 25 | 0.65 | 0.64 0.02 |
II.4 EDAX
Table 1 show the value of Rh concentration taken during the synthesis () and the Rh concentration obtained from the EDAX Quantification for the two different reaction times. From the table we confirm that the values we got from EDAX is very close to the values taken during synthesis. The error 2 is taken as described by Scott and Love.Scott1994
II.5 SEM and HRTEM
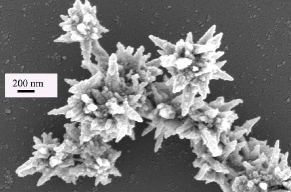
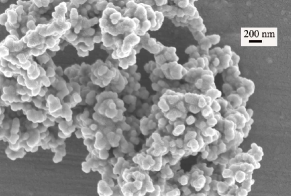
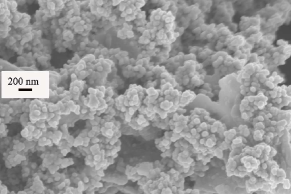
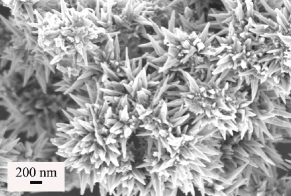
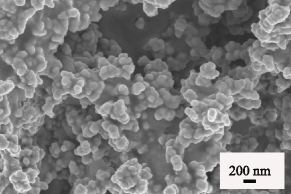
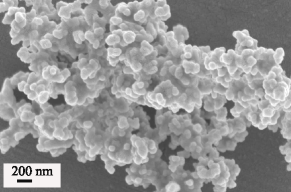
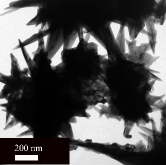
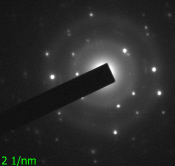
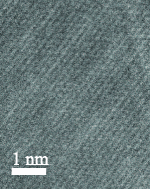
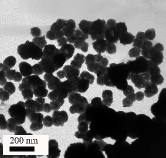
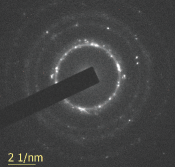
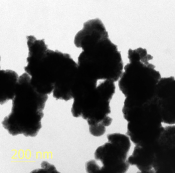
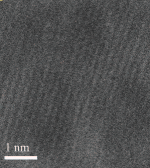
Figure 1 shows the SEM images of pure Ni and Ni1-xRhx alloy samples. In all the case we observe the agglomeration of the nanoparticles which has taken place by putting the drop on the aluminium sheet during the preparation of nanoparticles for SEM. Except from Pure Ni all other Ni1-xRhx show formation of spherical nanoparticles with 30-40 nm. In case of pure Ni, for the two samples a flower type pattern is observed. By a careful observation we found out that in both the samples very small, spherical nanoparticles of 30 -40 nm agglomerated to form a flowery pattern. For more detailed investigation the particle size as well as shape of the samples were characterized using HRTEM. out of all the samples we have selectively chosen three samples for HRTEM study. Fig. 2 shows the HRTEM micrographs and the corresponding SAED patterns of the Ni1-xRhx nanoparticles. From the HRTEM images agglomeration of the nanopaticles is clearly observed. Nanoalloys agglomerate in to bigger spherical bunch. This may be due to the highly magnetic interaction between the nanoparticles.ABC The appearance of bright spots and concentric rings in each SAED pattern show the solid evidence of crystalline nature of the synthesized nanoalloys.
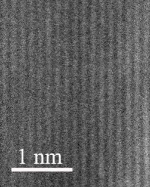
Fig. 2, 2, 2 show the lattice fringes of Pure Ni that means x = 0 of N 6, N 25 and Ni0.73Rh0.27 of N6 nanoparticles respectively. All the three samples exhibit straight edges and clear lattice fringes. The average inner plane distances (d-spacing) for adjacent fringes for pure x = 0 of N 6 and N 25 nanoparticle were found to be 1.74 and 2.1 . For former average inner plane distances (d-spacing) for adjacent fringes is significantly close to fcc Ni (200) and for latter, it is close fcc Ni (111) calculated from the XRD pattern of both the samples by PCW. In case of Ni0.73Rh0.27, the average inner plane distances (d-spacing) for adjacent fringes was measured to be 2.2 , which coincides with the lattice spacing d of the (111) planes of Ni0.73Rh0.27 determined from the XRD by PCW. From this it is confirmed that the synthesized nanoparticles are completely in alloy form.

II.6 XRD
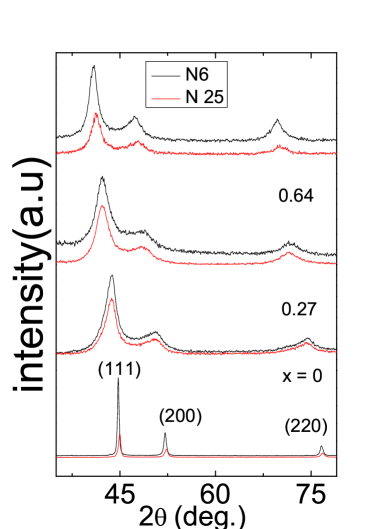

Figure3 shows typical XRD spectra of all the synthesized pure Ni and Ni1-xRhx alloy nanoparticles. For the comparison the XRD pattern of pure Rh nanoparticles prepared in the same manner are also included in the figure. In the XRD spectrum of pure Ni and pure Rh three sharp strong reflection peaks at values of , , and , and , and appears respectively. According to JCPDS-ICDD powder diffraction database these peaks are correspond to the (111), (200), and (220) planes of the fcc crystallographic structure of Ni and Rh respectively.However the X-ray diffraction peaks of the Ni1-xRhx nanoalloys matches the (111), (200), and (220) characteristics peaks of a Rh fcc structure but slightly shifted to higher values. There were also no observable lines in the XRD spectra corresponding to those of pure Rh or Pure Ni. If the homogeneous solid solution of Rh-Ni was not formed, then the peaks of pure Rh or Pure Ni would have observed in the Spectra. The absence of the Pure Ni and Pure Rh peaks in the XRD patterns of all the alloy nanoparticles suggests a complete alloying of Ni and Rh for all x values under study. The shift in in curve a corresponds to a increase in the lattice constant due to the incorporation of Rh atoms in the Ni. Further, Fig. 3 shows the variation of lattice constants determined from all XRD patterns with x. The lattice parameter increases with increase of the Rh concentration is same as in case of bulk Ni1-xRhx alloy. Nash From the fig. it is confirmed that nanoalloys of this also obey Vegard’s law.
II.7 XPS

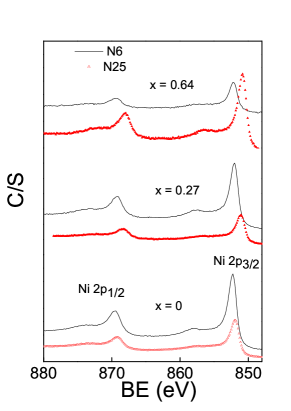
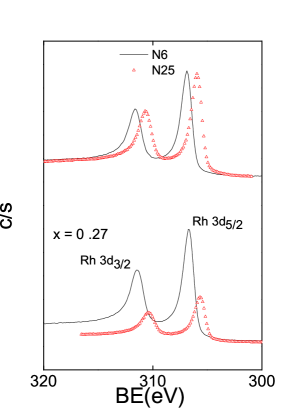
The metallic Ni1-xRhx alloy nanoparticle were also studied by X-ray photoelectron spectroscopy (XPS). The survey scans of XPS spectra for Ni1-xRhx alloy displayed in figure4 show pronounced peaks Rh and Ni. The c 1s peak which appears at 284.5 ev and O 1s at 531.0 ev are absent for N6 samples. However for N 25 samples the c 1s and O 1s are present. The intensity and height of the peaks are negligible which appears due to the unavoidable hydrocarbon and oxygen in the atmosphere. In order to find the alloying and the different oxidation states of Rh and Ni, the nanoalloys were examined by high-resolution XPS in narrow range of Rh 3d peaks and Ni 2p peaks regions in more detail. Figure 4 and figure 4shows the high-resolution XPS spectra for all samples in the Ni 2p region and Rh 3d region respectably. In case of N 25 samples one would expect the presence of oxygen peak may contribute for the formation of oxides. One would expect a peak between at 853.7, 855.6 eV and 308.5 eV if the sample contains any NiO or or This gives a further confirmation of synthesized samples are oxide free. It is to be noted that in case of bulk metallic Ni, the Ni appears at 852.7 eV, we observe a binding energy shift of about +0.36 eV and +0.2 eV in pure Ni N6 and N 25 respectively with respect to bulk however such shifts are expected in nanoparticles. Liu2009 . The Ni 2p peaks of the alloys shifts towards lower binding energy with the increase of Rh concentration. In case Rh 3d peaks, the peaks are shifted towards higher binding energy with the increase of Rh concentration. This is because between Ni and Rh, Rh is the more electronegative so upon alloying with Ni, a charge transfer from the Ni site to the Rh site is expected. So the Binding energy of Ni is shifted toward lower side and Rh towards the higher sides.
II.8 Magnetization
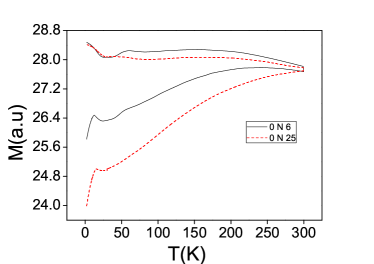
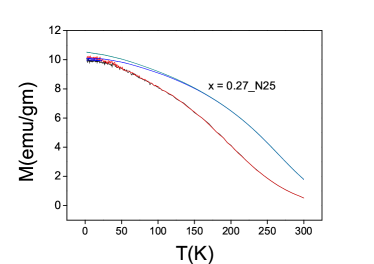
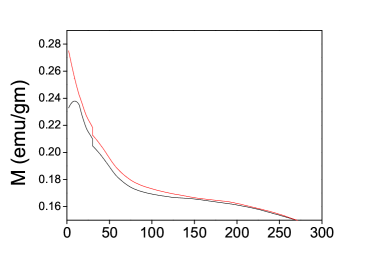
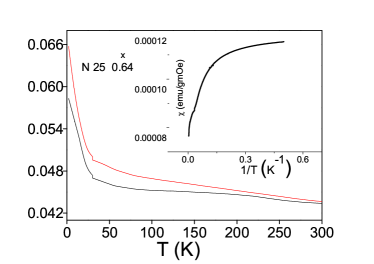
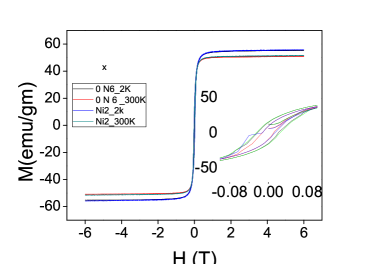
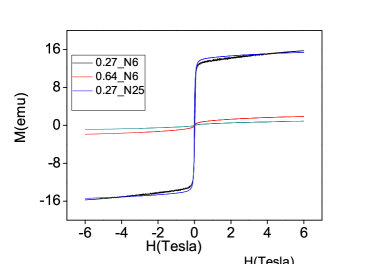
Figure 5 represents the variation of magnetization with temperature, measured under an applied field of 500 Oe in the standard zero-field-cooled (ZFC) and field-cooled (FC) protocols. We will discuss the ZFC -FC magnetization study of each synthesized concentration separately one by one.
For Pure Ni nanpparticle the ZFC and FC curves show some interesting features worth mentioning: The ZFC and FC curves show some interesting features worth mentioning:(1)The irreversibility in the ZFC and FC curves present through the whole measuring temperature range in both N6 and N 25 samples. (2) Taking in the consideration of the ZFC curve in both the samples show quiet similar type of behavior. We observe two peaks one sharp and strong peak in low temperature region and another broad peak in the higher temperature region. The only difference in the samples is the lower temperature peak, which is very intense in sample N6 in comparison to sample N25. In sample N6 going down from 300 K in the temperature axis the magnetization first increases followed by a broad peak at around 241 K then decreases up to 22 K and then increases showing a sharp peak at 12 K and finally decreases down to low temperature. In case of sample N25 similar behavior is observed however the high temperature peak is more broad than N 6 sample and the low temperature peak appears at 14 K. Here we try to explain the above features one by one. The peak in ZFC and irreversibility between ZFC and Fc curve are the characteristic features of SPM nanoparticles. Bedanta 2009 In order to understand the existence of two peaks in the ZFC curve in both the samples, we propose that the sample is consisting of two types of particles the small particles present at the surface and bigger larger particles inside. The big ones have SPM behavior and show a blocking temperature in the higher temperature side and the smaller particle have a blocking temperature at very low 15 K. chen 2005 The broadening in the peak is due the agglomerations. In sample N 25 the size of particles is more than sample N 6 as confirmed from SEM images, due to why the is more broaden in former one. we can also say that the size distribution of the bigger SPM nanoparticles are large in comparison to the small surface particles. Now we will discuss features in the FC curve in the two samples. In Sample N6 by magnetization value increases with the decrease of temperature from the 300 K up to 60 K then increases followed by a maxima in the FC at 57 K. Below 57 K the magnetization decreases showing a dip or minima at 32 K and by further decrease of temperature Magnetization increases without saturating. The monotonic increase of magnetization in FC below with the temperature is the one of the key feature of SPM nanoparticles. However in sample N6 the increase of Magnetization with T up to 60 k show little bit flat this is due to inter particle inter action present in the between SPM nanoparticles. Due to the interaction between the SPM nanoparticles the nanopaticles freezes at low temperatures which is appeared as a hump in FC curve at 57 K corresponding to the glass temperature of the system below which the system shows a glassy behavior. Suzuki 2009 However minimum in Magnetization upon cooling is only observed in super spin glass system (SSG). Bedanta 2009 ; Sasaki 2005 ; Petracic 2006 Well established evidences of presence of a superspin glass (SSG) below a well-defined glass temperature, in various systems has been studied.Djurberg ; Jonsson ; Petracic The decrease in the magnetization below 57 K is due to the collective frizzing of the spins. Suzuki 2009 ; Khurshid 2015 Sample N 25 show similar type of behavior only the hump which is referred as the spin glass temperature and the minima in the FC upon cooling which is characteristics feature of SSG system is less intense. From this argument we can state that in both the samples, the SSG behavior is observed. But now the question arises what is the cause of SSG type of behavior in our system. The glassy behavior in the nano systems are due to the inter particle interaction, anisotropy and the surface effect. SSG system is nothing but analogous to spin glass state to the bulk. The only thing SSG is the collective freezing of interacting spins in the nanosystem. In our case the SSG phase arises due to the high inter particle interaction between the SPM nanoparticles also observed in SEM and HRTEM images and the interaction between the small surface particles and larger SPM particles which cause a collective frizzing of spin at low temperature. In Ni0.73Rh alloy of N6 and N25 FC and ZFC show similar behavior with Temperature. However in former ZFC and FC are identical and coincides but in latter the ZFC and FC bifurcates from 200 K. The variation of Magnetization in both the samples show a typical ferromagnetic type behavior with a high transition temperature. In Ni0.36Rh of N6 FC and the ZFC curves stat splitting from room temperature and the ZFC exhibiting a maximum near 9.1 K which is the so called blocking temperature() of the single domain particles characterized by superparamegnetism region above it and a blocked ferro region below it. The ZFC and FC curve does not show any overlapping up to 300 K which means the largest particle blocked at 300 K, the highest temperature limit of our study. Below Magnetization value for the FC increases monotonically with the decrease of temperature which is the significant property of non interacting, single domain particles. However for N25 (x = 0.64), a strong increase of magnetization with the decrease of temperature is observed which indicates that it becomes more paramagnetic than N6 sample. Furthermore, the M-T curve shows a irreversible ZFC/FC cycle, with the sharp upward curve also indicative of paramagnetism. However the deviation from the straight line behavior of susceptibility with inverse temperature shown in figure inset of 5 confirms that the sample is not purely paramagnetic. A ferromagnetic interaction is present along with the paramagnetism. By a careful observation, we found there is a shoulder like feature appeared at 30 K in both ZFC and FC for both N6 and N 25 samples. We named the temperature as , the spin glass temperature, which is more pronounced in N25 than the other one. We will try to understand the magnetism of the origin of spin glass in the alloys. Normally the spin glass is observed in a system due to random magnetic interactions and frustration of spin. The magnetism in case of Ni1-xRhx alloy is due to interacting localized cluster moments similar to that of their bulk. When we doped Ni with Rh, the Rh took the random lattice position so the exchange interaction between the Ni atoms breaks down but some places have Ni clusters, giving rise to the ferromagnetism. By further increasing the Rh concentration the no of Ni atom nearest neighbor to a given Ni atom decreases which given rise to the decrease in moment. Like the bulk here also we observe spin glass phase below the ferromagnetic phase. For bulk, the alloy show a short range interaction due to which Ni prefers being surrounded by Rh atoms. The spin glass phase in bulk arising by controlling the short range interaction by making the system random by some cold work.Carnegie93 However in case nano, the systems are a complete homogeneous alloy of Rh and Ni without any short range interaction. The origin of spin glass phase could be due to the same phenomenon as in the bulk material i.e due to interacting localized clusters. Though we are talking about the nanosystem, however the particles size is big enough to accommodate lots of atoms. The value is very close in both N6 and N25, the values do not drastically change with the particle size but depends on the concentration, is well studied by Feltin et al .Feltin
The field dependance of magnetization has been investigated at 2 K and 300 K for all the samples and shown in figure 6. In case of pure Ni in all the temperature values the M-H curve exhibit S type shape with reasonable coercive field () and remnant magnetization (). This is a characteristic feature of a spin glass system. The coercivity in the M-H loop is the indicative of existence of ferromagnetism in the system. The spontaneous magnetization value for sample N6 is greater than the sample N 25 throughout all the measured temperatures due to large size of the particle. In case of Ni1-xRhx at 2 K all the samples show coercivity and remnant magnetization however all the samples do not saturate up to the highest measuring field. The presence of hysteresis in the of M-H loop at low temperature is the indicative of ferromagnetic nature of the system. At 300 K, for x = 0.27 both the samples show remanent and coercivity because the samples are ferromagnetic in nature whose lies above from the room temperature. But for x = 0.64 both the set of samples show zero remanent and coercivity confirming the samples are SPM. In case of x = 0.64 N6, at 300 K the sample is SPM which confirmed from the ZFC-FC with the presence of a blocking temperature. However for N 25, which is paramagnetic as observed from ZFC - FC due to presence of clusters of Ni, we get superparamagnetic nature in the M-H. We observe that the samples don’t saturate even at low temp and in high field and a hysteresis is appeared at low field and low temperature. Both, the appearance of hysteresis loop at low temperatures and low field-regions and non existence of saturation at low temperature in the high field are the characteristic features of spin-glass (SG) Liang , Du phase with possibly coexisting ferromagnetic clusters. This gives the clear evidence of existence of Ni clusters in the samples whose interaction gives rise to a spin glass state.
III Conclusion
In this paper we reported and analyzed the DC magnetization study of the Ni1-xRhx nanoalloys of mean diameters 50 - 60 prepared by a chemical reflux method with two different reaction times. The concentration of the samples were obtained from EDAX measurement. The morphology and the size of the particles were determined from SEM studies. The crystallinity and Phase were checked from XRD, HRTEM images and SAED patterns. The chemical states were confirmed from the XPS studies. From the analysis of temperature dependence of magnetization for x 0.27, ferromagnetism in both the samples are observed. For x 0.64, a spin glass phase appeared in both the samples, exhibit a shoulder like feature in M-T curve. The origin of spin glass phase is same as that of bulk, due to interaction between Ni clusters formed due to atomic clustering. However incase of the nanoalloys the short range interaction is absent unlike the bulk.
ACKNOWLEDGEMENTS
P. Swain acknowledges the financial support from the Council of Scientific and Industrial Research (CSIR), New Delhi.
References
- (1) M. Nicklas, M. Brando, G. Knebel, F. Mayr, W. Trinkl, and A. Loidl, Phys. Rev. Lett. 82, 4268 (1999).
- (2) S. Ubaid-Kassis, T. Vojta, and A. Schroeder, Phys. Rev. Lett. 104, 066402 (2010).
- (3) J. C. Ododo, and B. R. Coles, J. Phys. F: Metal Phys. 7, 11 (1977).
- (4) W. C. Muellner and J. S. Kouvel, Phys. Rev. B 11, 4552 (1975).
- (5) D. W. Carnegie, Jr. and H. Claus, Phys. Rev. B 30, 1 (1993).
- (6) V. V. Krishnamurthy, S. N. Mishra, M. R. Press, P. L. Paulose, S. H. Devare, and H. G. Devare, Phys. Rev. B 49, 10 (1994).
- (7) Bingquan Xia, Chang Liu, Han Wu, Wei Luo, and Gongzhen Cheng, international journal o f hydrogen energy 40, 16391-16397 (2015).
- (8) Junfeng Shen, Nan Caoa, Yang Liuc, Man He, Kai Hua,Wei Luo, and Gongzhen Cheng, Catalysis Communications 59, 14 20 (2015).
- (9) Jun Wang, Xin-Bo Zhang, Zhong-Li Wang, Li-Min Wang, and Yu Zhang, Energy Environ. Sci. 5, 6885 (2012).
- (10) Changming Li, Yibo Dou, Jie Liu, Yudi Chen, Shan He, Min Wei, David G. Evans and Xue Duan, Chem. Commun.49, 9992 (2013).
- (11) Pingping Zhao, Nan Cao, Wei Luo, and Gongzhen Cheng, J. Mater. Chem. A 3, 12468 (2015).
- (12) Zhujun Zhang, Zhang-Hui Lu, Hongliang Tan, Xiangshu Chen, and Qilu Yao J. Mater. Chem. A 3, 23520 (2015).
- (13) P. Swain, Suneel K. Srivastava, and Sanjeev K. Srivastava, Phys. Rev. B 91, 045401 (2015).
- (14) V. D. Scott, and G. Love, Quantitative Electron Probe Microanalysis, 2nd ed., Ellis Horwood, Chichester, (1994).
- (15) D. V. S. Rao, K. Muraleedharan, and C. J. Humphreys, at http://www.formatex.info/microscopy4/1232-1244.pdf.
- (16) A. Nash and P. Nash Bulletin of Alloy Phase Diagrams 5, 405 (1984).
- (17) Fen Liu, Zhijuan Zhao, Limei Qiu, Liangzhong Zhao Journal of Surface Analysis 15, 271-273 (2009).
- (18) Subhankar Bedanta and Wolfgang Kleemann J. Phys. D: Appl. Phys. 42,013001 (2009).
- (19) Xi Chen, S. Bedanta O. Petracic, W. Kleemann, S. Sahoo, S.Cardoso,and P. P. Freitas PHYSICAL REVIEW B 72, 214436 (2005)
- (20) M. Sasaki, P. E. J onsson and H. Takayama Phys. Rev. B 71, 104405 (2005)
- (21) O. Petracic, X. Chen, S. Bedanta, W. Kleemann, S. Sahoo, S. Cardoso and P. P. Freitas J. Magn. Magn. Mater. 300, 192 (2006).
- (22) C. Djurberg, P. Svedlindh, P. Nordblad, M. F. Hansen, F. B dker, and S. M rup Phys. Rev. L 79, 25 (1997).
- (23) T. Jonsson, P. Svedlindh and M. F. Hansen Phys. Rev. L 81, 18 (1998).
- (24) O. Petracic, W. Kleemann, Ch. Binek, G. N. Kakazei, Yu. G. Pogorelov, J. B. Sousa, S. Cardoso and P. P. Freitas http://digitalcommons.unl.edu/physicsbinek.
- (25) Suzuki, M., Fullem, S. I., Suzuki, I. S., Wang, L. Y. and Zhong, C. J. Phys. Rev. B 79, 024418 (2009).
- (26) Hafsa Khurshid , Paula Lampen-Kelley , scar Iglesias , Javier Alonso, ManhHuong Phan , Cheng-Jun Sun, Marie-Louise Saboungi, and Hariharan Srikanth Scientific Reports 5, 15054 (2015)
- (27) N. Feltin, L. Levy, D. Ingert, E. Vincent, and M. P. Pilenia JAP 87, 1415 (2000).
- (28) Y. Q. Liang, N. L. Di, and Z. H. Cheng, Phys. Rev. B 72, 134416 (2005).
- (29) F. Du, Z. F. Huang, C. Z. Wang, X. Meng, G. Chen, Y. Chen, and S. H. Feng, J. Appl. Phys. 102, 113906 (2007).