Local environment effects in the magnetic properties and electronic structure of disordered FePt
Abstract
Local aspects of magnetism of disordered FePt are investigated by ab initio fully relativistic full potential calculations, employing the supercell approach and the coherent potential approximation (CPA). The focus is on trends of the spin and orbital magnetic moments with chemical composition and with bond lengths around the Fe and Pt atoms. A small but distinct difference between average magnetic moments obtained when using the supercells and when relying on the CPA is identified and linked to the neglect of the Madelung potential in the CPA.
I Introduction
When dealing with substitutional alloys, it is necessary to use approximations to simulate the random occupation of sites. There are several ways to achieve this. One can use supercells to include as many different local configurations as possible. Or one can use a mean field approach to simulate the disorder by a suitably chosen auxiliary effective medium. Both of these limiting approaches can be combined, as in the locally self-consistent Green function formalism. Each method has its advantages and limitations.
The mean field approach such as the single site coherent potential approximation (CPA) is computationally convenient and the random disorder itself is treated very efficiently. However, single-site methods neglect the influence of fluctuations in the local environment [1; 2]. Another problem is that the Madelung contribution to the alloy potential cannot be included within the standard CPA [3; 4]. A lot of effort was devoted to tackle this issue and important advances in this respect have been made [5; 6; 7; 8; 9; 10; 11; 12].
Theoretical investigations on the electronic structure of alloys mostly concerned topics like ordering, phase stability [13; 14] and systematic dependence of various properties on the alloy composition [15; 16; 17; 18]. Studies of local environment effects focused on charge transfer and energetics [19; 2; 20; 21; 22]. Few studies dealt also with short-range order effects on magnetic moments [23; 24]. Comparison between theory and experiment shows, nevertheless, that the CPA is often able to describe the trends of physical properties with alloy composition very well [15; 25; 17; 26; 18]. Here, we want to further investigate magnetic properties and specifically we want to focus on the relation between the local magnetic moments and local atomic environments. To get a comprehensive view, we use the supercell as well as the CPA technique. Our calculations employ the full potential and include relativistic effects such as spin-orbit coupling (SOC).
We focus on the Fe0.5Pt0.5 substitutional alloy. This system attracted considerable attention in the past. Perlov et al. [27] performed a systematic study to investigate electronic structure and magneto-optical properties of disordered FePt alloys. Kharoubi et al. [28] investigated the electronic structure, the complex Kerr angle and the magnetic moments for ordered and disordered FePt multilayers and performed a complete analysis of the strong Kerr rotation with respect to photon energy. Paudyal et al. [23] calculated the electronic structure and magnetic properties of ordered and disordered FePt, CoPt and NiPt alloys. Their main concern was a comparison between the ordered and disordered phases and the variation of the magnetic moments with alloy composition. Sun et al. [29] explored magnetic moments and magnetic circular dichroism (MCD) of ordered and disordered Fe0.5Pt0.5 films using a fully relativistic KKR code. They confirmed that the spin magnetic moment of Fe is similar for ordered and disordered films. However, the orbital magnetic moment measured with MCD is found to be larger than predicted by theory [29].
The aim of this study is to complement earlier research on FePt and other alloys by investigating local variations of the electronic and magnetic structure. Specifically, we want to focus on the effect of the chemical composition of the first coordination shell and on the effects of structural relaxations. As we are interested in local effects, we will use mostly the supercell approach.
An important part of our study will be a comparison between CPA and supercell-based calculations. On the one hand, one can view this as a check whether the choice of the supercells is representative enough for simulating substitutional disorder. On the other hand, one can view this as a check whether local environment fluctuations lead to a significant effect on aggregate properties such as average magnetic moments.
The paper is arranged as follows. We start by explaining the computational details. Then we present our results regarding the dependence of the local magnetic moments on the chemical composition of nearest neighbors. The difference between supercells and CPA results is interpreted by analyzing the effect of the Madelung potential on magnetic moments. We also discuss changes of local magnetic moments caused by variations of the bonding lengths resulting from structure relaxation. We discuss our results and summarize the conclusions in the final sections.
II Methodological framework
II.1 Crystal structures simulating the disorder
We want to study local environment and structure relaxation effects in disordered FePt, therefore we employ the supercell technique. However, such an approach can be computationally expensive and cumbersome, because a very large supercell may be needed to represent a disordered systems with sufficient accuracy. Hence one tries to make the supercells as small as possible while making sure that the distribution of atoms among the sites represents the disorder sufficiently.
The concept of a special quasirandom structure (SQS) developed by Zunger et al. [30] is motivated by efforts to generate the supercells in an efficient way. The basic idea is to create periodic structures so that they have the same pair and multi-site correlation functions as random alloys up to a certain coordination shell. The distribution of local environments created along these lines is representative for a random alloy, at least up to the first few coordination shells. In addition a weighted average should be taken over various SQS’s to smear out artificial effects of the periodicity of the supercell.
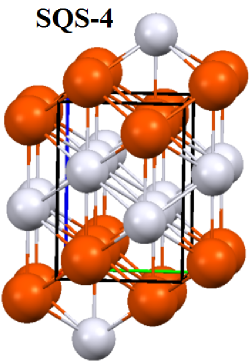
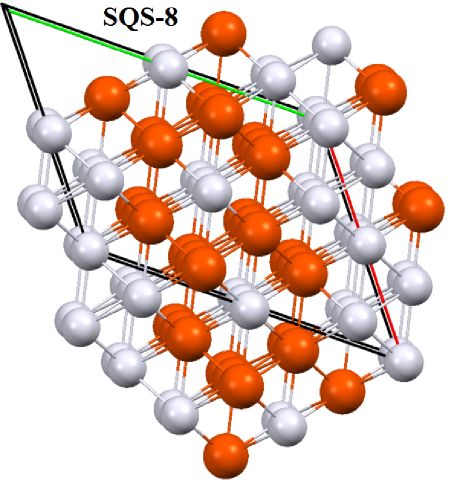
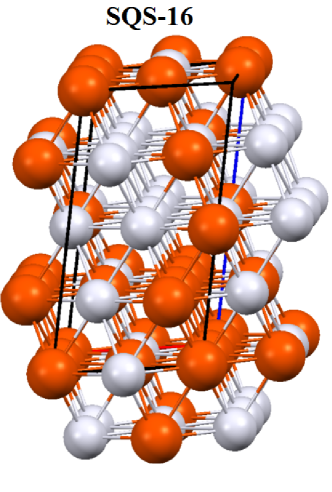
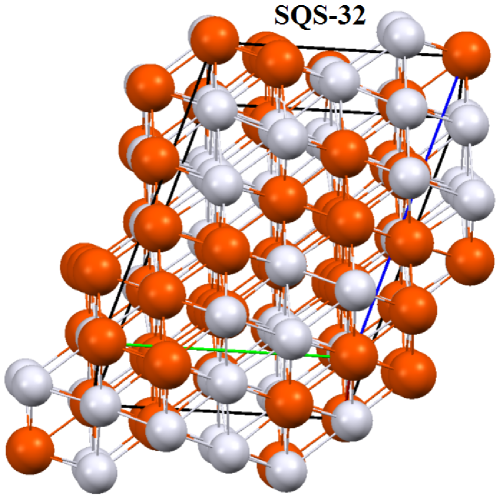
The crystal structure of FePt disordered substitutional alloy (50:50 concentration) is A1 (fcc) with a lattice constant Å [31]. We model it by SQS’s with an underlying fcc lattice, containing , 8, 16, and 32 atoms per unit cell. The crystallographic data for SQS-4 are taken from Su et al. [32], the data for SQS-8, SQS-16, and SQS-32 are taken from Shang et al. [33]. Note that the SQS-8 structure we use is equivalent to the SQS-8 structure of Lu et al. [34]. Structural diagrams for our SQS- systems are shown in figure 1.
For comparison, we performed calculations for ordered FePt as well. We considered either a model L10 structure isostructural with the A1 structure (, this could be interpreted also as the SQS-2 structure [35]), or the L10 structure corresponding to true ordered FePt system (=3.849 Å, =3.714 Å, ).
II.2 Computational details
We used two computational methods, namely, the FLAPW method as implemented in the wien2k code [36] and the fully relativistic full-potential multiple scattering KKR (Korringa Kohn-Rostoker) Green function method [37] as implemented in the sprkkr code [38]. We treated the Fe , , and Pt , , states as valence states and, accordingly, the Fe , , , and Pt , , , , , , , , , , states as core states.
For the wien2k calculations, the crystal is divided into non overlapping muffin-tin (MT) spheres and the interstitial region between them. The wave function inside a MT sphere is expanded in terms of atomic-like wavefunctions, with the expansion controlled by the angular-momentum cutoff . The wave function in the interstitial region is expanded in terms of plane waves, with the plane wave cutoff determined by the product , where represents the muffin-tin sphere radius and the magnitude of the largest wavevector. We use =10, Kmax=8.0, R(Fe)=2.2 a.u. and (Pt)=2.3 a.u. throughout this work.
In the full-potential KKR-Green function calculations, one employs a multipole expansion of the Green function for which we used a cutoff =3. Note that the cutoffs and have different meanings within FLAPW and KKR methods, so their values cannot be directly compared.
Once the Green function components (in KKR calculations) or the wave functions (in FLAPW calculations) have been determined, the charge density can be obtained via the -space integration over the Brillouin zone (BZ). The results presented in this study were obtained using an integration mesh of 2000 -points for the CPA calculations and for the ordered L structures, 1000 -points for SQS-4, 500 -points for SQS-8, 250 -points for SQS-16 and 125 -points for SQS-32. All numbers relate to the full BZ.
For systems of 3 and 5 metals there is a problem whether the exchange and correlation effects should be dealt with within the local density approximation (LDA) or within the generalized gradient approximation (GGA) [39; 33]. Our focus is on magnetic properties, so we used the Vosko, Wilk, and Nusair parametrization within the LDA scheme [40], because benefits of the GGA are questionable for magnetic studies [41; 42; 43]. However, when doing structural relaxation we employed the GGA scheme [44] as well, to enable a comparison. It turns out in the end that the choice between the LDA and the GGA is not crucial for our purpose.
When using the sprkkr code, local magnetic moments (as well as charges) were evaluated within the Voronoi polyhedra around the atomic sites. When using the wien2k code, the local magnetic moments were evaluated within the muffin-tin spheres. This difference does not affect our conclusions because each code is used to investigate different aspects. We checked that if the MT spheres used in the wien2k have maximum radii (so that they touch), very similar values for the magnetic moments are obtained for the wien2k and sprkkr (differences in the spin magnetic moments calculated via both codes are less than 1 %, differences in the orbital magnetic moments are less than 20 %). Such a setting of the MT radii would, however, not be suitable for structure relaxations for which the wien2k is mainly used in this work (Sec. III.5).
III Results
III.1 Density of states
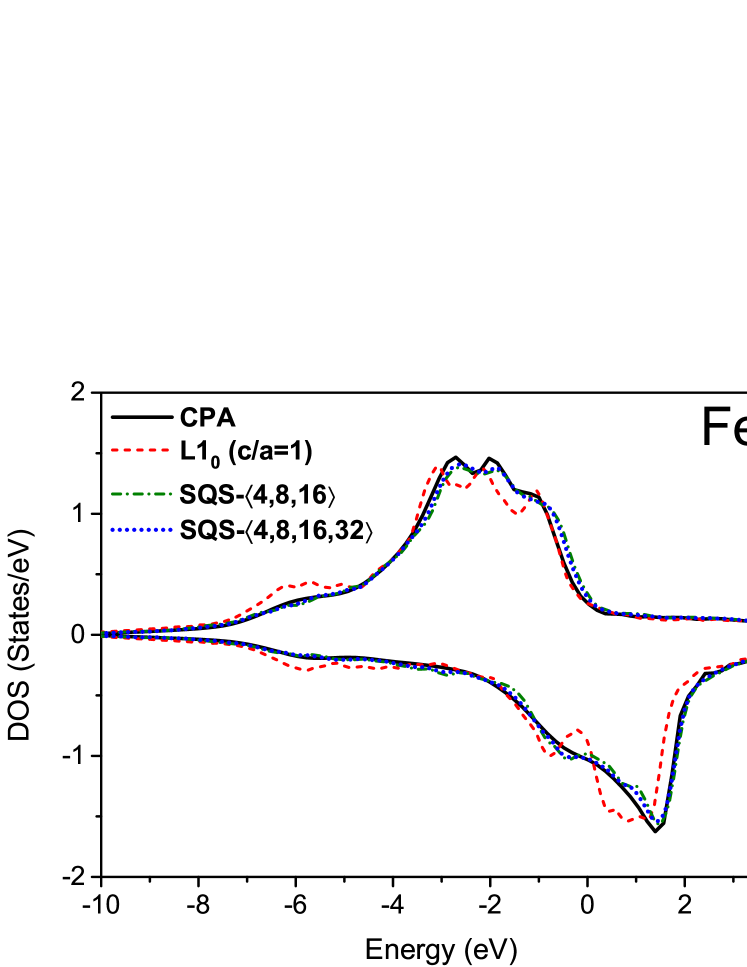
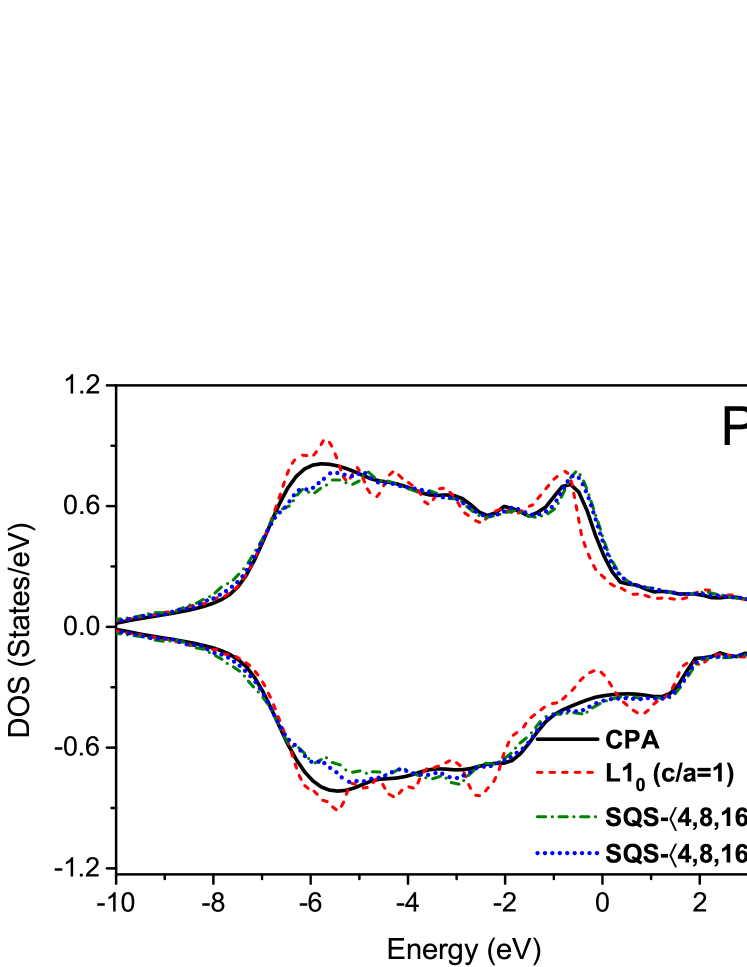
We begin by investigating the density of states (DOS) and compare the DOS for ordered structures and supercells with the DOS for disordered FePt obtained via the CPA. In particular, we want to monitor how the DOS averaged over all sites of a given chemical type develops if more and more sites are included. The results shown here were obtained via the sprkkr code but data obtained for the ordered structures and supercells via the wien2k code would look practically the same.
A sequence of DOS curves is presented in Fig. 2. We start with the DOS for the ordered L structure (with c/a=1.0), then comes the DOS averaged over all sites in the SQS-4, SQS-8, and SQS-16 supercells (), DOS averaged over all sites in the SQS-4, SQS-8, SQS-16, and SQS-32 supercells () and all this is compared to the DOS for disordered FePt obtained via the CPA.
One can see that the DOS for ordered L FePt and disordered FePt is different (albeit similar). When the disorder is simulated by supercells, the CPA limit is approached quite rapidly; the supercell and CPA results become practically equivalent for . This indicates that by averaging over the SQS’s of 4, 8, 16, and 32 atoms, a very good description of the disorder is achieved. The DOS for the Fe atoms seems to approach the CPA data more quickly than the DOS for the Pt atoms but the difference is not big.
A visual inspection of the DOS curves brings an intuitive insight but cannot substitute for a quantitative analysis. In the following sections, attention will be paid to a careful comparison of integral quantities such as charges and magnetic moments.
III.2 Average magnetic moments: comparison between supercells and CPA
| type | |||
|---|---|---|---|
| () | Fe | 2.829 | 0.065 |
| Pt | 0.337 | 0.044 | |
| () | Fe | 2.794 | 0.072 |
| Pt | 0.322 | 0.048 | |
| SQS-4 | Fe | 2.843 | 0.043 |
| Pt | 0.253 | 0.027 | |
| SQS-8 | Fe | 2.821 | 0.069 |
| Pt | 0.286 | 0.051 | |
| SQS-16 | Fe | 2.823 | 0.066 |
| Pt | 0.263 | 0.042 | |
| SQS-32 | Fe | 2.816 | 0.073 |
| Pt | 0.264 | 0.043 | |
| Fe | 2.821 | 0.069 | |
| Pt | 0.266 | 0.043 | |
| CPA | Fe | 2.903 | 0.070 |
| Pt | 0.239 | 0.039 |
Table 1 shows the average spin and orbital magnetic moments and for Fe and Pt atoms obtained by assuming SQS supercell geometries and by employing the CPA. No structural relaxation was performed at this stage. The magnetization is oriented along the [001] direction of the parental fcc lattice. The calculations were performed using the sprkkr code, so a direct comparison between the SQS and the CPA results can be made. The data shown in Table 1 were obtained for a full potential but we checked that using it was actually not necessary: when the atomic sphere approximation (ASA) was applied instead, the spin magnetic moments increased typically by 1 % and the orbital magnetic moments by 2-10 %.
As found earlier [23; 29], the difference between moments for ordered and disordered FePt is evident but not large. The variation in between different SQS’s is quite small when going stepwise from to . This is especially true for the Fe atoms. For the Pt atoms, the relative deviations are a bit larger but still small. On the other hand, the variation in is relatively large for the same sequence of SQS’s. Again, this variation is larger for Pt atoms than for Fe atoms.
Remarkably, even for the largest SQS we explore, there remains a small but distinct difference for the magnetic moments between the supercell and the CPA approaches. The same applies to the average taken over all SQS’s. This difference will be subject of a further analysis in Sec. III.4.
III.3 Dependence of local magnetic moments on the chemical composition of the nearest neighborhood
In this section we focus on how local magnetic moments depend on the chemical composition of the nearest neighborhood. All values presented here were obtained for non-relaxed structures via the sprkkr code (as in the previous sections).
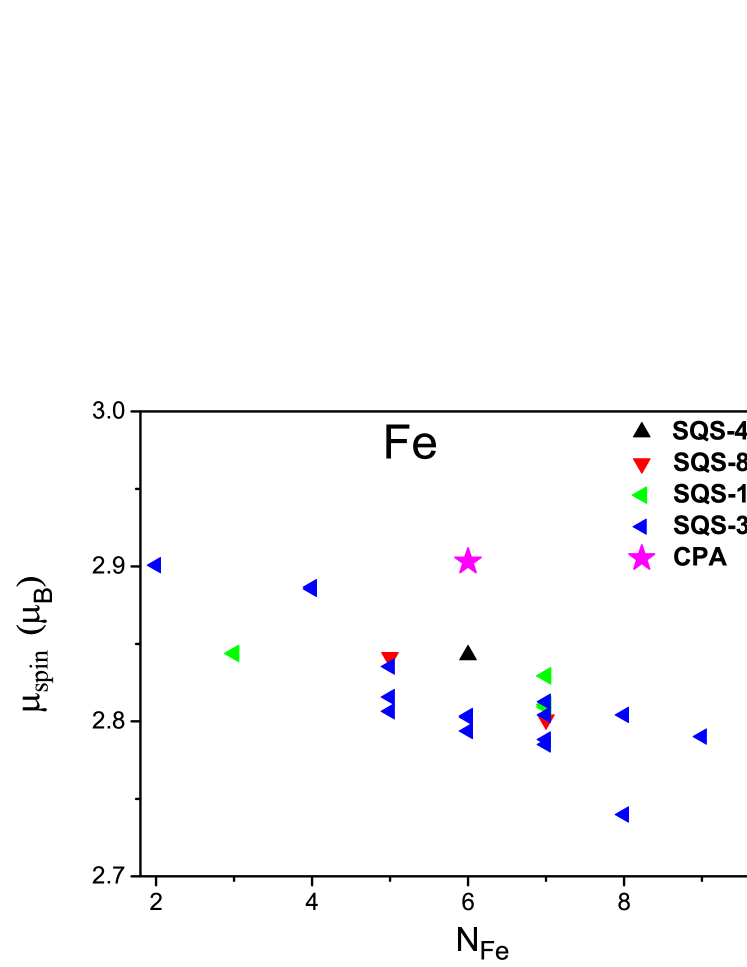
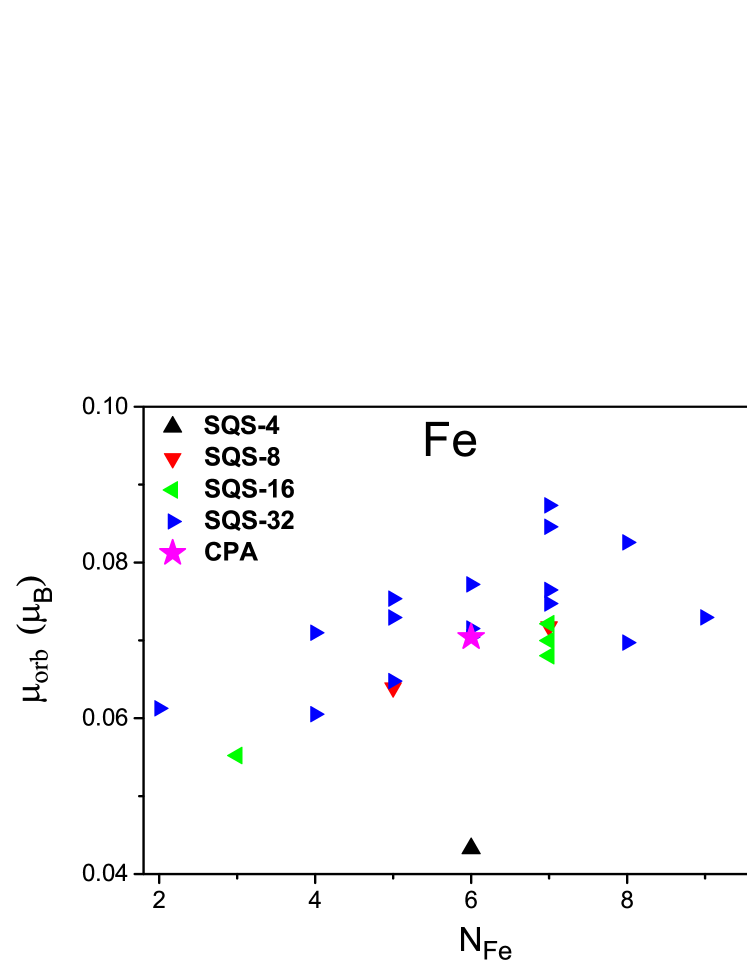
Figure 3 shows the local spin and orbital magnetic moments, and , respectively, for Fe sites in each of the SQS’s as a function of the number of Fe atoms in the first coordination sphere, . The magnetization is always parallel to the [001] direction of the parental fcc lattice.
One can see from Fig. 3 that the values of for the Fe sites are all very similar — they do not differ from each other by more than 5 %. There is a much larger spread for the local values (around 30 %). Generally, for Fe atoms decreases with increasing . This is plausible, because increasing means strengthening the hybridization between Fe states, which suppresses the magnetic moment. An opposite trend is observed for . This is a bit surprising because, usually, exhibits the same trend as for 3 atoms [45; 46]. The explanation rests on the large SOC at Pt atoms in comparison with the SOC at Fe atoms: at Fe atoms is suppressed by the off-site SOC at Pt atoms. This mechanism was discussed in detail for the CoPt system [47] and apparently is active here as well. Indeed, the trends of and for Fe atoms in FePt are quite similar to the trends of and for Co atoms in CoPt systems (compare our Fig. 3 with figures 1 and 4 of Šipr et al. [47]).
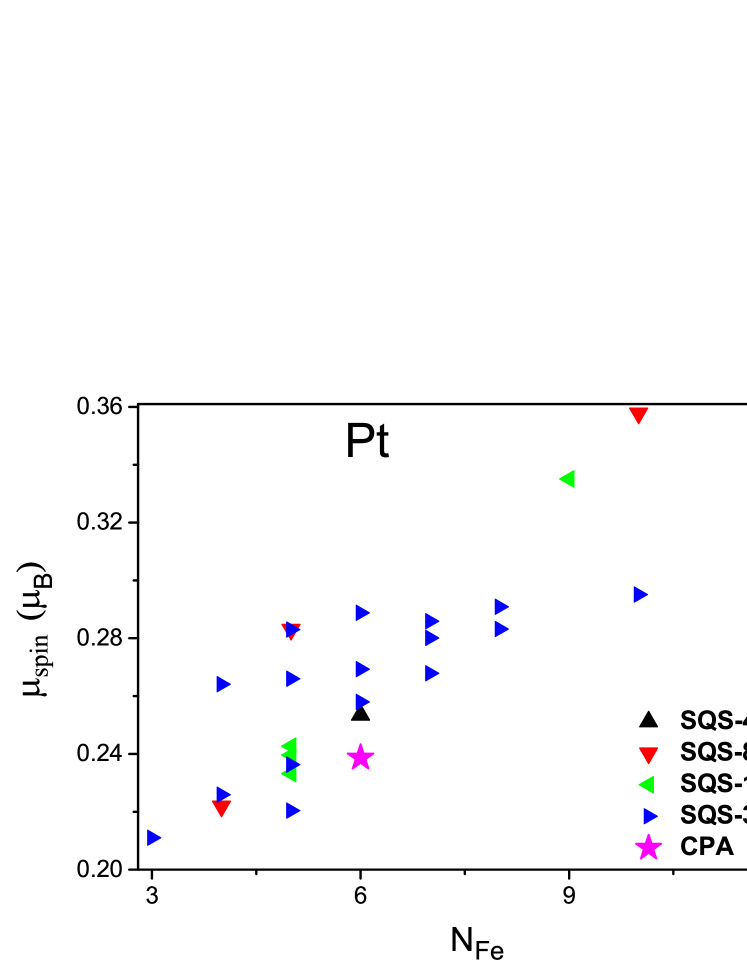
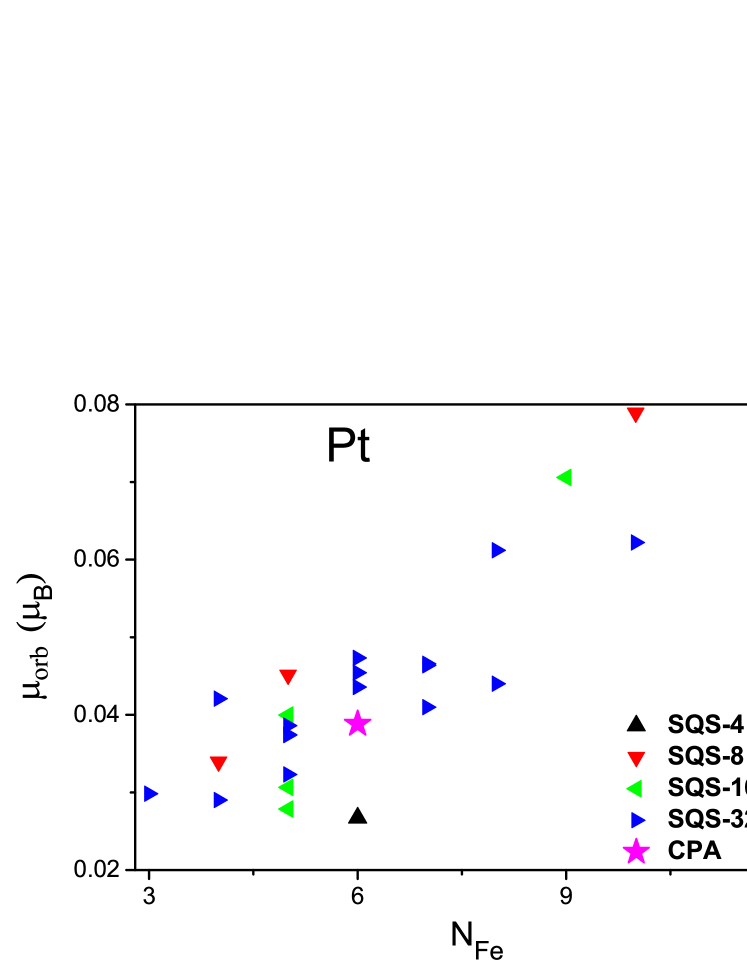
The situation is different concerning the moments for the Pt sites. Corresponding local moments and are shown as a function of in Fig. 4. One can see that if the number of Fe atoms near a Pt atom increases, and for this Pt atom increase as well. This is consistent with the fact that the magnetic moments of the Pt atoms are induced by the magnetic moments of the neighboring Fe atoms. If the number of neighboring Fe atoms increases, so does the induced magnetic moment at the Pt site. This is true both for and ; the disturbance by the off-site SOC at neighboring Fe atoms is not significant because the SOC-strength parameter for Pt atoms (712 meV as obtained by the expression of Davenport et al. [48]) is much larger than the SOC-strength parameter for Fe atoms (65 meV).
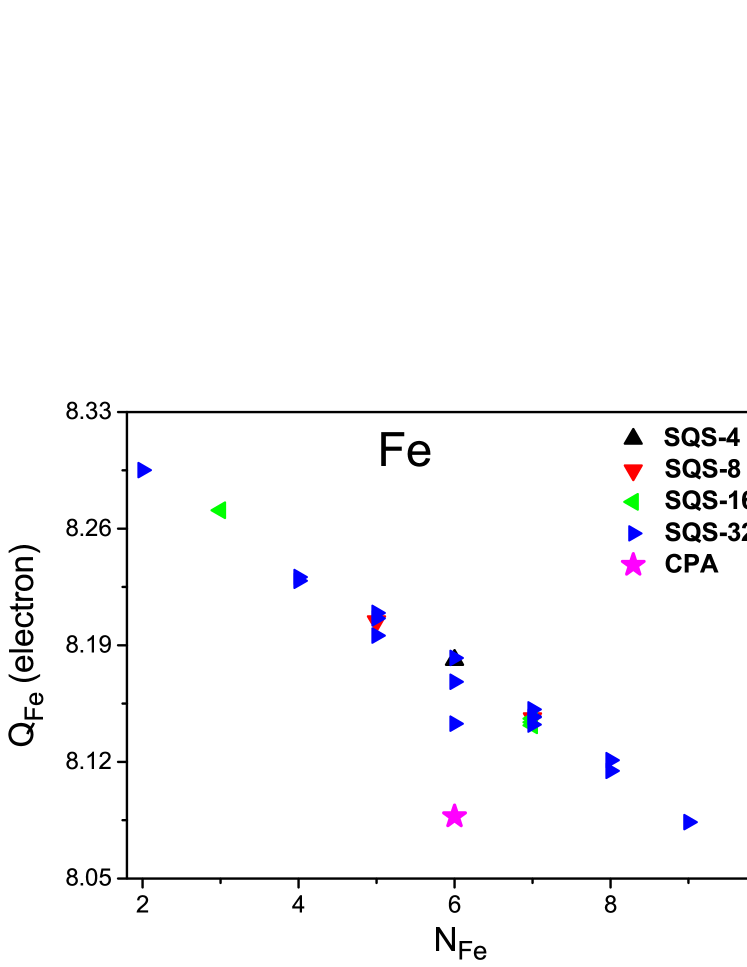
The CPA leads to different than what is obtained for the supercells (Fig. 3). To find why it is so, we look at the dependence of the electronic charge at the Fe site () on , again for various SQS’s. The corresponding graph is given in Fig. 5. Here, a convincing quasi-linear relation between and can be seen. One sees, at the same time, that the CPA result clearly does not fit into the trend set by the supercells. An analogous plot could be drawn also for electronic charge at the Pt sites (just with an opposite trend).
An interesting aspect following from Fig. 5 is that the Fe atoms actually gain electrons when they are alloyed with Pt. Of course, this depends on the way the atomic regions are defined; in our case, we use Voronoi polyhedra, meaning that Fe and Pt atoms occupy identical volumes. The charge flow picture might look differently for different definitions of the atomic cells.
III.4 Influence of the Madelung potential
The CPA leads to significantly different magnetic moment and charge than what would correspond to a Fe atom in a supercell with (figures 3 and 5). It thus appears that there is a difference between the way magnetism in disordered FePt alloy is described via the CPA and via the supercell approach and that this difference is linked to the electronic charge. A possible reason for this difference is the single-site nature of the CPA. In particular, the standard CPA cannot account for the Madelung contribution to the potential. To get more detailed insight, we investigate to what extent including or ignoring the Madelung potential affects the electronic structure and magnetism of the SQS’s.

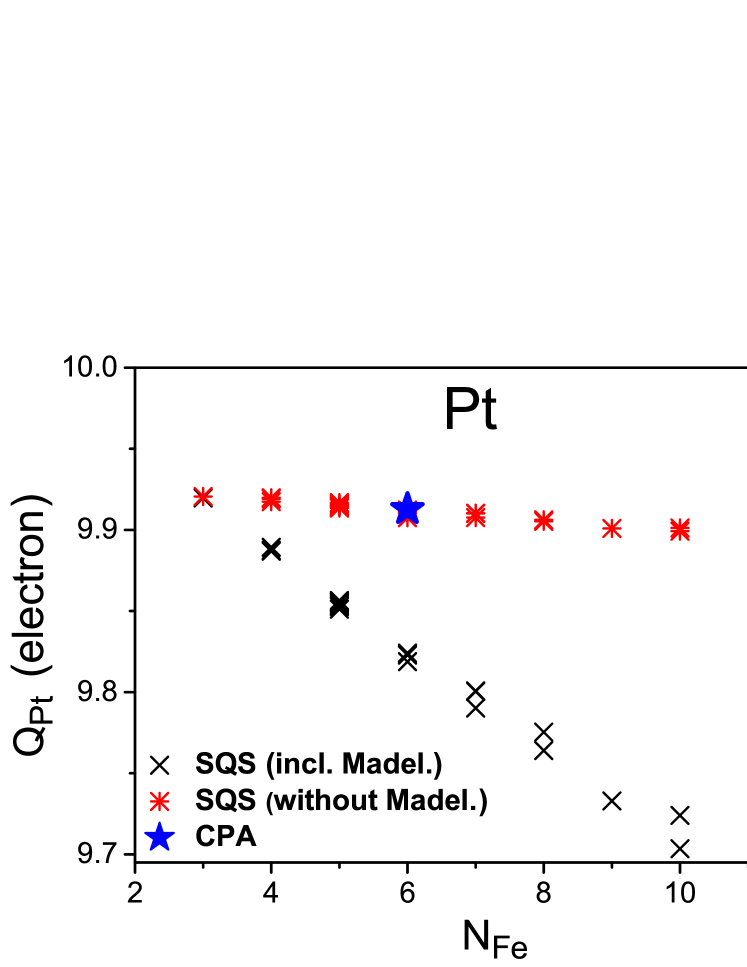
The influence of the Madelung potential on the charges at the Fe sites is shown in Fig. 7. One can see immediately that neglecting the Madelung potential practically suppresses the linear dependence of the charge on the coordination number. The CPA result corresponds to the case when the Madelung potential is neglected. For the Pt sites the situation is similar as for the Fe sites.
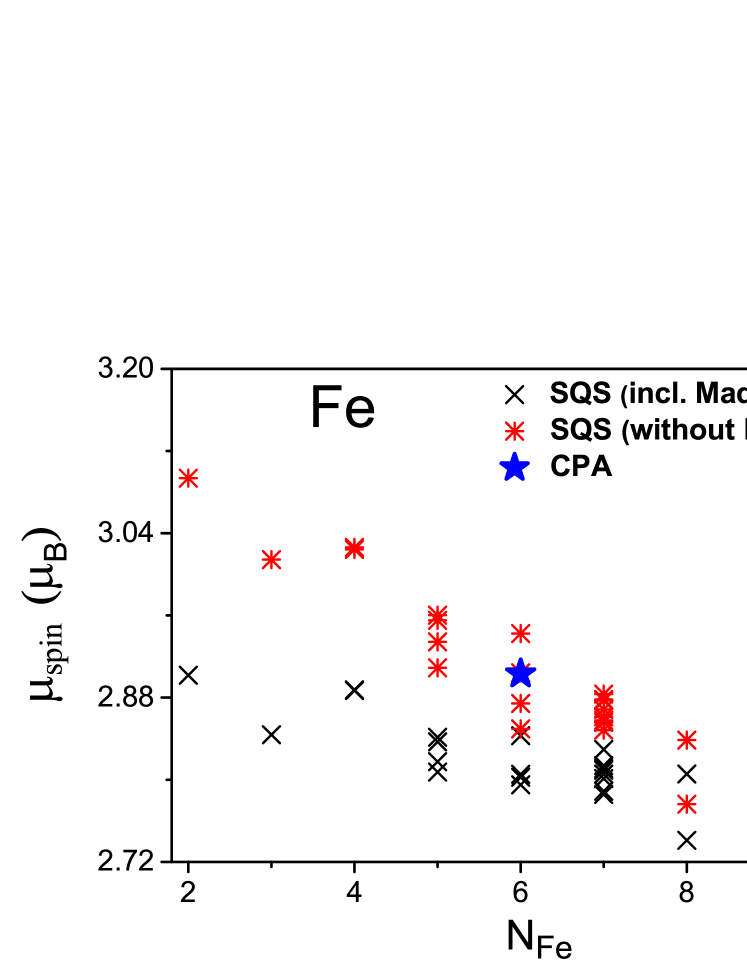
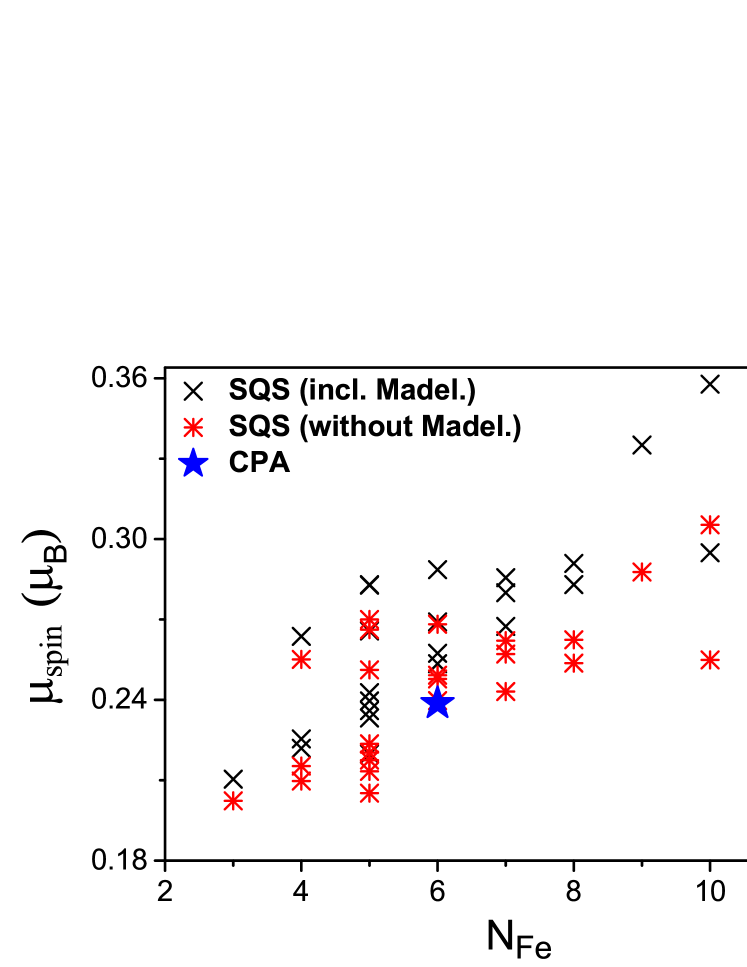
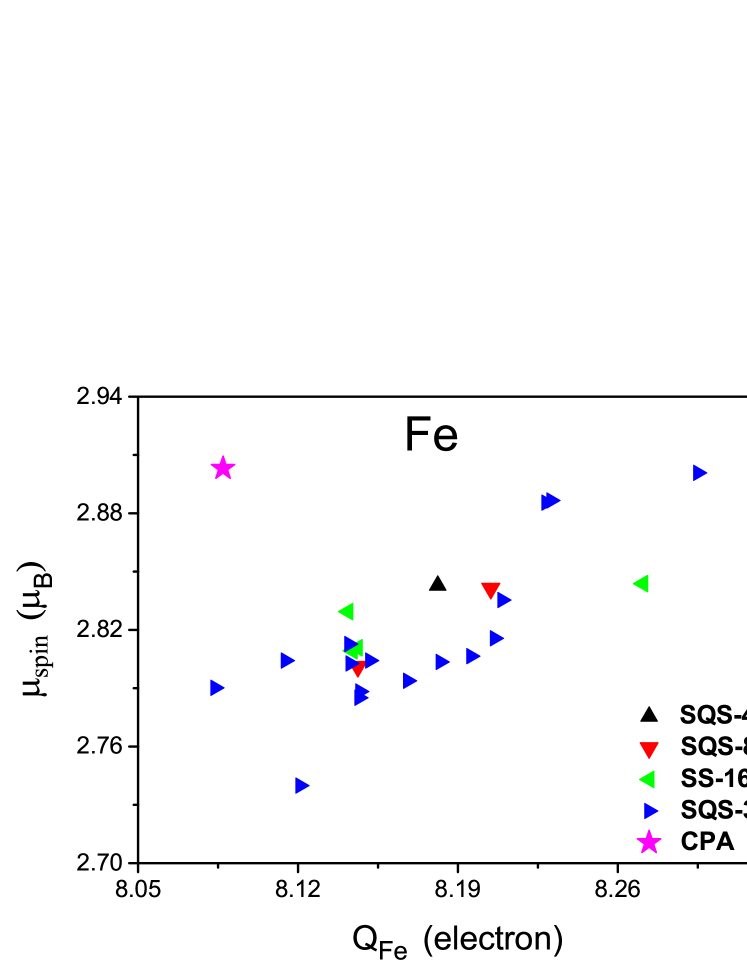
An analogous comparison for the spin magnetic moments is presented in Fig. 8. Even though the difference between the situation with the Madelung potential and without it is not so striking as in Fig. 7, again we see that the data split into two groups, with different slopes. This is true especially for the Fe sites: Neglecting the Madelung potential increases by 0.05–0.10 , which is about the same as the difference between for Fe obtained by averaging over all SQS’s and by the CPA (Table 1). Interestingly, the spin magnetic moments at the Pt sites are less affected by the presence or absence of the Madelung potential (see Fig. 4 and also Table 2). This is probably linked to the fact that the magnetic moments at the Pt sites are induced by the moments at the Fe sites, so the effect of the Madelung potential is felt not directly at the Pt sites themselves but only indirectly, through the change of the moments at the Fe sites.
| Fe | Pt | |||
|---|---|---|---|---|
| full potential: | ||||
| incl. Madelung | ||||
| without Madel. | ||||
| CPA | ||||
| ASA: | ||||
| incl. Madelung | ||||
| without Madel. | ||||
| CPA | ||||
Table 2 summarizes how the Madelung potential affects the charge and the spin magnetic moment averaged over all sites of given atomic type. As there can be some ambiguity how the suppression of the Madelung potential should be technically performed in the full potential case, we include in Table 2 also the results for the ASA. The outcome is similar in both cases: If the Madelung potential is suppressed, averaging over the supercells yields practically the same charges and magnetic moments as the CPA.
Several modifications of the CPA method were proposed to account for the effect of the Madelung potential [5; 6; 7; 8; 9; 10; 11; 12]. A survey of these approaches would be beyond our scope but to make yet another assessment of the influence of the Madelung potential, we employ the screened impurity model for the Madelung contribution within the CPA (SIM-CPA) [12]. This model assumes that the Madelung potential can be modeled as the potential due to a screening charge spherically distributed at the nearest-neighbor distance. Using this approach, we obtain 2.853 for at Fe atom and 0.244 for at Pt atom. Comparing these values with Table 1, we see that the SIM-CPA method pushes the standard CPA results in the desired direction. By optimizing model parameters of the SIM-CPA method [39], these values could be brought even closer to the values obtained by averaging over the SQS’s. However, this would not bring any new physical insight. We conclude that neglecting the Madelung potential by the CPA leads to small but distinct changes in magnetic moments in FePt alloy.
III.5 Dependence of local magnetic moments on bond lengths
By optimizing the positions of the atoms in the SQS, a variety of bond lengths is obtained. Here we study how variations in bond lengths affect magnetic moments. Respective calculations were performed using the wien2k code.
Generally, two types of structural relaxations could be made for an SQS: relaxation of internal degrees of freedom and relaxation of external degrees of freedom. Relaxation of internal degrees of freedom means that atoms are allowed to move in the direction of a force whereas the lattice vectors are kept unchanged. Relaxation of external degrees of freedom means that the lengths of the lattice vectors and the angles between them are optimized. External degrees of freedom reflect whole manifold of possible configurations, it is thus reasonable to keep them fixed when using the supercell to model an alloy. To study local environment effects, we relax only the atomic positions.
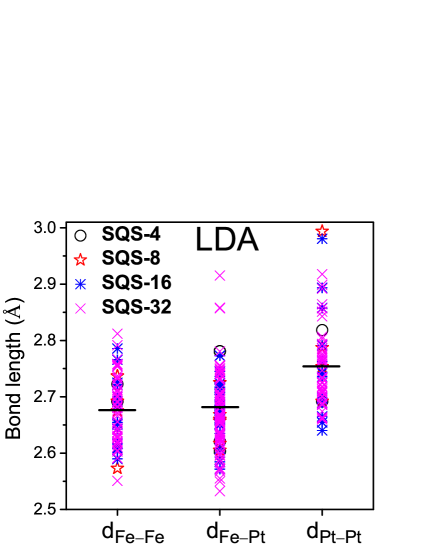
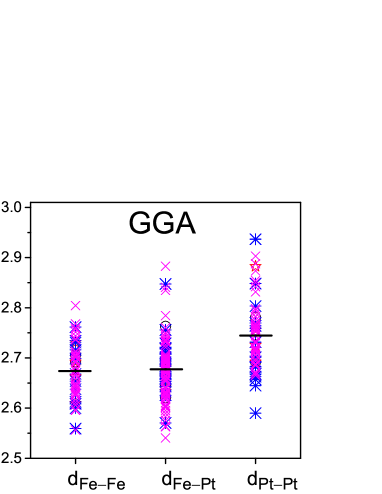
Bond-lengths , and resulting from the geometry optimization of the internal degrees of freedom are shown in Fig. 9 (both for the LDA and for the GGA). For a non-relaxed structure, all the lengths are 2.69 Å. One can see that the and distances are on the average close to 2.69 Å, with a bit smaller than . The distances are on the average larger than or distances. This is consistent with the fact that the inter-atomic distances in elemental Pt (2.77 Å) are significantly larger than the inter-atomic distances in elemental Fe (2.48 Å). The overall pictures provided by the LDA and by the GGA are similar. In the following only results for the LDA will be presented.
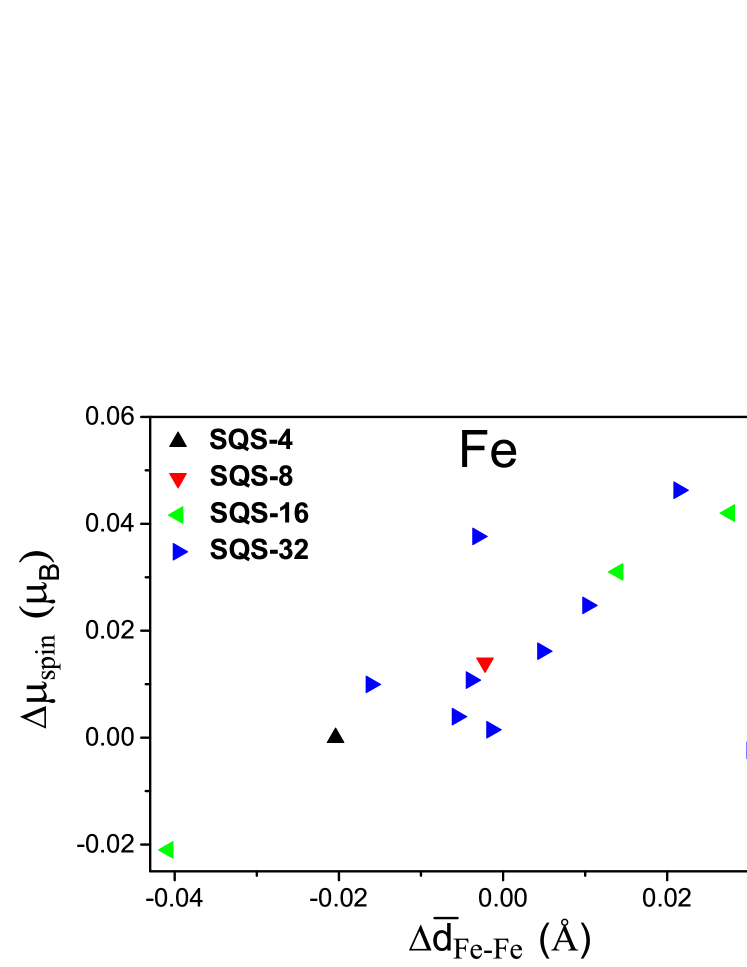
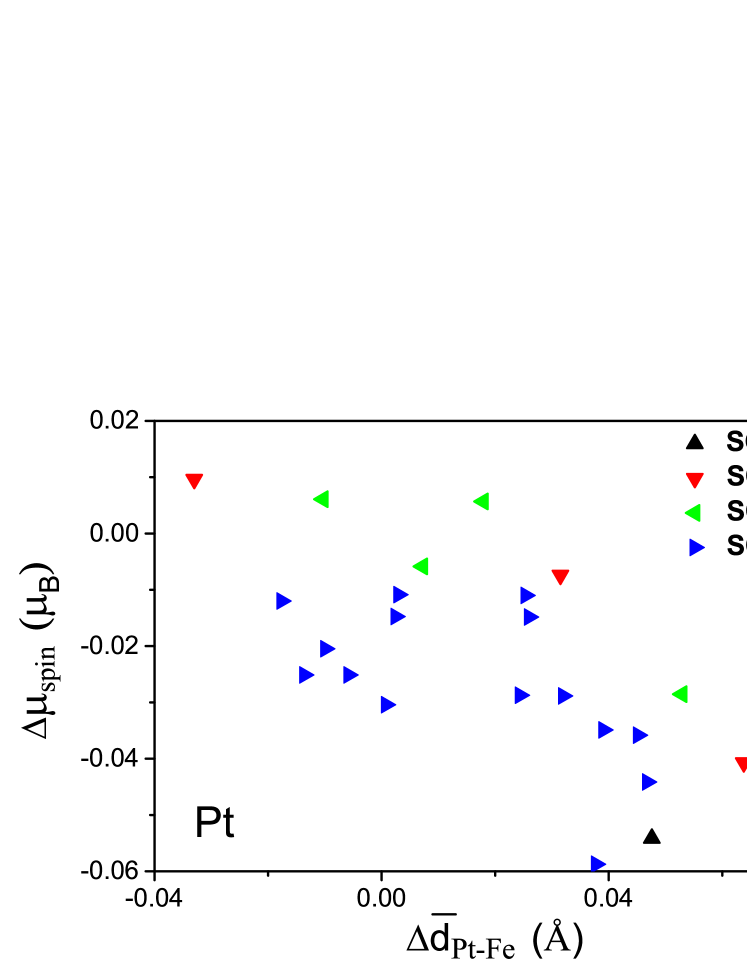
Changes in the inter-atomic distances cause corresponding changes in the magnetic moments. It is instructive to inspect how the change in the local spin moment is related to the change in the average distance of the nearest Fe neighbors from the respective site (). This is shown in Fig. 10. One can see that if the Fe neighbors around a Fe site are pushed away (i.e., increases), for that site increases. This is plausible, because increasing means that the hybridization between states related to Fe atoms decreases leading to an enhancement of the magnetic moment. On the other hand, if the Fe neighbors around a Pt site are pushed away (i.e., increases), for this Pt atom decreases. This reflects the fact that the magnetic moments at Pt atoms are induced by neighboring Fe atoms; the effectiveness of this mechanism obviously decreases with increasing Pt–Fe distance.
IV Discussion
Our goal was to compare the CPA and supercell description of electronic structure and magnetism of disordered FePt and to search for effects of the local environment. We found that the DOS averaged over all sites in supercells quickly approaches the DOS provided by the CPA. This means that although there may be large variations between the DOS for individual sites (as highlighted, e.g., by Lu et al. [34]), these variations are smeared out if an average is taken over even a small number of modestly large supercells. This was observed earlier for CuPd, CuAu and CuZn alloys [2] and for NiPt alloy [4]. The good agreement between the energy dependence of the DOS obtained by averaging over the supercell and by the CPA suggests that the CPA is very efficient for calculating spectroscopic properties [49; 50].
We found that the substitutional disorder in FePt can be described by relatively small supercells. The SQS-16 structure provides already a good description. Similar conclusions were reached earlier for a NiPt alloy by Ruban et al. [4] and by Shang et al. [33].
Concerning the magnetism we found that the CPA leads to magnetic moments that differ from the limit approached by involving supercells of ever increasing sizes. The difference between the CPA and the supercell limit is about 0.08 for at the Fe atoms and about -0.03 for at the Pt atoms. The reason for this difference is the neglect of the Madelung contribution to the potential in the standard CPA formalism.
Our study of the influence of the chemical composition of the nearest neighborhood on local magnetic moments can be seen as an extension of earlier studies of the influence of the coordination number on the local magnetic moments for 3 transition metal clusters and surfaces [45; 51; 46]. Similarly as for transition metals clusters and surfaces, a link between local magnetic moments for Fe atoms and the number of their nearest Fe neighbors can be established (Fig. 3) — albeit with a large spread around the purported dependence. The fact that the link between and is less evident for FePt than for Fe clusters indicates that the decrease of hybridization caused by replacing a neighboring Fe atom by a Pt atom is smaller than the decrease caused by removing a neighboring atom altogether. This is plausible.
The link between magnetic moments for Pt atoms and the number of their Fe neighbors appears to be quite strong (figure 4). This link stresses that the magnetism of the Pt atoms is induced by their Fe neighbors. Yet another demonstration of this fact comes from the dependence of the magnetic moment for Pt on the distance. The results shown in Fig. 10 are in accordance with an earlier study where the magnetic moments of Pt atoms were treated as originating solely from nearest magnetic 3 atoms [52].
We found that the electronic charge at Fe sites decreases with the number of Fe atoms in the first coordination shell. The opposite is true for Pt sites. This can be reformulated that the excess charge at Fe or Pt sites increases linearly with the number of unlike atoms in their nearest neighborhoods. Similar observations were made earlier for AgPd and AgAu alloys [34] and for CuZn alloys [3].
V Conclusions
Our calculations show that by increasing the number of atoms in special quasirandom structures SQS-, the results for the magnetic moments and for the DOS approach the results obtained via the CPA. However, a small but distinct residual difference remains between magnetic moments obtained by both approaches. This is due to the neglect of the Madelung potential in the standard CPA.
The local magnetic moments associated with Fe atoms are more robust with respect to variations of the local environment than the magnetic moments associated with the Pt atoms. This reflects the fact that magnetism at Pt sites is induced by neighboring Fe atoms and that electronic states derived from the Pt atoms are more delocalized than states derived from the Fe atoms.
If structural relaxation is performed, the distances between the Pt atoms are larger on the average than distances between the Fe atoms or distances between the Fe and Pt atoms . The magnetic moments at the Fe sites increase if the average distance increases. The magnetic moments at the Pt sites decrease if the average distance increases, in accordance with intuition.
If the disorder in FePt alloy is simulated by supercells constructed along the SQS prescription, the calculated integral properties converge with the size of the SQS quite quickly: accuracy sufficient for most needs is achieved already for the SQS-16 supercell.
Acknowledgements.
We would like to acknowledge CENTEM project (CZ.1.05/2.1.00/03.0088), CENTEM PLUS (LO1402) and COST CZ LD15147 of The Ministry of Education, Youth and Sports (Czech Republic). Computational time has been provided with the MetaCentrum (LM205) and CERIT-SC (CZ.1.05/3.2.00/08.0144) infrastructures. In addition we would like to thank for travel support from EU-COST action MP1306 (EUSpec).References
- Gonis et al. [1984] A. Gonis, G. M. Stocks, W. H. Butler, and H. Winter, Phys. Rev. B 29, 555 (1984).
- Abrikosov and Johansson [1998a] I. A. Abrikosov and B. Johansson, Phys. Rev. B 57, 14164 (1998a).
- Johnson and Pinski [1993a] D. D. Johnson and F. J. Pinski, Phys. Rev. B 48, 11553 (1993a).
- Ruban et al. [2002] A. V. Ruban, S. I. Simak, P. A. Korzhavyi, and H. L. Skriver, Phys. Rev. B 66, 024202 (2002).
- Johnson and Pinski [1993b] D. D. Johnson and F. J. Pinski, Phys. Rev. B 48, 11553 (1993b).
- Magri et al. [1990] R. Magri, S.-H. Wei, and A. Zunger, Phys. Rev. B 42, 11388 (1990).
- Korzhavyi et al. [1995] P. Korzhavyi, A. Ruban, I. Abrikosov, and H. Skriver, Phys. Rev. B 51, 5773 (1995).
- Saha et al. [1996] T. Saha, I. Dasgupta, and A. Mookerjee, J. Phys.: Condens. Matter 8, 1979 (1996).
- Ujfalussy et al. [2000] B. Ujfalussy, J. S. Faulkner, N. Y. Moghadam, G. M. Stocks, and Y. Wang, Phys. Rev. B 61, 12005 (2000).
- Bruno et al. [2002a] E. Bruno, L. Zingales, and A. Milici, Phys. Rev. B 66, 245107 (2002a).
- Abrikosov and Johansson [1998b] I. A. Abrikosov and B. Johansson, Phys. Rev. B 57, 14164 (1998b).
- Ruban and Skriver [2002] A. V. Ruban and H. L. Skriver, Phys. Rev. B 66, 024201 (2002).
- Sanyal et al. [2001] B. Sanyal, S. K. Bose, V. Drchal, and J. Kudrnovský, Phys. Rev. B 64, 134111 (2001).
- Sluiter et al. [2006] M. H. F. Sluiter, C. Colinet, and A. Pasturel, Phys. Rev. B 73, 174204 (2006).
- Akai et al. [1988] H. Akai, P. H. Dederichs, and J. Kanamori, J. Physique. Coll. 49, C8 (1988).
- Hayn and Drchal [1998] R. Hayn and V. Drchal, Phys. Rev. B 58, 4341 (1998).
- Kudrnovský et al. [2008] J. Kudrnovský, V. Drchal, I. Turek, and P. Weinberger, Phys. Rev. B 78, 054441 (2008).
- Yin et al. [2015] Y. Yin, F. Pan, M. Ahlberg, M. Ranjbar, P. Dürrenfeld, A. Houshang, M. Haidar, L. Bergqvist, Y. Zhai, R. K. Dumas, A. Delin, and J. Åkerman, Phys. Rev. B 92, 024427 (2015).
- Ruban et al. [1995] A. V. Ruban, I. A. Abrikosov, and H. L. Skriver, Phys. Rev. B 51, 12958 (1995).
- Bruno et al. [2002b] E. Bruno, L. Zingales, and A. Milici, Phys. Rev. B 66, 245107 (2002b).
- Kumar et al. [2006] U. Kumar, P. K. Mukhopadhyay, B. Sanyal, O. Eriksson, P. Nordblad, D. Paudyal, K. Tarafder, and A. Mookerjee, Phys. Rev. B 74, 064401 (2006).
- Khan et al. [2016] S. N. Khan, J. B. Staunton, and G. M. Stocks, Phys. Rev. B 93, 054206 (2016).
- Paudyal et al. [2004] D. Paudyal, T. Saha-Dasgupta, and A. Mookerjee, J. Phys.: Condens. Matter 16, 2317 (2004).
- Peil et al. [2012] O. E. Peil, A. V. Ruban, and B. Johansson, Phys. Rev. B 85, 165140 (2012).
- Kissavos et al. [2006] A. Kissavos, S. Simak, P. Olsson, L. Vitos, and I. Abrikosov, Comp. Mater. Science 35, 1 (2006).
- Lowitzer et al. [2009] S. Lowitzer, D. Ködderitzsch, H. Ebert, and J. B. Staunton, Phys. Rev. B 79, 115109 (2009).
- Perlov et al. [1998] Y. Perlov, H. Ebert, A. Yaresko, V. Antonov, and D. Weller, Solid State Commun. 105, 273 (1998).
- Kharoubi et al. [2013] M. Kharoubi, A. Haroun, and M. Alouani, Comp. Mater. Science 73, 24 (2013).
- Sun et al. [2006] C. J. Sun, G. M. Chow, G. H. Fecher, J. S. Chen, H.-J. Lin, and Y. Hwu, Jap. J. Appl. Phys. 45, 2539 (2006).
- Zunger et al. [1990] A. Zunger, S.-H. Wei, L. G. Ferreira, and J. E. Bernard, Phys. Rev. Lett. 65, 353 (1990).
- Lyubina [2007] J. V. Lyubina, Nanocrystalline Fe-Pt alloys: phase transformations, structure and magnetism (Cuvillier, Göttingen, 2007).
- Su et al. [2010] Z. Su, Y. Wang, and S. Wang, Acta Metall. Sin. 46, 623 (2010).
- Shang et al. [2011] S. L. Shang, Y. Wang, D. E. Kim, C. L. Zacherl, Y. Du, and Z. K. Liu, Phys. Rev. B 83, 144204 (2011).
- Lu et al. [1991] Z. W. Lu, S.-H. Wei, and A. Zunger, Phys. Rev. B 44, 10470 (1991).
- Wei et al. [1990] S.-H. Wei, L. G. Ferreira, J. E. Bernard, and A. Zunger, Phys. Rev. B 42, 9622 (1990).
- Blaha et al. [2001] P. Blaha, K. Schwarz, G. K. H. Madsen, D. Kvasnicka, and J. Luitz, Wien2k, An Augmented Plane Wave plus Local orbital Program for Calculating the Crystal Properties, http://www.wien2k.at (2001).
- Ebert et al. [2011] H. Ebert, D. Ködderitzsch, and Minár, Rep. Prog. Phys. 74, 096501 (2011).
- Ebert [2012] H. Ebert, The Munich spr-kkr package, version 7, http://olymp.cup.uni-muenchen.de (2012).
- Ruban et al. [2003] A. V. Ruban, S. I. Simak, S. Shallcross, and H. L. Skriver, Phys. Rev. B 67, 214302 (2003).
- Vosko et al. [1980] S. H. Vosko, L. Wilk, and M. Nusair, Can. J. Phys. 58, 1200 (1980).
- Battocletti et al. [1996] M. Battocletti, H. Ebert, and H. Akai, Phys. Rev. B 53, 9776 (1996).
- Galanakis et al. [2000] I. Galanakis, S. Ostanin, M. Alouani, H. Dreyssé, and J. M. Wills, Phys. Rev. B 61, 599 (2000).
- Hafner et al. [2002] R. Hafner, D. Spišák, R. Lorenz, and J. Hafner, Phys. Rev. B 65, 184432 (2002).
- Perdew et al. [1996] J. P. Perdew, K. Burke, and M. Ernzerhof, Phys. Rev. Lett. 77, 3865 (1996).
- Šipr et al. [2004] O. Šipr, M. Košuth, and H. Ebert, Phys. Rev. B 70, 174423 (2004).
- Bornemann et al. [2012] S. Bornemann, O. Šipr, S. Mankovsky, S. Polesya, J. B. Staunton, W. Wurth, H. Ebert, and J. Minár, Phys. Rev. B 86, 104436 (2012).
- Šipr et al. [2008] O. Šipr, J. Minár, S. Mankovsky, and H. Ebert, Phys. Rev. B 78, 144403 (2008).
- Davenport et al. [1988] J. W. Davenport, R. E. Watson, and M. Weinert, Phys. Rev. B 37, 9985 (1988).
- Gray et al. [2012] A. X. Gray, J. Minár, S. Ueda, P. R. Stone, Y. Yamashita, J. Fujii, J. Braun, L. Plucinski, C. M. Schneider, G. Panaccione, H. Ebert, O. D. Dubon, K. Kobayashi, and C. S. Fadley, Nature Materials 11, 957 (2012).
- Sánchez-Barriga et al. [2016] J. Sánchez-Barriga, A. Varykhalov, G. Springholz, H. Steiner, R. Kirchschlager, G. Bauer, O. Caha, E. Schierle, E. Weschke, A. A. Ünal, S. Valencia, M. Dunst, J. Braun, H. Ebert, J. Minár, E. Golias, L. V. Yashina, A. Ney, V. Holý, and O. Rader, Nature Comm. 7, 10559 (2016).
- Mavropoulos et al. [2006] P. Mavropoulos, S. Lounis, R. Zeller, P. H. Dederichs, and S. Blügel, Appl. Physics A 82, 103 (2006).
- Polesya et al. [2010] S. Polesya, S. Mankovsky, O. Šipr, W. Meindl, C. Strunk, and H. Ebert, Phys. Rev. B 82, 214409 (2010).