Comparative study of phonon spectrum and thermal expansion of
graphene, silicene, germanene and blue phosphorene
Abstract
Based on first-principles calculation using density functional theory, we study the vibrational properties and thermal expansion of mono-atomic two-dimensional honeycomb lattices: graphene, silicene, germanene and blue phosphorene. We focus on the similarities and differences of their properties, and try to understand them from their lattice structures. We illustrate that, from graphene to blue phosphorene, phonon bandgap develops due to large buckling-induced mixing of the in-plane and out-of-plane phonon modes. This mixing also influences their thermal properties. Using quasi-harmonic approximation, we find that all of them show negative thermal expansion at room temperature.
pacs:
65.80.g, 65.40.De, 63.22.NpI Introduction
Since the discovery of grapheneNovoselov et al. (2004); Zhang et al. (2005), two-dimensional (2D) materials, from mono-atomic single layer silicene Cahangirov et al. (2009); Vogt et al. (2012); Feng et al. (2012), germaneneCahangirov et al. (2009), phosphoreneLi et al. (2014); Liu et al. (2014); Zhu and Tománek (2014); Sun et al. (2016), to transition metal mono- and di-chalcogenidesNovoselov et al. (2005); Mak et al. (2010); Splendiani et al. (2010), have been the focus of intense study in the field of physics, chemistry and materials sciencesCastro Neto et al. (2009); Zhu and Tománek (2014); Cahangirov et al. (2009); Li et al. (2014); Liu et al. (2014); Geim and Grigorieva (2013); Gupta et al. (2015); Vogt et al. (2012); Feng et al. (2012); Jiang and Park (2014); Nika et al. (2015); Nika and Balandin (2012); Balandin (2011); Yang et al. (2012); Zhu and Tománek (2014); Sun et al. (2016); Mak et al. (2010); Splendiani et al. (2010); Tao et al. (2015). One of the most important driving force for exploring these 2D materials is the possibility of using them to build next-generation electronics. Thus, their electronic, optical, and magnetic properties have been extensively studied, experimentally and theoretically. Among them, silicene has the advantage of being easily incorporated into silicon based electronics. Very recently, silicene based field effect transistor has been demonstratedTao et al. (2015).
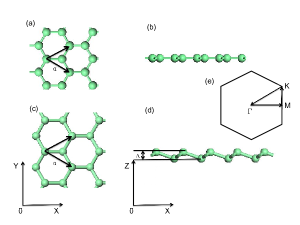
One exciting further direction in the study of 2D materials is to build 2D van der Waals (VDW) heterostructures by reassembling different kinds of 2D single layer materials togetherGeim and Grigorieva (2013). Stability of these VDW heterostructures depends sensitively on their thermal and vibrational properties, which are relatively less studiedSchelling and Keblinski (2003); Mounet and Marzari (2005); Aierken et al. (2015); Gan et al. (2015); Huang et al. (2015, 2014); Sevik (2014); Cai et al. (2014). Here we focus on one family of such 2D materials, namely honeycomb graphene, silicene, germanene and blue phosphorene (Fig. 1) Zhu and Tománek (2014); Aierken et al. (2015); Ding and Wang (2015). Using graphene as the template system, we perform comparative study on their vibrational and thermal properties. We study the relation between structural and thermal/vibrational properties. Although some of these properties have been studied separatelyMounet and Marzari (2005); Aierken et al. (2015); Gan et al. (2015); Huang et al. (2015, 2014); Sevik (2014); Cai et al. (2014); Ding and Wang (2015); Jiang et al. (2009a); Pozzo et al. (2011), here we focus on a comparative study of their similarities and differences.
We perform Density Functional Theory (DFT) based calculations of the phonon spectrum at different lattice constants. Based on these calculations, using the quasi-harmonic approximation (QHA), we obtain the Grüneisen parameters, thermal expansion coefficients and other thermodynamic properties of these 2D materials. We find that at room temperature, the thermal expansion coefficients of all these 2D materials are negative. It has already been experimentally demonstrated that the interaction between graphene and the substrate can be tuned by utilizing their different thermal expansion coefficients. We anticipate that similar effect is possible for other 2D materials.
II DFT calculation
Our DFT calculations are performed by using the Vienna Simulation Package (VASP) Kresse and Furthmüller (1996a, b). It is based on the projected augmented wave (PAW) method and plane wave basis set. The Perdew-Burke-Ernzerhof (PBE) version of the generalized gradient approximation (GGA) is used Perdew et al. (1996). We note that the main conclusions of this work do not depend on the exchange-correlation functionals used. The energy cutoffs for graphene, silicene, germanene, and blue phosphorene are 750, 500, 400, 400 eV, respectively. For the structural relaxations, the Brillouin zone is sampled using the centered scheme with at least points. For the vibrational and thermal properties, we need a large unit cell to treat the long range interaction, which is important for the long wavelength, low frequency phonons near , and a dense point sampling for the high frequency optical phonons. In this work, we have used a supercell of at least , and a -point sampling of .
The mechanical and thermal properties are obtained using Phonopy-QHA script Togo et al. (2008); Togo and Tanaka (2015). Firstly, a series of phonon spectrum using different lattice constants are calculated. For each lattice constant , the free energy is obtained from
| (1) | |||||
Here, is the ground state free energy, is the vibrational frequency corresponding to wavevector , mode , is the reduced Planck constant, with the Boltzmann constant, the temperature. A third-order Birch-Murnaghan equation of state is then used to fit the data points. The equilibrium lattice constants at different are obtained. The thermal expansion coefficient is defined as
| (2) |
can also be obtained from the mode-dependent Grüneisen parameters
| (3) |
as
| (4) |
Here, is the heat capacity at constant volume, is the bulk modulus, is the equilibrium lattice constant, is the equilibrium unit cell volume, and is the corresponding vibrational frequency. Note that, in our calculation, we fixed the length of the unit cell in the direction perpendicular to the 2D plane. Thus, we have instead of in Eq. (4).
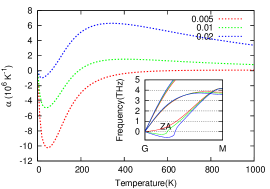
For 2D materials, the ZA mode is very soft, and a slight reduction of the lattice constant may result in negative phonon frequencies near point. This means the applied strain should be small enough. Otherwise, the QHA is not valid any more. One important difference between our and previous calculations is that we have used smaller strain of . Actually, due to this difference, our results for blue phosphorene are quite different from those of Ref. Aierken et al., 2015. We have compared results using different strains to show how sensitively the thermal expansion depends on the applied strain. To validate our results, we also calculated the thermal expansion coefficient using the Grüneisen theory from the data points at strain of , with -point sampling. This means that we ignore the contribution of phonon modes with wavelength larger than m. This cutoff is reasonable since in 2D materials ripples of similar size form and break the long range order.
III Results
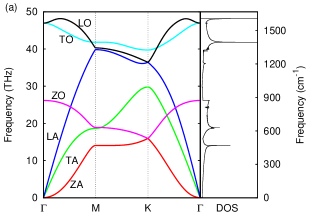
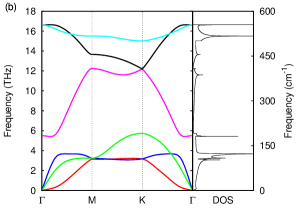
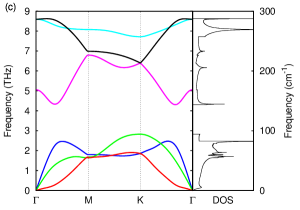
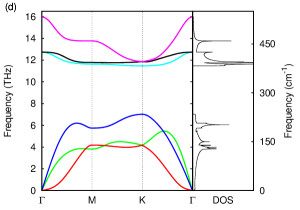
The calculated phonon dispersion relations along high symmetry lines within the Brillouin zone are shown in Fig. 2 together with the phonon density of states (DOS). The dispersion lines are similar due to their similar honeycombed lattice structures. Graphene has a mirror symmetry about the atomic plane, such that the atomic motions along direction are decoupled from those in the - plane in the harmonic approximation. The acoustic and optical modes along direction (ZA (red) and ZO(purple)) do not couple with other phonon modes, resulting in crossings of dispersion lines in graphene. For silicene, germanene and blue phosphorene, the slight buckling of the atoms in direction breaks the mirror symmetry, leading to hybridization of ZA and ZO with other modes. The crossings turn into avoid-crossings. The hybridization becomes stronger for larger buckling. This results in (1) the development of phonon bandgaps, (2) the reduction of phonon group velocity. Both of them reduce effectively the phonon thermal conductivity. Interestingly, the large buckling in blue phosphorene results in a larger point ZO frequency than that of degenerate TO and LO modes. This does not happen in silicene and germanene.
The buckling of atomic structure does not change the 3-fold rotational symmetry of the lattice. Due to this rotational symmetry, two degenerate points show up at point in the dispersion relations of all the materials considered. The quadratic dispersion of ZA mode near point in graphene is protected by the mirror and rotational symmetries around . The quadratic dispersion leads to a non-zero DOS at . But for other materials, the slightly breaking of mirror symmetry due to buckling introduces a small linear dispersion into the quadratic form.
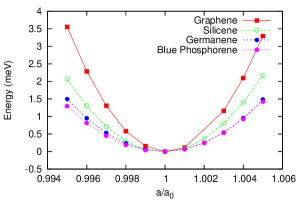
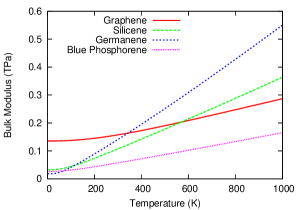
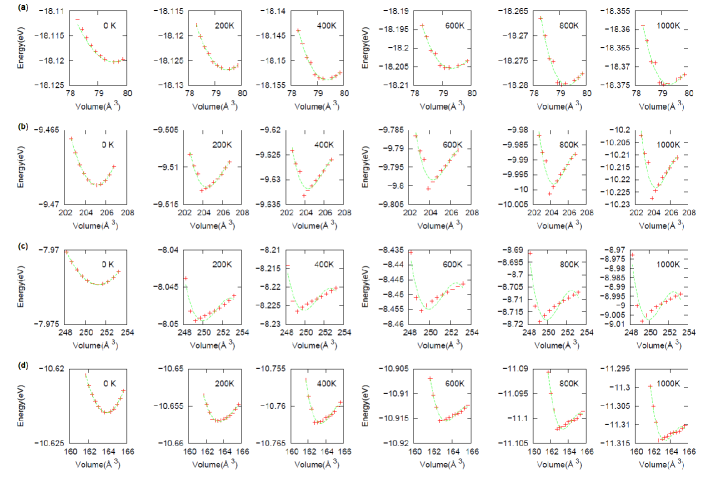
To study the thermodynamic properties within the QHA, we performed a series of calculations by changing the lattice constant within the range of . The energy-lattice-constant relationship is plotted in Fig. 3. We can see that the stiffness goes down from graphene to silicene, germanene and blue phosphorene. Correspondingly, the calculated bulk modulus follows the same trend.
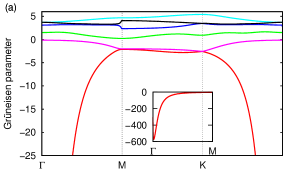
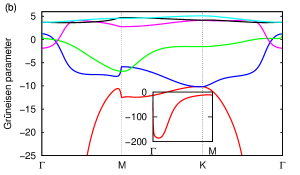
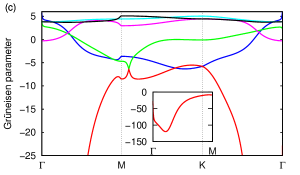
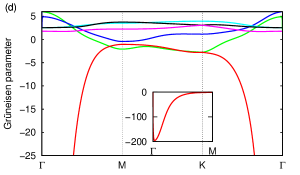
Using the phonon dispersion at , we calculated the mode Grüneisen parameters as shown in Fig. 4. In Table. 1, we compare our results with previous works, especially with those of Ref. Mounet and Marzari, 2005. They show reasonable agreement. This comparison validates the calculation procedure we used here for other materials. We can try to understand the results starting from graphene. As has already been shown by many previous worksMounet and Marzari (2005); Aierken et al. (2015); Huang et al. (2015, 2014); Sevik (2014), the graphene ZA and ZO modes have negative Grüneisen parameters, explained by LifshitzLifshitz (1952). This abnormal hardening of phonon modes upon expansion is a general feature of the 2D out-of-plane mode, and the reason why graphene shows negative thermal expansion. All other modes with in-plane motion have normal, positive Grüneisen parameters. As we have mentioned, there is no coupling between ZA, ZO modes with modes in the - plane. There is a clear distinction of these modes in the calculated Grüneisen parameters. For silicene, germanene, and blue phosphorene, due to the buckling, atomic motions in and - directions mix. Away from the point, there are more modes with negative Grüneisen parameters. But independent on elements, the TO and LO modes have Grüneisen parameters around . Finally, one notices that due to large buckling in blue phosphorene, the ZO mode at point has a larger frequency than the LO and TO modes, and a positive Grüneisen parameter, contrary to the other three materials. This shows a gradual lost of 2D properties of the ZO mode.
| Graphene | this work | GGA | LDA | experiment |
| 873 | 881Mounet and Marzari (2005),884Wirtz and Rubio (2004) | 890Dubay and Kresse (2003), 893Wirtz and Rubio (2004),884Kong et al. (2009) | ||
| 1566 | 1554Mounet and Marzari (2005),1569Wirtz and Rubio (2004) | 1586Yan et al. (2008),1595Dubay and Kresse (2003),1597Wirtz and Rubio (2004),1560Kong et al. (2009) | ||
| 0.6 | 0.8Mounet and Marzari (2005) | 0.8Kong et al. (2009) | ||
| 1.4 | 1.7Mounet and Marzari (2005) | 1.6Kong et al. (2009) | ||
| -0.1 | 0Mounet and Marzari (2005) | -0.1Kong et al. (2009) | ||
| 1.9 | 1.86Cheng et al. (2011),1.9Mounet and Marzari (2005) | 1.9Kong et al. (2009) | 1.99Mohiuddin et al. (2009),1.80Ding et al. (2010) | |
| TEC(10-6K-1) | -2.9a, -3.7b | -3.7Mounet and Marzari (2005) | -7Bao et al. (2009),-8Yoon et al. (2011),-7Singh et al. (2010) |
| TEC( K | silicene | germanene | blue phosphorene |
|---|---|---|---|
| this work | -1.0a,-5.3b | -0.43a, -2.1b | -1.0a, -4.2b |
| previous works | -7.2Huang et al. (2015) | -2.4Huang et al. (2015) | 7.8Aierken et al. (2015),-0.5Sun et al. (2016) |
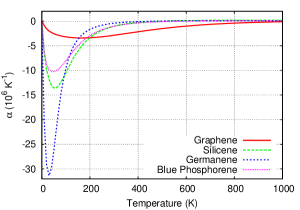
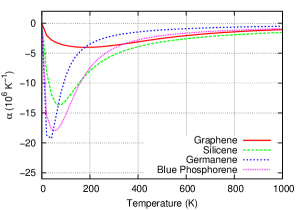
From the series of calculations, we can obtain the thermal expansion coefficients as a function of temperature using two methods. The left panel of Fig. 6 shows results from fitting the third-order Birch-Murnaghan equation of state, while the right panel shows that from the Grüneisen theory. The details of the fitting to the equation of state at representive temperatures are shown in Fig. 5.
The general trends for all the four materials are the same: starts from zero, goes down and reaches a minimum value. Afterwards, it goes up monotonically. This can be understood as follows. At low temperatures, the ZA mode populates much more than all other modes, and it has a large DOS. Thus, it dominates over other modes and contributes to negative thermal expansion due to its negative Grüneisen parameter. The ZA mode keeps dominating until certain temperature. After that, the modes with positive Grüneisen parameters get populated, and become important, consequently goes up. The temperature at which reaches its minimum is related to the temperature at which the heat capacity of ZA modes saturates to its classical value (Eq. 4). The heavier the elements, the lower this temperature.
We note that the mode Grüneisen parameter and consequently the thermal expansion coefficient are minimal change of mode frequency as a function of lattice constant and lattice constant as a function of temperature, respectively. Both are very sensitive to the calculation parameters and approximations used. Although our results from the two methods follow similar trends, they are different quantitatively. Actually, the results from fitting the equation of state depend sensitively on the range of strain applied to the material. For 2D materials, the ZA mode is soft near point. A slight compression of the lattice constant results in decrease of the phonon frequency. In practical calculations, modes near point go negative, indicating the structure is not stable (Fig. 7 inset), or the QHA used here is not valid anymore. To minimize this technical problem, one should keep the strain as small as possible. This is why a small strain of was chosen in this work. But, on the other hand, to fit the results to an equation of state, we need to have data points span in a reasonably large range of energy. Due to this difficulty, we argue that it is more appropriate to use the Grüneisen theory to predict the thermal expansion of 2D materials, as shown in the right panel of Fig. 6.
We have also compared the thermal expansion coefficients obtained here with previous results from DFT in Table 1 and 2. For graphene, we get similar results with Ref. Mounet and Marzari, 2005. For silicene and germanene, due to the different long wavelength cutoff used, and different -point sampling, our results are similar to, but quantitatively different from those of Ref. Huang et al., 2015. This discrepancy is acceptable. For blue phosphorene, we get negative thermal expansion coefficient of K-1 by fitting the equation of state, reasonably agree with K-1 in Ref. Sun et al., 2016. However, in Ref. Aierken et al., 2015 the authors get a positive value of K-1, much larger than ours. We believe that the large discrepancy comes from different range of strain applied. We argue that too large strain drives the system out of the valid range of QHA (Fig. 7).
IV Conclusions and Remarks
We have studied the vibrational and thermal properties of graphene, silicene, germanene and blue phosphorene using first-principles calculations based on QHA. We have shown that the similarities and differences of their vibrational and thermal properties can be traced back to their structures. We find that all the materials considered show negative thermal expansion at room temperature. Our findings are useful in the design of VDW heterostructures, where different 2D materials are vertically stacked together. Finally, from the numerical point of view, we argue that, the calculated thermal expansion coefficients depend sensitively on the strain applied to the material due to the soft ZA mode of the 2D materials. Thus, it is more appropriate to use the Grüneisen theory to study thermal expansion in 2D materials. Meanwhile, more advanced method going beyond the QHA is needed for more accurate prediction of thermal expansion coefficient in these 2D materials. Molecular dynamics simulation can in principle take into account the full anharmonic interactions, and serves as a possible solution to the problem. But the computational cost is huge in order to get accurate thermal expansion coefficient. We are aware of only one work using this approachPozzo et al. (2011).
It is worth mentioning that, here all the calculations are done for single layer without including the substrate. For supported monolayer, the interaction between the layer and the substrate removes the translational invariance of the monolayer. point frequencies of all modes become nonzero. The absolute values of the negative Grüneisen parameters becomes smaller. As a result, the thermal expansion at room temperature becomes less negative or even positive. The effect of the substrate on the thermal expansion of graphene nanoribbon has been studied in Ref. Jiang et al., 2009b; Pozzo et al., 2011. One should keep this fact in mind when comparing theoretical to experimental results.
For bulk materials, using Klemens modelKlemens (1958); Nika et al. (2009a, b), the phonon thermal conductivity can be estimated from the dispersion and Grüneisen parameters obtained here. For example, the phonon group velocity and density of states can be readily deduced from the dispersion relation, and the anharmonic interaction between different modes can be estimated from the Grüneisen parameters. But, for 2D materials, there are subtleties which make the estimation inaccurate. Currently, there is still ongoing debate on the size dependence of phonon thermal conductivity of 2D materialsLi et al. (2012); Xu et al. (2014). Interesting hydrodynamic phonon transport is predicted in 2D materialsCepellotti et al. (2015); Lee et al. (2015). All these make it difficult to estimate the thermal conductivity from quantities calculated in this work.
Acknowledgements.
We thank Nuo Yang and Zelin Jin for discussions. This work was supported by the National Natural Science Foundation of China (Grant Nos. 11304107, 61371015, 11274130). The authors thank the National Supercomputing Center in Shanghai for providing help in computations.References
- Novoselov et al. (2004) K. S. Novoselov, A. K. Geim, S. V. Morozov, D. Jiang, Y. Zhang, S. V. Dubonos, I. V. Grigorieva, and A. A. Firsov, Science 306, 666 (2004).
- Zhang et al. (2005) Y. Zhang, Y.-W. Tan, H. L. Stormer, and P. Kim, Nature 438, 201 (2005).
- Cahangirov et al. (2009) S. Cahangirov, M. Topsakal, E. Aktürk, H. Şahin, and S. Ciraci, Phys. Rev. Lett. 102, 236804 (2009).
- Vogt et al. (2012) P. Vogt, P. De Padova, C. Quaresima, J. Avila, E. Frantzeskakis, M. C. Asensio, A. Resta, B. Ealet, and G. Le Lay, Phys. Rev. Lett. 108 (2012).
- Feng et al. (2012) B. Feng, Z. Ding, S. Meng, Y. Yao, X. He, P. Cheng, L. Chen, and K. Wu, Nano Lett. 12, 3507 (2012).
- Li et al. (2014) L. Li, Y. Yu, G. J. Ye, Q. Ge, X. Ou, H. Wu, D. Feng, X. H. Chen, and Y. Zhang, Nat. Nanotech. 9, 372 (2014).
- Liu et al. (2014) H. Liu, A. T. Neal, Z. Zhu, Z. Luo, X. Xu, D. Tománek, and P. D. Ye, ACS Nano 8, 4033 (2014).
- Zhu and Tománek (2014) Z. Zhu and D. Tománek, Phys. Rev. Lett. 112, 176802 (2014).
- Sun et al. (2016) H. Sun, G. Liu, Q. Li, and X. Wan, Physics Letters A 380, 2098 (2016).
- Novoselov et al. (2005) K. S. Novoselov, D. Jiang, F. Schedin, T. J. Booth, V. V. Khotkevich, S. V. Morozov, and A. K. Geim, PNAS 102, 10451 (2005).
- Mak et al. (2010) K. F. Mak, C. Lee, J. Hone, J. Shan, and T. F. Heinz, Phys. Rev. Lett. 105, 136805 (2010).
- Splendiani et al. (2010) A. Splendiani, L. Sun, Y. Zhang, T. Li, J. Kim, C.-Y. Chim, G. Galli, and F. Wang, Nano Lett. 10, 1271 (2010).
- Castro Neto et al. (2009) A. H. Castro Neto, F. Guinea, N. M. R. Peres, K. S. Novoselov, and A. K. Geim, Rev. Mod. Phys. 81, 109 (2009).
- Zhu and Tománek (2014) Z. Zhu and D. Tománek, Phys. Rev. Lett. 112, 176802 (2014).
- Geim and Grigorieva (2013) A. K. Geim and I. V. Grigorieva, Nature 499, 419 (2013).
- Gupta et al. (2015) A. Gupta, T. Sakthivel, and S. Seal, Prog. Mater. Sci. 73, 44 (2015).
- Jiang and Park (2014) J.-W. Jiang and H. S. Park, Nat. Commun. 5, 4727 (2014).
- Nika et al. (2015) D. L. Nika, Z. Yan, and A. A. Balandin, IET Circuits, Devices & Systems 9, 4 (2015).
- Nika and Balandin (2012) D. L. Nika and A. A. Balandin, J. Phys.: Condens. Matter 24, 233203 (2012).
- Balandin (2011) A. A. Balandin, Nat. Mater. 10, 569 (2011).
- Yang et al. (2012) N. Yang, X. Ni, J.-W. Jiang, and B. Li, Appl. Phys. Lett. 100, 093107 (2012).
- Tao et al. (2015) L. Tao, E. Cinquanta, D. Chiappe, C. Grazianetti, M. Fanciulli, M. Dubey, A. Molle, and D. Akinwande, Nat. Nanotech. 10, 227 (2015).
- Schelling and Keblinski (2003) P. K. Schelling and P. Keblinski, Phys. Rev. B 68, 035425 (2003).
- Mounet and Marzari (2005) N. Mounet and N. Marzari, Phys. Rev. B 71, 205214 (2005).
- Aierken et al. (2015) Y. Aierken, D. Cakir, C. Sevik, and F. M. Peeters, Phys. Rev. B 92, 081408 (2015).
- Gan et al. (2015) C. K. Gan, J. R. Soh, and Y. Liu, Phys. Rev. B 92, 235202 (2015).
- Huang et al. (2015) L.-F. Huang, P.-L. Gong, and Z. Zeng, Phys. Rev. B 91, 205433 (2015).
- Huang et al. (2014) L. F. Huang, P. L. Gong, and Z. Zeng, Phys. Rev. B 90, 045409 (2014).
- Sevik (2014) C. Sevik, Phys. Rev. B 89, 035422 (2014).
- Cai et al. (2014) Y. Cai, J. Lan, G. Zhang, and Y.-W. Zhang, Phys. Rev. B 89, 035438 (2014).
- Ding and Wang (2015) Y. Ding and Y. Wang, J. Phys. Chem. C 119, 10610 (2015).
- Jiang et al. (2009a) J.-W. Jiang, J.-S. Wang, and B. Li, Phys. Rev. B 80, 205429 (2009a).
- Pozzo et al. (2011) M. Pozzo, D. Alfè, P. Lacovig, P. Hofmann, S. Lizzit, and A. Baraldi, Phys. Rev. Lett. 106, 135501 (2011).
- Kresse and Furthmüller (1996a) G. Kresse and J. Furthmüller, Comput. Mater. Sci. 6, 15 (1996a).
- Kresse and Furthmüller (1996b) G. Kresse and J. Furthmüller, Phys. Rev. B 54, 11169 (1996b).
- Perdew et al. (1996) J. P. Perdew, K. Burke, and M. Ernzerhof, Phys. Rev. Lett. 77, 3865 (1996).
- Togo et al. (2008) A. Togo, F. Oba, and I. Tanaka, Phys. Rev. B 78, 134106 (2008).
- Togo and Tanaka (2015) A. Togo and I. Tanaka, Scripta Mater. 108, 1 (2015).
- Lifshitz (1952) I. Lifshitz, Zh. Eksp. Teor. Fiz 22, 475 (1952).
- Wirtz and Rubio (2004) L. Wirtz and A. Rubio, Solid State Commun. 131, 141 (2004).
- Dubay and Kresse (2003) O. Dubay and G. Kresse, Phys. Rev. B 67, 035401 (2003).
- Kong et al. (2009) B. D. Kong, S. Paul, M. B. Nardelli, and K. W. Kim, Phys. Rev. B 80, 033406 (2009).
- Yan et al. (2008) J.-A. Yan, W. Y. Ruan, and M. Y. Chou, Phys. Rev. B 77, 125401 (2008).
- Cheng et al. (2011) Y. C. Cheng, Z. Y. Zhu, G. S. Huang, and U. Schwingenschlögl, Phys. Rev. B 83, 115449 (2011).
- Mohiuddin et al. (2009) T. M. G. Mohiuddin, A. Lombardo, R. R. Nair, A. Bonetti, G. Savini, R. Jalil, N. Bonini, D. M. Basko, C. Galiotis, N. Marzari, K. S. Novoselov, A. K. Geim, and A. C. Ferrari, Phys. Rev. B 79, 205433 (2009).
- Ding et al. (2010) F. Ding, H. Ji, Y. Chen, A. Herklotz, K. Dörr, Y. Mei, A. Rastelli, and O. G. Schmidt, Nano Lett. 10, 3453 (2010).
- Bao et al. (2009) W. Bao, F. Miao, Z. Chen, H. Zhang, W. Jang, C. Dames, and C. N. Lau, Nat. Nanotechnol. 4, 562 (2009).
- Yoon et al. (2011) D. Yoon, Y.-W. Son, and H. Cheong, Nano Lett. 11, 3227 (2011).
- Singh et al. (2010) V. Singh, S. Sengupta, H. S. Solanki, R. Dhall, A. Allain, S. Dhara, P. Pant, and M. M. Deshmukh, Nanotechnol. 21, 165204 (2010).
- Jiang et al. (2009b) J.-W. Jiang, J.-S. Wang, and B. Li, Phys. Rev. B 80, 205429 (2009b).
- Klemens (1958) P. Klemens, in Solid State Physics, Vol. 7, edited by F. Seitz and D. Turnbull (Academic Press, 1958) pp. 1–98.
- Nika et al. (2009a) D. L. Nika, E. P. Pokatilov, A. S. Askerov, and A. A. Balandin, Phys. Rev. B 79, 155413 (2009a).
- Nika et al. (2009b) D. L. Nika, S. Ghosh, E. P. Pokatilov, and A. A. Balandin, Appl. Phys. Lett. 94, 203103 (2009b).
- Li et al. (2012) N. Li, J. Ren, L. Wang, G. Zhang, P. Hänggi, and B. Li, Rev. Mod. Phys. 84, 1045 (2012).
- Xu et al. (2014) X. Xu, L. F. C. Pereira, Y. Wang, J. Wu, K. Zhang, X. Zhao, S. Bae, C. Tinh Bui, R. Xie, J. T. L. Thong, B. H. Hong, K. P. Loh, D. Donadio, B. Li, and B. Özyilmaz, Nat. Commun. 5, 3689 (2014).
- Cepellotti et al. (2015) A. Cepellotti, G. Fugallo, L. Paulatto, M. Lazzeri, F. Mauri, and N. Marzari, Nat. Commun. 6, 6400 (2015).
- Lee et al. (2015) S. Lee, D. Broido, K. Esfarjani, and G. Chen, Nat. Commun. 6, 6290 (2015).