Nonconservative Mass Transfer in Massive Binaries and the Formation of Wolf-Rayet+O Binaries
Abstract
The mass transfer efficiency during the evolution of massive binaries is still uncertain. We model the mass transfer processes in a grid of binaries to investigate the formation of Wolf-Rayet+O (WR+O) binaries, taking into account two kinds of non-conservative mass transfer models: Model I with rotation-dependent mass accretion and Model II of half mass accretion. Generally the mass transfer in Model I is more inefficient, with the average efficiency in a range of and for Case A and Case B mass transfer, respectively. We present the parameter distributions for the descendant WR+O binaries. By comparing the modeled stellar mass distribution with the observed Galactic WR+O binaries, we find that highly non-conservative mass transfer is required.
1 Introduction
Wolf-Rayet (WR) stars are massive helium burning stars, formed either through stellar wind mass loss (e.g., Meynet & Maeder, 2003; Eldridge et al., 2008; Sander et al., 2012) or mass transfer in a binary system (e.g., Wellstein et al., 2001; Petrovic et al., 2005). Observations show that the majority of massive stars are in binary systems (Sana et al., 2012; Kobulnicky et al., 2014). The evolution of massive binaries plays a vital role in various aspects of astrophysics, and their evolutionary products are related to many interesting phenomena, e.g. type Ib/c supernovae (Podsiadlowski et al., 1992), high-mass X-ray binaries, and double compact star systems (Bhattacharya & van den Heuvel, 1991). Mass transfer in a binary can dramatically influence the evolution of the system, changing the properties of both stars and the binary orbit. During the process of Roche-lobe overflow (RLOF), the primary star loses most of its hydrogen envelope, leaving a burning helium core, while mass accretion onto the secondary star causes it to rejuvenate and spin up (Packet, 1981; Hurley et al., 2002). After the mass transfer, the binary evolves to be a WR+O system. However the mass transfer efficiency , i.e., the fraction of the transferred mass that is accreted by the secondary, still remains uncertain.
Evolutionary calculations of massive binaries involving the formation of WR+O binaries have been performed by many authors, since the pioneering works by Paczyński (1967), van den Heuvel & Heise (1972), and Vanbeveren et al. (1979). Vanbeveren (1982) considered the evolutionary scenario of massive close binaries with the primary mass between and , and showed that the mass transfer efficiency is required to be less than 0.3 in order to reproduce the observations. de Loore & de Greve (1992) investigated the evolutionary sequences of massive Case B binary systems with primary masses with the assumption of . Wellstein et al. (2001) presented the evolution calculations of massive binaries with conservative mass transfer, they found that none of the observed WR+O binaries can fit the calculated results. Petrovic et al. (2005) explored the progenitor evolution of three WR+O binaries with the WR/O mass ratio of and the orbital periods of days, and concluded that the mass transfer must have be highly non-conservative. More recently, de Mink et al. (2007) followed about binary evolutionary tracks with the primary mass of and the orbital period of days. By comparing the non-conservative models tend to better match the observed mass-transferring binaries in the Small Magellanic Cloud. In our previous work (Shao & Li, 2014), we evolved a large number of binary systems and adopted three different mass transfer models, from highly non-conservative to quasi-conservative, to derive the parameter spaces of avoiding the occurrence of contact binaries. We showed that, an efficiency of 0.5 is required to be consistent with the observed Be/X-ray binaries with a neutron star, while the binary systems hosting a black-hole favors the less efficient mass transfer model.
In this work, we revisit the evolution of massive binaries. We attempt to use the observed Galactic WR+O binaries to constrain the possible formation channels of these binaries, especially the mass transfer efficiency. The remainder of this paper is organized as follows. In Section 2, We introduce the binary evolution code and the adopted assumptions. We present our calculated results in Section 3, and discuss their implications in Section 4.
2 Binary Evolution Code and Method
We use an updated version of the stellar evolution code originally developed by Eggleton (1971, 1972) (see also Pols et al., 1995) to calculate the binary evolution. We employ the TWIN mode in the code to model the structure and spin of both stars simultaneously (Yakut & Eggleton, 2005). We adopt the initial solar chemical compositions (i.e., , , and ), and the ratio of the mixing length to the pressure scale height and the convective overshooting parameter to be 2.0 and 0.12 (Schröder, 1997), respectively. For the pre-WR stars, we employ the wind mass loss rates of de Jager et al. (1988), except for OB stars for which we adopt the modelled rates of Vink et al. (2001). For the WR stars [, , , we use the rates of Nugis & Lamers (2000). When all of hydrogen envelope of the primary is stripped away by mass transfer and stellar winds, the code will be artificially broken down. The spin-orbit coupling due to tidal interactions is treated according to Hut (1981). The mass transfer rate via RLOF in the code is calculated from the potential difference
| (1) |
where and are the mass coordinate and the stellar radius, respectively, by integrating the above equation over all the mesh points outside the RL surface potential.
The stability of the mass transfer depends on how much and how fast the secondary can accrete without getting out thermal equilibrium (Hurley et al., 2002, and references therein). Unstable mass transfer would result in the formation of a contact binary (Nelson & Eggleton, 2001), which may finally evolve to a merger. Since accretion of a small amount of mass can accelerate the star to reach critical rotation (Packet, 1981), it is expected that, during most of the mass transfer phase, the accreting star is rapidly rotating, and it is of vital importance to determine the mass accretion efficiency for such a star (Langer, 1998; Petrovic et al., 2005; de Mink et al., 2009; Stancliffe & Eldridge, 2009). Considering the large uncertainty in this point, Shao & Li (2014) constructed three models to model the influence of mass loss on the stability of mass transfer. In Model I, the mass accretion rate onto a rotating star was assumed to be the mass transfer rate multiplying an ad hoc factor , where is the angular velocity of the secondary and is its critical value. The stellar rotation was treated as rigid body, which controlled by spin up due to mass accretion and the spin-orbit coupling through tidal interactions; in model II, the mass accretion efficiency was fixed to be ; in Model III, the mass accretion rate was assumed to be limited by a factor of , where denotes the mass transfer timescale and is the thermal timescale of the secondary (Hurley et al., 2002). As a result of rapid mass accretion, the secondary star would get out of thermal equilibrium, expand and become overluminous. The thermal timescale of the secondary would be significantly decreased, so that the mass transfer was generally quasi-conservative. Since previous studies have already disfavored conservative mass transfer in massive binaries, in present study we only consider Models I and II in our calculations. We assume that the part of the material that is not accreted by the secondary is ejected from the system in the form of isotropic wind, taking away the specific angular momentum of the secondary.
3 Binary Evolutionary Sequences
We have calculated a series of binary evolutionary sequences with different values of the initial parameters. The initial primary mass (in units of ), mass ratio and orbital period (in units of days) are set as follow,
Both the binary components are zero-age main-sequence stars at the beginning of binary evolution. If the initial orbital period is so short that the primary has filled its RL, we skip to the next longer orbital period.
There are several ways to produce a WR+O binary. (1) If the initial orbital period is around a few days, RLOF begins when the primary has a burning hydrogen core with Case A mass transfer. After the main-sequence evolution, the primary experiences a rapid contraction due to the depletion of fuel in the convective core, causing the binary to be detached. When the primary expands due to shell hydrogen burning and fills its RL once more, Case AB mass transfer takes place. After the mass transfer, the primary has lost most of its hydrogen envelope, leaving a helium core burning WR star. At that time the secondary is a main-sequence O star with an increased mass due to mass accretion. (2) If the initial orbital period is several weeks, the primary is in the shell hydrogen burning phase when RLOF starts. After this Case B mass transfer, the primary becomes a WR star. (3) If the initial orbital period is of the order of years, there is Case C mass transfer when the primary fills its RL during helium shell burning. The mass transfer proceeds on a dynamical timescale, and common envelope evolution may follow, which will not be investigated in this work.
Based on the spectra features, WR stars can be divided into four subtypes: the nitrogen sequence, WNH (or WNh) and WN, with strong lines of nitrogen; the carbon sequence, WC, with strong lines of carbon; the oxygen sequence, WO, with strong lines of oxygen. The H or h indicates WN stars with hydrogen. During the WR phase, the stellar mass decreases as a consequence of a powerful stellar wind (Hamann et al., 1995; Nugis & Lamers, 2000), and the masses of WC stars are statistically less than the WN masses (see Crowther, 2007, for a review). For the WC and WO stars, there is growing evidence that they are both in the similar evolution phases of post helium burning, but at different surface temperatures and initial mass ranges (Sander et al., 2012; McClelland & Eldridge, 2016). In our calculations, we only focus on the formation of WR+O binaries involving a WN star.
3.1 Examples of Binary Evolution
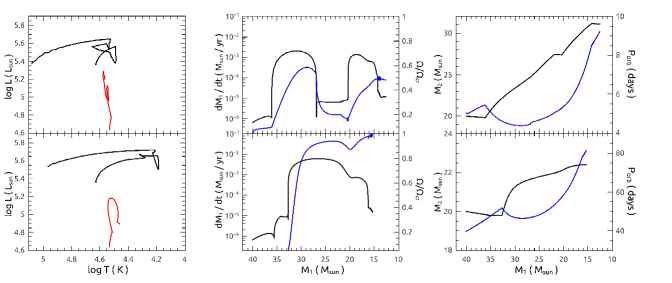
To illustrate the detailed evolutionary sequences, in Fig. 1 we show the evolutionary tracks of a binary in Model I with the initial parameters of and , and the orbital periods of 5 (top panel) and 40 days (bottom panel), corresponding to the Case A and Case B mass transfer, respectively. The left, middle, and right panels show the evolution of the binary in the Hertzsprung-Russell (H-R) diagram, the mass loss rate and the value of the secondary, and the secondary mass and the orbital period, respectively. Prior to the mass transfer, the primary has lost part of its mass due to the stellar wind, which results in a slight widening of the binary orbit (in the blue curve). In the top panel, the mass transfer starts at the age of Myr, when the primary is still on the main-sequence. The mass transfer occurs at a rate of several on the thermal timescale of the primary. About material is transferred in this rapid Case A phase, and both the components roughly have similar mass of . After that the mass transfer rate declines to several . In this slow Case A mass transfer phase, the mass transfer is driven by the nuclear evolution of the primary. When core hydrogen is exhausted, the primary has a mass of . It attempts to expand because the hydrogen shell ignites, leading to the Case AB mass transfer. The mass transfer rate is . Most of the hydrogen envelope is transferred during this phase, leaving a helium burning star. After mass transfer, the primary mass decrease to only due to the WR stellar wind (at a rate of ). The orbital period finally grows to about 9 days. The secondary mass (in the black curve) reaches to by accreting material during the whole mass transfer phase. The always and has a large fluctuation, which can be low to in the slow Case A mass transfer phase. The average mass transfer efficiency is about 0.55. In the bottom panel, the primary fills its RL after the core hydrogen exhaustion at an age of 4.7 Myr. The Case B mass transfer occurs rapidly at a rate of , until the hydrogen envelope is stripped. The primary becomes a helium burning star, and then a WN star due to a stellar wind. The secondary increases its mass to , and the final orbital period is 81.5 days. During the mass transfer, the rapidly increases to be and then roughly keeps this value to the end. In this case the average mass transfer efficiency .
Figure 2 shows the same evolutionary sequences for the binary but with Model II adopted. Here half of the transferred mass is assumed to be accreted by the secondary. In the top panel, the binary leaves a WN star and a O star with days. In the bottom panel, the resulting secondary star is much more massive than that in Model I. After the mass transfer, the system possesses a WN+O binary with , and days.
3.2 Parameter distributions of WN+O binaries
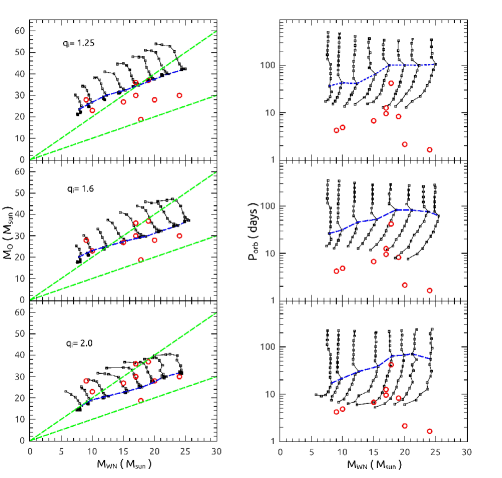
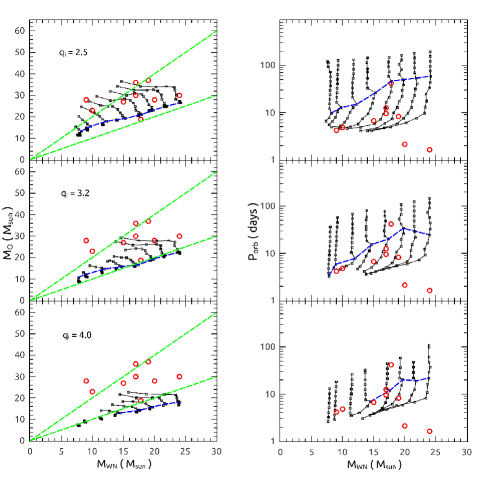
Transfer of mass and angular momentum in massive binaries can greatly influence the properties of the formed WN+O system. Figures 3 and 4 show the calculated mass of the O star and the orbital period as a function of the mass of the WN star in Model I. The panels from top to bottom correspond to the results with increasing mass ratio . In each panel, the black curves from left to right represent the cases with the primary mass increasing from to with an interval of . The squares in each of these curves indicate the WN+O binaries that have formed with different . The blue dashed curves are used to distinguish Case A and Case B mass transfer. The two green dashed lines indicate the mass ratios and 1.0. The red circles represent the nine observed WN+O binaries with known binary parameters from the WR catalogue (van der Hucht, 2001; Rosslowe & Crowther, 2015). Their basic parameters are listed in Table 1.
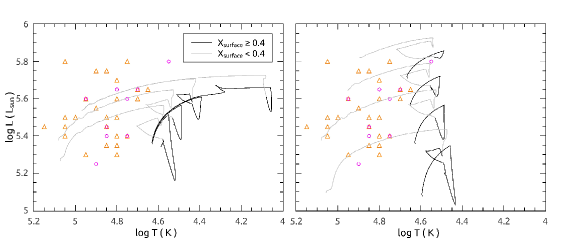
Fig. 5 presents the evolutionary tracks of the primary in the H-R diagram. The left and right panels correspond to the binary systems with and increasing initial orbital periods, and with days and increasing initial primary masses, respectively. The black and gray lines donate the primaries with the mass fraction of surface hydrogen and , respectively. The circle symbols denote the observed Galactic WN stars with detectable hydrogen, and the triangle symbols refer to the hydrogen-free stars. The data of the WN stars with is taken (Hamann et al., 2006; Sander et al., 2012). We can see that the modelled tracks can generally cross the observed distribution, the calculated WN stars seem to have higher surface temperatures than observed, envelope inflation may be the reason for this discrepancy (Hamann et al., 2006; Yoon et al., 2012; Sander et al., 2012). Here we assume that the calculated and observed WN+O binaries are in the similar evolutionary states, the parameter distribution of WN+O binaries can be used to constrain the progenitor evolution (see Eldridge, 2009, for an example).
The formation of WN+O binaries depends on the stability of mass transfer and hence the initial mass ratio. Generally the larger the initial mass ratios , the smaller the parameter spaces for stable mass transfer. Systems with may evolve to WN+O binaries only when the initial binary orbital periods are larger than about 4 days (Shao & Li, 2014). Figures 3 and 4 show that the WN/O mass ratios increase (up to ) but the orbital periods decrease with increasing initial mass ratio. The minimum of the orbital periods is days.
In Fig. 6 we present the calculated parameter distributions of WN+O binaries in Model II, which requires the maximum initial mass ratio to be , smaller than in Model I. The WN/O mass ratios can reach for systems with . The calculated orbital periods generally days.
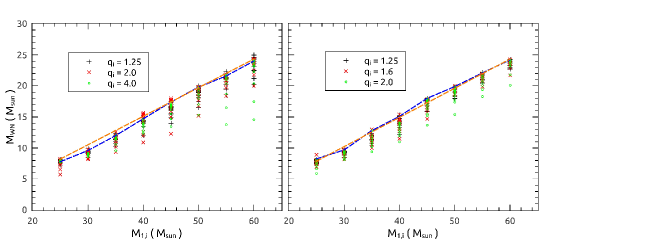
Depending on the initial orbital periods, the binary systems may experience Case A or Case B mass transfer in the evolution. In the former case, when the initial orbital period is longer, the primary can develop a heavier core before the mass transfer, resulting in a more massive WN star. In the latter case the produced WN mass is not sensitive to the initial period, since the primary evolves as a single star during the core hydrogen burning phase without any interaction with the secondary (see also Petrovic et al., 2005). This is clearly demonstrated in Fig. 7, which shows the calculated WN mass as a function of the initial primary masses in Models I (left) and II (right). While the masses of WN stars evolved from case A mass transfer significantly depend on the initial orbital periods, systems with Case B mass transfer tend to produce WN stars with similar masses. For latter binaries, we derive a relation between the masses of the initial primary stars and the WN stars as follows
| (2) |
in Model I, and
| (3) |
in Model II. These results are close to the relation given by Wellstein & Langer (1999) for the systems with quasi-conservative Case B mass transfer.
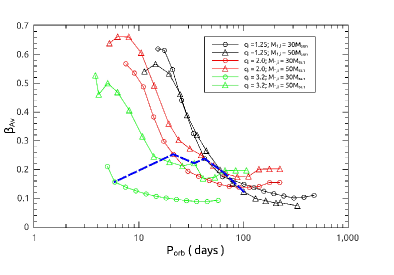
Fig. 8 shows the average mass transfer efficiencies as a function of the orbital periods of the WN+O binaries in Model I. We use different symbols to indicate the binaries with different initial parameters. The blue dashed curve distinguishes Case A and Case B mass transfer. We can find that decreases with increasing orbital period, in the range of for Case A mass transfer and for Case B mass transfer. Mass accretion tends to spin up the secondary, while the tidal interactions in close binaries attempt to synchronize the spin with the binary orbit. So systems with shorter orbits have higher mass transfer efficiency, and the mass transfer in the binaries with wider orbits are less efficient.
4 Discussion
Our calculations demonstrate the possible distribution of the parameters of WN+O binaries. In Model I the binaries contain a WN star of mass and an OB main sequence star of mass with orbital period ranging from about 3 days to several hundred days (see Fig. 3 and 4). In Model II, the binaries contain a WN star of mass and an O star of mass with orbital period longer than days (see Fig. 6).
These results can be compared with observed WN+O binaries to constrain the input parameters and mechanisms adopted. We first note that conservative evolution produces WN+O systems with extremely low mass ratios () and orbital periods much longer than observed (Wellstein et al., 2001). Non-conservative mass transfer can effectively decrease both the masses of the O stars and the orbital periods via mass and angular momentum loss. The average mass transfer efficiency in Model I varies with a large range. It can reach for Case A mass transfer, because tidal interactions spin down the secondary so it can keep accreting a substantial amount of the mass. For case B mass transfer, is lower than about 0.2 because the tidal effect is negligible in wide binaries. So the secondary can keep rapid rotation after being spun up during the initial mass accretion phase, and most of the transferred material is ejected out of the binary. In the plane of Figs. 3 and 4, all of the observed WN+O binaries can be well covered with in model I. In Model II the modeled O stars are considerably more massive than that in Model I and observations.
The mass transfer efficiency can be strongly constrained by the parameters of the binary WR 35a. The estimated masses of the binary component are for the WN star and for the O star, and the orbital period is 41.9 days (Gamen et al., 2014). From Eq. (2) or (3), we can infer that the initial mass of the primary star should be , so . The WN/O mass ratio of (Gamen et al., 2014) disfavors Model II for the formation of such WN+O binaries, implying that the accreted mass by the O star is very small. During Case B mass transfer in Model I most of the transferred material can be expelled, leading to binaries with relatively large WN/O mass ratios. So the progenitor binary is very likely to have experienced highly non-conservative mass transfer.
Our results are compatible with previous studies. Petrovic et al. (2005) investigated the formation of WR 21, WR 127 and WR 153ab. They pointed out that these systems can be produced only if the mass transfer is highly non-conservative, with only of the transferred mass being retained by the mass gainer. In our calculations, these binaries can be formed in Model I with inefficient mass transfer if the initial mass ratios and the mass transfer efficiency is . Binary evolution in Model II may produce such binaries only when the . de Mink et al. (2007) suggested that binaries with smaller initial orbital periods evolve more conservatively than wider systems, which is also in agreement with our results of Model I (see Fig. 8).
The systems WR 151 and WR 155 have the large WN/O mass ratios of and the short orbital periods of days, these two binaries may be formed through unstable Case C mass transfer. Alternatively we only assume that the initial binary systems have circular orbits, the mass transfer in highly eccentric binaries may also contribute to produce these short periods (Dosopoulou & Kalogera, 2016a, b). In some binaries, the O stars have been observed to rotate faster than synchronous rotation (Massey, 1981; Underhill et al., 1988; Baade et al., 1990; Marchenko et al., 1994; shara et al., 2015), suggesting that the progenitors have experienced stable mass transfer rather than contact phases or common envelope evolution. Further observations on the spins of the O stars in massive binaries (e.g., de Mink et al., 2013) can help understand the formation of WN+O binaries.
In summary, our calculations demonstrate that massive binary evolution with rotation-dependent mass transfer model can satisfactorily match the observations of WN+O binaries.
References
- Baade et al. (1990) Baade, D., Schmutz, W., & van Kerkwijk, M. 1990, A&A, 240, 105
- Bhattacharya & van den Heuvel (1991) Bhattacharya, D., & van den Heuvel, E. P. J. 1991, Phys. Rev., 203, 1
- Crowther (2007) Crowther, P. 2007, ARA&A, 45, 177
- de Jager et al. (1988) de Jager, C., Nieuwenhuijzen, H., & van der Hucht, K. A. 1988, A&A, 72, 259
- de Loore & de Greve (1992) de Loore, C., & de Greve, J. P. 1992, A&AS, 94, 453
- de Mink et al. (2007) de Mink, S. E., Pols, O. R., & Hilditch, R. W. 2007, A&A, 467, 1181
- de Mink et al. (2009) de Mink, S. E., Pols, O. R., Langer, N., & Izzard, R. G. 2009, A&A, 507, L1
- de Mink et al. (2013) de Mink, S. E., Langer, N., Izzard, R. G., Sana, H., & de Koter, A. 2013, ApJ, 764, 166
- Dosopoulou & Kalogera (2016a) Dosopoulou, F. & Kalogera, V. 2016a, ApJ, 825, 70
- Dosopoulou & Kalogera (2016b) Dosopoulou, F. & Kalogera, V. 2016b, ApJ, 825, 71
- Eggleton (1971) Eggleton, P. P. 1971, MNRAS, 151, 351
- Eggleton (1972) Eggleton, P. P. 1972, MNRAS, 156, 361
- Eldridge et al. (2008) Eldridge, J.J., Izzard, R. & Tout, C. 2008, MNRAS, 384, 1109
- Eldridge (2009) Eldridge, J.J. 2009, MNRAS, 400, L20
- Gamen et al. (2014) Gamen, R., Collado, A., Barbá, R., Chené, A.-N., & St-Louis, N. 2014, A&A, 562, 13
- Hamann et al. (1995) Hamann, W.-R., Koesterke, L., & Wessolowski, U. 1995, A&A, 299, 151
- Hamann et al. (2006) Hamann, W.-R., Gräfener, G., & Liermann, A. 2006, A&A, 457, 1015
- Hurley et al. (2002) Hurley, J. R., Tout, C. A., & Pols, O. R. 2002, MNRAS, 329, 897
- Hut (1981) Hut P., 1981, A&A, 99, 126
- Kobulnicky et al. (2014) Kobulnicky, H. A., Kiminki, D. C., Lundquist, M. J., Burke, J., Chapman, J. et al. 2014, ApJS, 213, 34
- Lamontagne et al. (1996) Lamontagne, R., Moffat, A., Drissen, L. et al. 1996, AJ, 112, 2227
- Langer (1998) Langer, N. 1998, A&A, 329, 551
- Marchenko et al. (1994) Marchenko, S. V., Moffat, A. F. J., & Koenigsberger, G. 1994, ApJ, 422, 810
- Massey (1981) Massey, P. 1981, ApJ, 244, 157
- McClelland & Eldridge (2016) McClelland, L. A. S. & Eldridge, J.J. 2016, MNRAS, 459, 1505
- Meynet & Maeder (2003) Meynet, G. & Maeder, A. 2003, A&A, 404, 975
- Nelson & Eggleton (2001) Nelson, C. A. & Eggleton, P. P. 2001, ApJ, 552, 664
- Nugis & Lamers (2000) Nugis, T. & Lamers, H. 2000, A&A, 360,227
- Packet (1981) Packet, W., 1981, A&A, 102, 17
- Paczyński (1967) Paczyński, B. 1967, Acta Astron., 17, 355
- Petrovic et al. (2005) Petrovic, J., Langer, N., & van der Hucht, K. A. 2005, A&A, 435, 1013
- Podsiadlowski et al. (1992) Podsiadlowski, P., Joss, P. C., & Hsu, J. J. L. 1992, ApJ, 391, 246
- Pols et al. (1995) Pols, O. R., Tout, C. A., Eggleton, P. P., & Han Z., 1995, MNRAS, 274, 964
- Rosslowe & Crowther (2015) Rosslowe, C. & Crowther, P. 2015, MNRAS, 447, 2322
- Sana et al. (2012) Sana, H., de Mink, S. E., de Koter, A., et al. 2012, Science, 337, 444
- Sander et al. (2012) Sander, A., Hamann, W.-R. & Todt, H. 2012, A&A, 540, 144
- Schröder (1997) Schröder, K., Pols, O. R., & Eggleton, P. P. 1997, MNRAS, 285, 696
- Shao & Li (2014) Shao, Y., & Li, X.-D. 2014, ApJ, 796, 37
- shara et al. (2015) shara, M., Crawford, S., Vanbeveren, D., Moffat, A., Zurek, D., & Crause, L. 2015, arXiv:1511.00046
- Stancliffe & Eldridge (2009) Stancliffe, R. & Eldridge, J. 2009, MNRAS, 396, 1699
- Underhill et al. (1988) Underhill, A. B., Yang, S., & Hill, G. M. 1988, PASP, 100, 1256
- Vanbeveren et al. (1979) Vanbeveren, D., de Greve, J. P., de Loore, C., & van Dessel, E. L. 1979, A&A, 73, 19
- Vanbeveren (1982) Vanbeveren, D. 1982, A&A, 105, 260
- van den Heuvel & Heise (1972) van den Heuvel, E. P. J., & Heise, J. 1972, Nature Phys. Sci., 239, 67
- van der Hucht (2001) van der Hucht, K. A. 2001, New Astron. Rev., 45, 135
- Vink et al. (2001) Vink, J. S., de Koter, A., & Lamers, H. J. G. L. M. 2001, A&A, 369, 574
- Wellstein & Langer (1999) Wellstein, S., & Langer, N. 1999, A&A, 350, 148
- Wellstein et al. (2001) Wellstein, S., Langer, N., & Braun, H. 2001, A&A, 369, 939
- Yakut & Eggleton (2005) Yakut, K. & Eggleton, P. P. 2005 ApJ, 629, 1055
- Yoon et al. (2012) Yoon, S.-C., Gräfener, G., Vink, J. S., Kozyreva, A., Izzard, R. G 2012, A&A, 544, L11

| WR number | HD/name | Spectral Types | (days) | |||
|---|---|---|---|---|---|---|
| WR 21 | HD 90657 | WN5+O4-6 | 8.25 | 19 | 37 | 0.52 |
| WR 31∗ | HD 94546 | WN4+O8V | 4.83 | 10 | 23 | 0.43 |
| WR 35a | SMSP 5 | WN6+O8.5V | 41.9 | 18 | 19 | 0.95 |
| WR 97∗ | HD 320102 | WN5+O7 | 12.6 | 17 | 30 | 0.56 |
| WR 127 | HD 186943 | WN3+O9.5V | 9.56 | 17 | 36 | 0.47 |
| WR 139 | HD 193576 | WN5+O6III-V | 4.21 | 9 | 28 | 0.34 |
| WR 151 | CX Cep | WN4+O5V | 2.13 | 20 | 28 | 0.71 |
| WR 153ab | HD 211853 | WN6+O6I | 6.69 | 15 | 27 | 0.54 |
| WR 155 | CQ Cep | WN6+O9II-Ib | 1.64 | 24 | 30 | 0.8 |
*-The estimated masses of binary components, from the catalogue, are extremely low for their spectral types (4 and for WR 31; 2.3 and for WR 97). We use the spectral masses of the O stars suggested by Lamontagne et al. (1996) and derive the WN masses with the mass ratios.