Pressure dependence of the band-gap energy in BiTeI
Abstract
Published version available at https://doi.org/10.1103/PhysRevB.94.165203
The evolution of the electronic structure of BiTeI, a layered semiconductor with a van der Waals gap, under compression is studied by employing semilocal and dispersion-corrected density-functional calculations. Comparative analysis of the results of these calculations shows that the band-gap energy of BiTeI decreases till it attains a minimum value of zero at a critical pressure, after which it increases again. The critical pressure corresponding to the closure of the band gap is calculated, at which BiTeI becomes a topological insulator. Comparison of the critical pressure to the pressure at which BiTeI undergoes a structural phase transition indicates that the closure of the band gap would not be hindered by a structural transformation. Moreover, the band-gap pressure coefficients of BiTeI are computed, and an expression of the critical pressure is devised in terms of these coefficients. Our findings indicate that the semilocal and dispersion-corrected approaches are in conflict about the compressibility of BiTeI, which result in overestimation and underestimation, respectively. Nevertheless, the effect of pressure on the atomic structure of BiTeI is found to be manifested primarily as the reduction of the width of the van der Waals gap according to both approaches, which also yield consistent predictions concerning the interlayer metallic bonding in BiTeI under compression. It is consequently shown that the calculated band-gap energies follow qualitatively and quantitatively the same trend within the two approximations employed here, and the transition to the zero-gap state occurs at the same critical width of the van der Waals gap.
pacs:
71.30.+h,71.20.Ps,64.30.JkBismuth tellurohalide (BiTeI) is a narrow-band-gap semiconductor at ambient pressure. Under compression, the BiTeI band gap decreases with increasing pressure, and diminishes at a critical pressure . Recent studies show that an inversion of valence band maximum (VBM) and conduction band minimum (CBM) states occurs when the applied pressure exceeds , which marks a transition to the topological insulating phase.Bahramy et al. (2012); Xi et al. (2013); Ideue et al. (2014); Park et al. (2015) This means that the band gap reopens and increases at pressures higher than . Furthermore, analysis presented in Ref. Liu and Vanderbilt, 2014 indicates that an intermediate Weyl semimetal phase is present over a narrow pressure interval around . The evolution of the electronic structure of BiTeI under compression has been experimentally explored in two optical spectroscopy studies:Xi et al. (2013); Tran et al. (2014) Tran et al. (Ref. Tran et al., 2014) reported no evidence for the band-gap reopening, whereas the infrared spectral weight of the charge carriers measured in Ref. Xi et al., 2013 exhibited a maximum, which implies the reopening of the band gap with increased pressure. On the other hand, both studiesXi et al. (2013); Tran et al. (2014) reveal that BiTeI undergoes a structural transformation at pressure 8 GPa (Ref. Xi et al., 2013) or 9 GPa (Ref. Tran et al., 2014). It was therefore suggested that the topological phase transition is hindered by a structural phase transition.Tran et al. (2014) On the theoretical side, density-functional calculations have been employed to estimate , the reported values of which range from 1.7 to 10 GPa owing to various types of approximations.Bahramy et al. (2012); Chen et al. (2013); Tran et al. (2014); Ideue et al. (2014); Park et al. (2015) It is crucial to have a reliable estimate of to see if the topological phase transition takes place before the structural phase transition occurs, which clearly depends critically on the accuracy of the equation of state (EOS). Our recent investigationGüler-Kılıç and Ç. Kılıç (2015) revealed that the inclusion of van der Waals (vdW) interactions is necessary for a reliable and truly ab initio computation of the EOS of BiTeI, which was not taken into account in the aforementioned calculations. Thus, we examine here the variation of the BiTeI band gap with pressure with the aid of dispersion-corrected density-functional (PBE-D2) calculations using the functional of Perdew, Burke, and Ernzerhof (PBE)Perdew et al. (1996) together with a semiempirical force field.Grimme (2006) In addition, we employ semilocal density-functional calculations using the PBEsolPerdew et al. (2008) functional for the purpose of comparison. It was curious to see whether the PBEsol and PBE-D2 approaches result in consistent predictions for BiTeI, which yield qualitatively similar results for systems with vdW-bonded layers.Tunega et al. (2012) Our findings indicate that the PBEsol and PBE-D2 approaches are in conflict about the compressibility of BiTeI, which nevertheless yield consistent predictions concerning the evolution of the electronic structure of BiTeI under compression, as will be revealed below.
BiTeI crystallizes in a layered trigonal structure with noncentrosymmetric space group (No. 156). Its crystal structure is characterized by the hexagonal lattice parameters and , and two internal parameters since Bi, Te, and I atoms occupy the , , and positions with fractional coordinates (0,0,0), (2/3,1/3,), and (1/3,2/3,), respectively,Shevelkov et al. (1995) cf. Ref. Güler-Kılıç and Ç. Kılıç, 2015. In this structure, adjacent (unary) layers formed by Bi, Te, and I atoms stack along the -axis, and the van der Waals (vdW) gap exists in the vacuum region between the Te and I layers. As will be clear below, our findings reveal the importance of the width of the vdW gap. Thus we investigate the effect of pressure not only on the BiTeI band structure but also on the vdW gap. To this end, we carried out crystal-structure optimizations, for which the total energy was computed as function of the unit cell volume and the lattice parameter ratio , followed by band-structure calculations. For each value of the pair (, ), the ionic positions were relaxed until the maximum value of residual forces on atoms was reduced to be smaller than 0.01 eV/Å. The total-energy and band-structure calculations were performed by employing the projector augmented-wave (PAW) method,P. E. Blöchl (1994) as implementedKresse and Joubert (1999) in the Vienna ab initio simulation package (VASP).G. Kresse and J. Furthmüller (1996) Spin-orbit coupling (SOC) was taken into account by utilizing the noncollinear mode of VASP.Hobbs et al. (2000); Marsman and Hafner (2002) The 5 and 5, 5 and 5, and 6 and 6 states are treated as valence states for tellurium, iodine, and bismuth, respectively. Plane wave basis sets were used to represent the electronic states, which were determined by imposing a kinetic energy cutoff of 325 eV. The Brillouin zone was sampled by k-point mesh in total-energy calculations, which was generated according to the Monkhorst-Pack scheme.Monkhorst and Pack (1976) Convergence criterion for the electronic self-consistency was set up to 10-6 eV (10-8 eV) in total-energy (band-structure) calculations. The parameters used for the semiempirical (van der Waals) force fieldGrimme (2006) were the same as in Ref. Güler-Kılıç and Ç. Kılıç, 2015. It should be mentioned that although we were inclined to employ a nonempirical van der Waals density functional (in lieu of the semiempirical force field) such as the optB86b-vdW functional,Klimeš et al. (2011) we unfortunately found that the crystal structure of BiTeI was not adequately described by using the optB86b-vdW functional, as discussed in the Appendix.
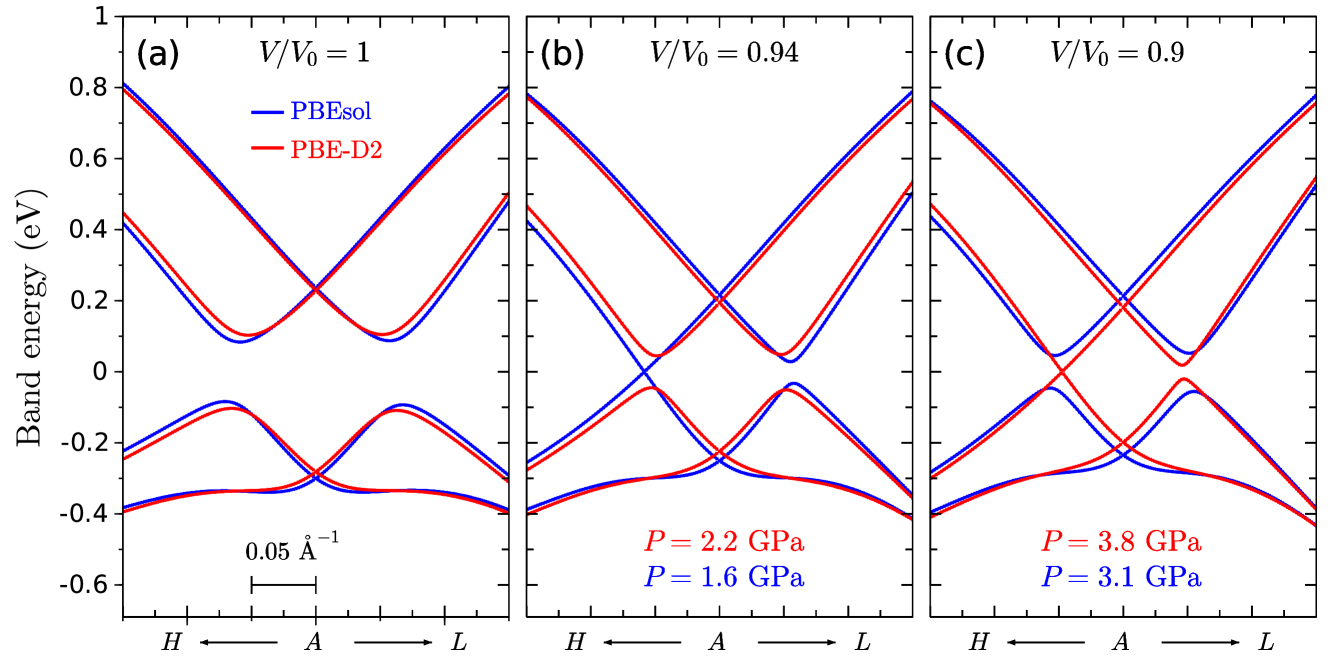
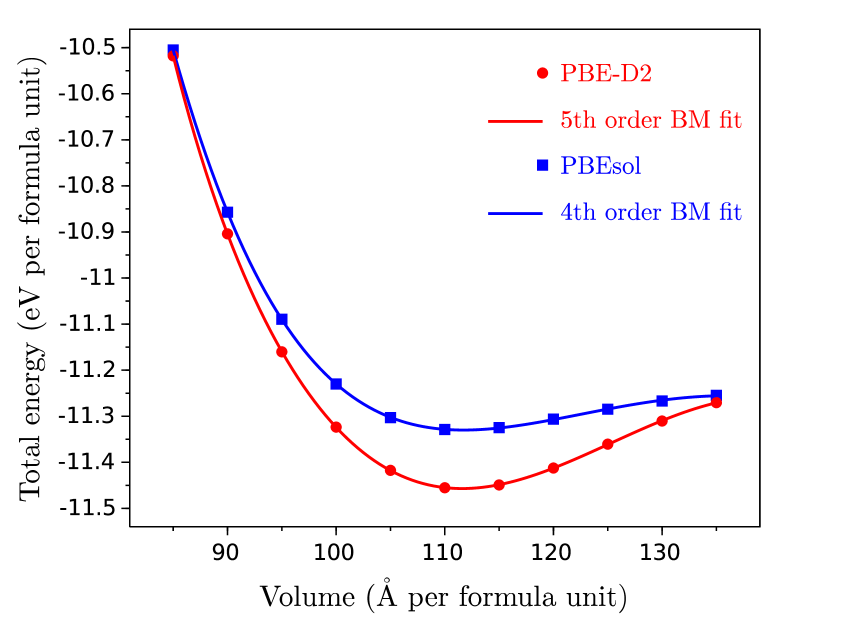
Representative results of band-structure calculations are given in Figs. 1(a)-1(c) where denotes the equilibrium value of the volume per formula unit, and is the pressure obtained from the calculated EOS (see below). It is known that SOC-induced modification of the BiTeI band edges leads to large Rashba-type splittingIshizaka et al. (2011) near the Brillouin zone point , which is visible Figs. 1(a). Furthermore, strong (weak) SOC leads to a smaller (larger) band gap as well as a greater (smaller) Rashba coupling strength.Güler-Kılıç and Ç. Kılıç (2015) The decreasing behavior of the band gap, cf. Figs. 1(a)-1(c), could therefore be partly attributed to increased SOC at higher compression, which also reflects the increase in the valence- and conduction-band width. As seen in Figs. 1(b) and 1(c), the transition to the semimetallic state occurs at a considerably lower pressure GPa [Fig. 1(b)] within the PBEsol approach, compared to the respective dispersion-corrected (PBE-D2) value of GPa [Fig. 1(c)]. It is thus hard to claim that the predicted (PBEsol and PBE-D2) values of the critical pressure agree with each other. To expound on the origin of this disagreement, we compare the calculated EOS curves to each other and to the experimental EOS. Since the calculated and experimental EOSs refer to zero and room temperature, respectively, it is appropriateGüler-Kılıç and Ç. Kılıç (2015) to use the relative volume and the normalized pressure , with denoting the bulk modulus. Thus a comparison of the versus curves is given in Fig. 2(a), where the experimental curve is clearly bracketed by the PBEsol-calculated and dispersion-corrected (PBE-D2) curves. The latter were obtained by performing (i) third-, (ii) fourth-, and (iii) fifth-order Birch-Murnaghan (BM) fits to (i) the experimental compressibility data,Xi et al. (2013) the energy-volume curve obtained via (ii) PBEsol, and (iii) PBE-D2 calculations, respectively. The higher-order BM fits are necessaryGüler-Kılıç and Ç. Kılıç (2015) to preserve the level of accuracy of the PBEsol or PBE-D2 calculations, cf. Fig. S1 (Ref. sup, ). Thus the pressure is given by
| (1) |
where , , , and is the Eulerian strain. Here , , and denote the first, second, and third pressure derivatives of the bulk modulus, respectively. The predicted values of are 111.716 Å3 (PBEsol) and 111.585 Å3 (PBE-D2), which are in close agreement with each other as well as with the experimental valueShevelkov et al. (1995) of 111.762 Å3. The calculated and experimental values of the bulk modulus and its pressure derivatives are given in Table 1. Note that the experimental values of and are bracketed by the respective PBEsol-calculated and dispersion-corrected (PBE-D2) values. It is also notable that BiTeI is significantly more compressible within the PBEsol approach, compared to the dispersion-corrected (PBE-D2) approach, since . As discussed further below, this explains why is significantly smaller than .
| PBE-D2 | 28.1 | 6.8 | -2.9 | 2.5 |
|---|---|---|---|---|
| PBEsol | 17.0 | 12.4 | -7.2 | |
| Expt. | 20.5 | 7.6 |
As explained in Ref. Liu and Vanderbilt, 2014, the BiTeI band gap is zero for with , where denotes the width of the pressure interval corresponding to the Weyl semimetal phase. Analysis presented in Ref. Liu and Vanderbilt, 2014 reveals also that one finds if is deduced only from the band dispersions along the - line in the irreducible wedge of the Brillouin zone. Thus we conducted a search over the whole Brillouin zone for a set of pressure values around the critical pressure. Although we had not attempted to deduce a precise value for , in this way we estimated upper and lower bounds for it: 0.04 GPa 0.13 GPa (PBE-D2) and 0.03 GPa 0.09 GPa (PBEsol). Clearly, the experimental observation of the Weyl semimetal phaseLiu and Vanderbilt (2014) as well as the closure of the band gap would be obstructed, cf. Ref. Tran et al., 2014, unless the applied pressure is fine tuned to this extremely narrow pressure range. We shall defer the discussion of the Weyl semimetal phase in the rest of this paper, due to the diminutiveness of .
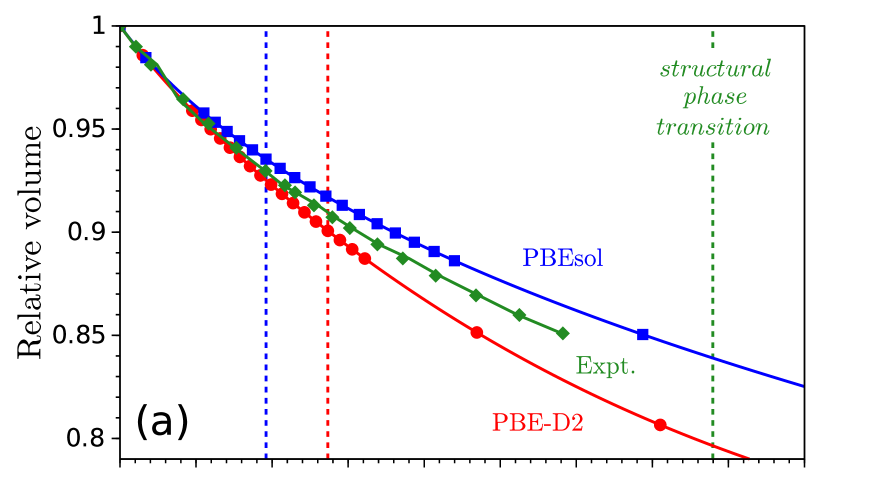
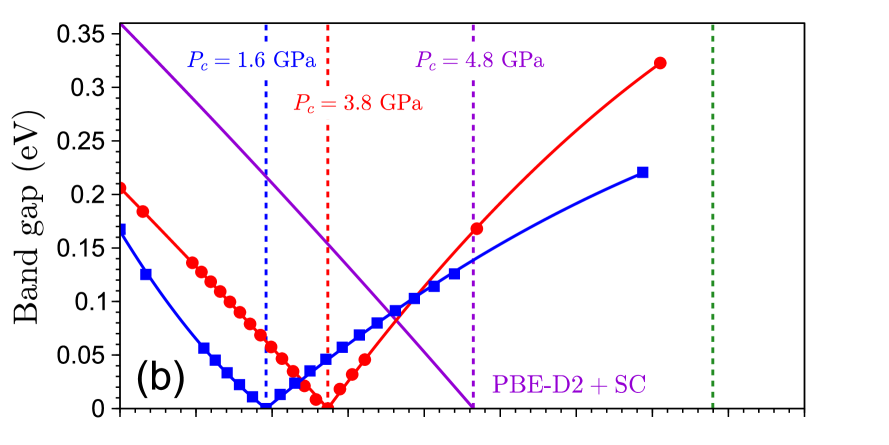
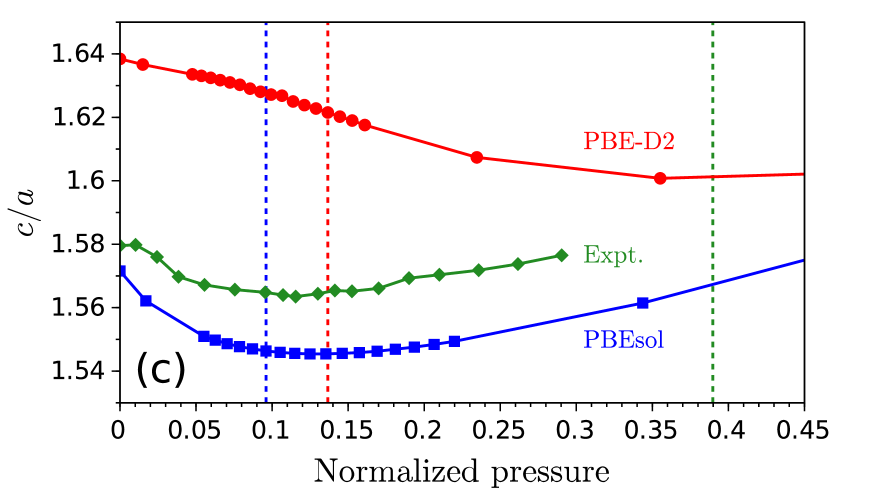
Figure 2(b) displays a plot of the band-gap energy versus the normalized pressure , which shows that the band gap diminishes at and reopens for . The predicted band gap takes the values 0.167 eV (PBEsol) and 0.206 eV (PBE-D2) at zero pressure, compared to the experimentalLee et al. (2011) value of 0.36 eV at ambient pressure. This shows that the band-gap underestimation is relatively more (less) severe within the PBEsol (PBE-D2) description. The solid symbols (blue squares and red circles) in Fig. 2(b) represent the calculated (PBEsol and PBE-D2) points. The blue and red curves passing through these points satisfy the relationship
| (2) |
where the coefficients and take different values for the cases and . The values of these coefficients are given in Table 2, which were obtained via fitting. It is noteworthy to observe that the portions of blue (PBEsol) and red (PBE-D2) curves in Fig. 2(b) are almost parallel to each other, especially in the vicinity of the critical pressure . This implies that this portion of the dispersion-corrected (PBE-D2) curve could be qualitatively reproduced by adding a constant shift to the PBEsol-calculated band-gap energies, which is known as the “scissors” correction. Encouraged by the latter, we apply the “scissors” correction to the dispersion-corrected (PBE-D2) band-gap energies by using a constant shift of 154 meV that is equal to the difference between the experimentalLee et al. (2011) and predicted values of the band gap. In Fig. 2(b) the magenta curve represents the “scissors”-corrected (PBE-D2+SC) band-gap energy as a function of the normalized pressure. It is seen that the predicted value of the critical pressure increases from to GPa as a result of applying the “scissors” correction. Thus, underestimation of the band gap by 154 meV translates to underestimating by 1 GPa. It should be emphasized that all of our estimates for are substantially smaller than , cf. Fig. 2(b). It is thus clear that the closure of the band gap would not be hindered by the structural transformation of BiTeI at .
| PBE-D2 | 206 | 3.8 | |||
| -1.565 | -0.407 | for | |||
| 1.926 | -2.057 | ||||
| PBEsol | 167 | 1.6 | |||
| -1.127 | 6.245 | for | |||
| 1.176 | -1.160 |
| PBE-D2 | -51.8 | -1.0 |
|---|---|---|
| PBEsol | -135.4 | 43.2 |
It should be noted that the band-gap pressure coefficients and are related to the coefficients introduced in Eq. (2) through and . The calculated values of and are given in Table 3. Rephrasing Eq. (2) as (for ) yields the following expression for the critical pressure:
| (3) |
The relationship given in Eq (3) implies that the value of could be obtained from the equilibrium band gap (for which the experimental value is available) and the band-gap pressure coefficients and (for which the experimental values are lacking). Thus, experimental determination of and is called for.
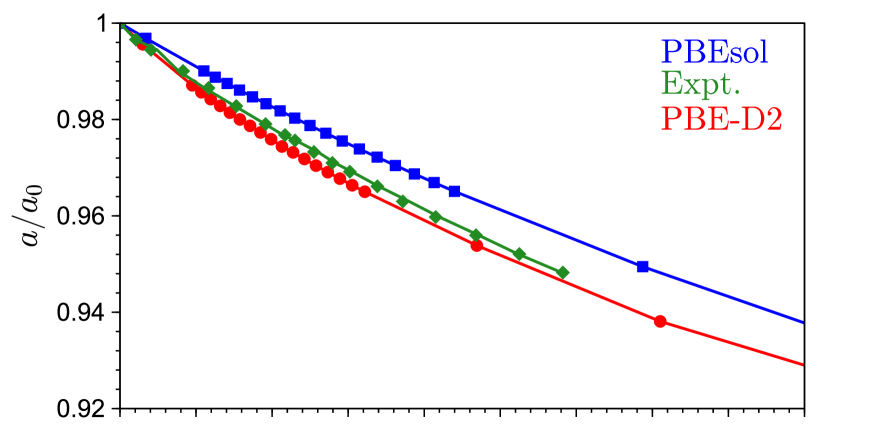
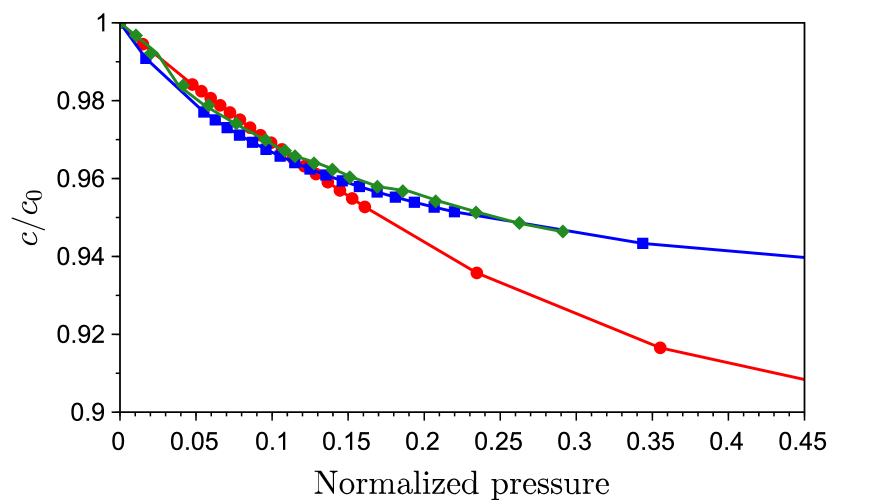
It was proposed that an observed minimum in in the pressure range of 2.0–2.9 GPa is an indicator of the topological phase transition.Xi et al. (2013); Chen et al. (2013) It is thus interesting to explore how the lattice parameter ratio varies with pressure. The plots of versus the normalized pressure are therefore given in Fig. 2(c) where the experimental values (the green diamonds) are seemingly bracketed by the blue and red curves passing through the PBEsol-calculated and dispersion-corrected (PBE-D2) points, respectively. As a matter of fact the results of PBEsol and PBE-D2 calculations are in better agreement with the experimental data in regard to the pressure variation of the lattice parameters and , respectively, cf. Fig. S2 (Ref. sup, ). It should be remarked that the PBEsol-calculated points (the blue squares) form a curve that lies virtually parallel to the experimental points, and accordingly possess a minimum. On contrary, the curve passing through the dispersion-corrected (PBE-D2) points (the red circles) shows no minimum. It is thus clear that the results of the PBEsol (PBE-D2) calculations are in line (conflict) with the experimental trend in regard to the pressure variation of the lattice parameter ratio . Despite this disagreement between the PBEsol and PBE-D2 results, the closure of the band gap at the critical pressure occurs within not only the PBEsol but also PBE-D2 description, which reveals that the pressure variation of the band gap is not in correlation with that of . A comparative inspection of Figs. 2(b) and 2(c) indeed shows that the transition to the zero-gap state does not correspond to the minimum of .
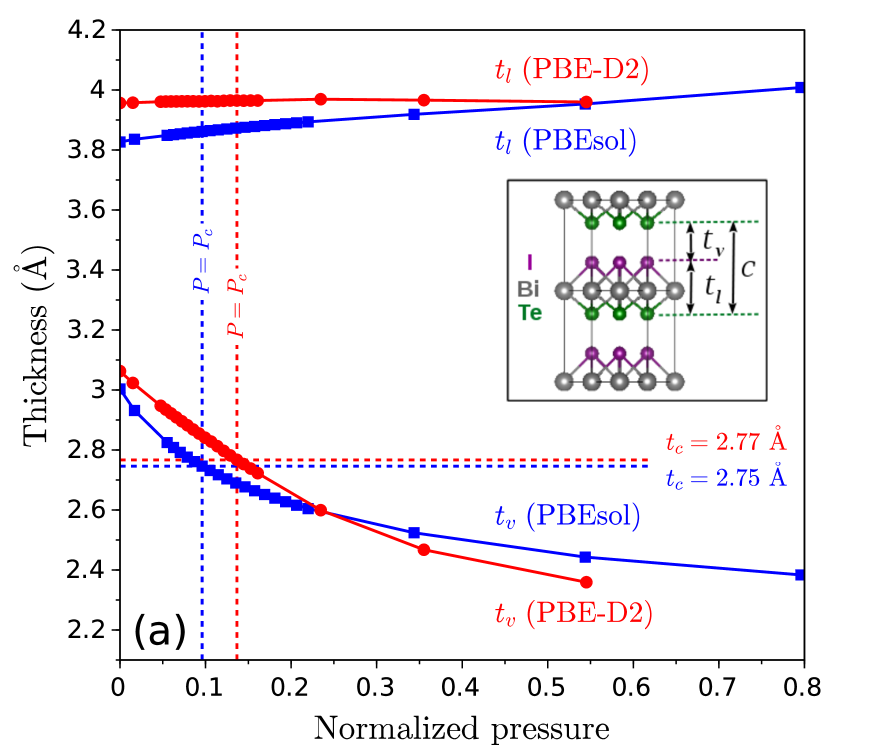
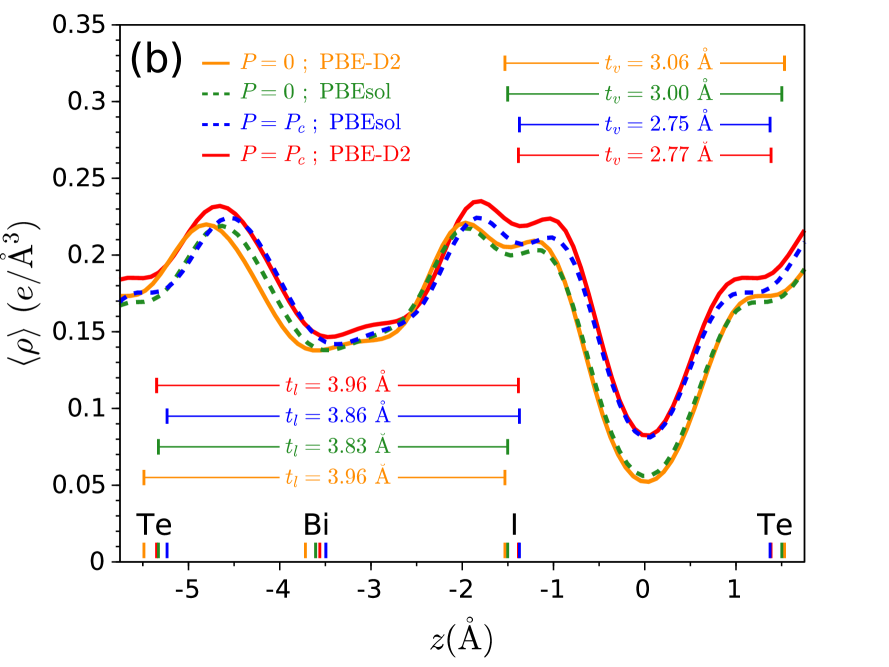
We find that the width of the vdW gap, viz. the thickness of the vacuum region, rather than the lattice parameter ratio , serves as an adequate structural parameter for studying the variation of the BiTeI band-gap energy with pressure, as will be explained now. Figure 3(a) shows the variation of and the layer thickness with the normalized pressure, where the inset displays the division of the lattice parameter into and . While the pressure increases, remains virtually constant whereas tends to increase slowly. The slight increase of the layer thickness as a result of compression was observed in TiS2, viz. a layered material with a vdW gap, which is associated with an increase of the electronic charge in the interlayer region, indicating enhanced metallic rather than van der Waals bonding between the layers.Allan et al. (1998) In accordance with this, we think that the qualitative description of the pressure variation of within the PBEsol, rather than PBE-D2, approach is realistic (in the low-pressure regime). The latter is also supported by the fact that the results of PBEsol, rather than PBE-D2, calculations are in excellent agreement with the measured pressure variation of the lattice parameter , cf. Fig. S2 (Ref. sup, ). As long as , the effect of pressure on is manifested primarily (solely) as the compression of the vdW gap according to the PBEsol (PBE-D2) calculations. While is getting reduced, the electronic charge density in the vdW gap region increases, as illustrated in Fig. 3(b) where the planar average of the charge density is plotted for zero pressure and for . This means that the interlayer metallic bonding becomes stronger as decreases. The decrease in , compared to that in , is more pronounced in the low-pressure regime, as seen in Fig. 3(a). Accordingly, the transition to the zero-gap state occurs at a relatively lower (higher) pressure within the PBEsol (PBE-D2) approach. This explains why is smaller than .
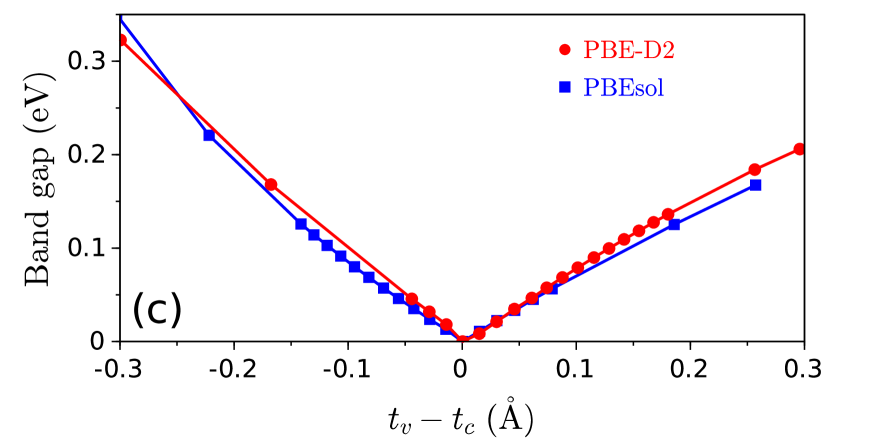
The band gap diminishes when the width of the vdW gap is reduced to a critical value , which is marked by the horizontal dashed lines in Fig. 3(a). It is remarkable that takes practically the same value in both PBEsol and PBE-D2 approaches, i.e., Å. Hence the transition to the zero-gap state occurs at the same critical thickness according to the two approximations (PBEsol and PBE-D2) employed in this study. It is also striking that the PBEsol and PBE-D2 calculations yield almost identical in the vdW gap region for zero pressure as well as for , which is discernible in Fig. 3(b); compare the orange solid (; PBE-D2) curve to the green dashed (; PBEsol) curve, and the red solid (; PBE-D2) curve to the blue dashed (; PBEsol) curve. Thus the PBEsol and PBE-D2 approaches that are in conflict to some degree (as pointed out above) yield consistent predictions concerning the electronic structure and the interlayer metallic bonding in BiTeI under pressure. This is further evidenced in Fig. 3(c) where the band-gap energy is plotted with respect to the difference . It is seen that the calculated (PBEsol and PBE-D2) values of the band gap follow not only qualitatively but also quantitatively the same trend. Thus the difference between the predictions of the PBEsol and PBE-D2 approaches does not pertain to the variation of the electronic structure of BiTeI under pressure, which actually pertains only to the overestimation (PBEsol) and underestimation (PBE-D2) of the compressibility of BiTeI.
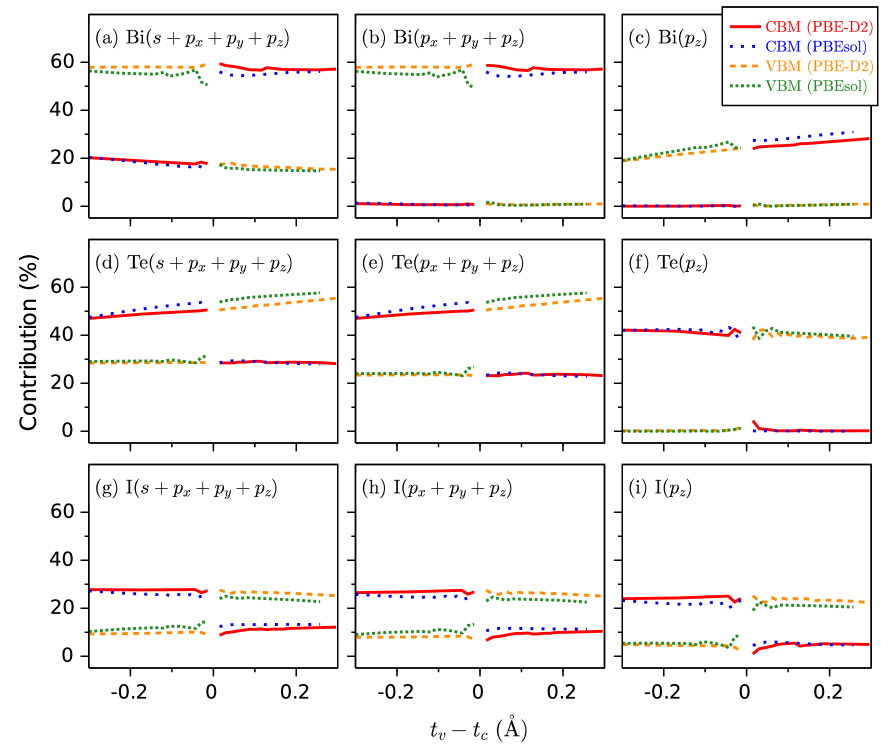
The predictions of the PBEsol and PBE-D2 approaches are further compared to each other in the matter of the inversion of the character of the VBM and CBM states, which was mentioned in the beginning of this article, cf. Refs. Bahramy et al., 2012; Xi et al., 2013; Ideue et al., 2014; Park et al., 2015. The angular-momentum-resolved (, , , ) contributions from Bi, Te, and I atoms are computed by projecting the VBM and CBM wave functions onto spherical harmonics within a sphere around each atom. Figure 4 shows plots of the (the left panels), (the center panels) and (the right panels) contributions from Bi (the upper panels), Te (the middle panels) and I (the lower panels) atoms to the VBM and CBM wave functions as a function of . It is seen in Figs. 4(g)-4(i) that the total, total and contributions to the character of either VBM or CBM wave function from the I atom remain roughly constant regardless of the value of , viz. the degree of compression. The total contribution from the Bi atom is also roughly constant, as seen in Fig. 4(b). On the other hand, Figs. 4(a), 4(c)-4(f) show some variation. For example, Fig. 4(a) [4(d)] shows that the overall contribution from Bi [Te] atoms is slightly increasing [decreasing] as the degree of compression increases. The contribution from Bi- [Te-] decreases [increases] at the expense of increasing contributions from Bi- and Bi- [Te- and Te-], cf. Figs. 4(a) and 4(b) [Figs. 4(e) and 4(f)], while is getting reduced. Accordingly, the character of the CBM (VBM) wave function is mostly of Bi- (Te-+I-) for , which is of Te-+I- (Bi-) for . This demonstrates clearly the inversion of the VBM and CBM states that occurs at . As a matter of fact the inversion of the character of the VBM and CBM wave functions is easily noticed in any panel of Fig. 4, thanks to the discontinuity of the plotted curves at . It is also readily noticeable that the PBEsol-calculated and dispersion-corrected (PBE-D2) curves follow qualitatively and quantitatively (within a few percent) the same trend in all panels of Fig. 4. Hence the results of the PBEsol and PBE-D2 calculations are in agreement as regards the inversion of the character of the VBM and CBM wave functions.
In conclusion, the evolution of the electronic structure of BiTeI under compression is studied by employing semilocal (PBEsol) and dispersion-corrected (PBE-D2) density-functional calculations. A comparative investigation of the results of these calculations confirms that the band-gap energy of BiTeI decreases till it attains a minimum value of zero at a critical pressure, after which it increases again, which was reported in a number of recent studies.Bahramy et al. (2012); Xi et al. (2013); Ideue et al. (2014); Park et al. (2015) The critical pressure is found to be lower than the pressure at which BiTeI undergoes a structural phase transition, implying that the closure of the band gap would not be hindered by a structural transformation. In addition, the band-gap pressure coefficients of BiTeI are computed, and an expression of the critical pressure is devised in terms of these coefficients, cf. Eq. (3). It is to be emphasized that the latter enables one to estimate the critical pressure from the equilibrium band gap and its pressure coefficients. It is exposed that the essential difference between the results of PBEsol and PBE-D2 calculations pertains to the prediction of the compressibility of BiTeI. Nevertheless, the effect of pressure on the atomic structure of BiTeI is found to be manifested primarily as the reduction of the width of the van der Waals gap according to both types of calculations. It is further revealed that the PBEsol and PBE-D2 approaches yield consistent predictions concerning the variation of band-gap energy with respect to the width of the van der Waals gap. Consequently, it is shown that the calculated (PBEsol and PBE-D2) band-gap energies follow qualitatively and quantitatively the same trend within the two approximations employed here, and the transition to the zero-gap state occurs at the same critical width of the van der Waals gap.
We thank Xiaoxiang Xi for providing the experimental data used in Figs. 2(a), 2(c), and S2. The numerical calculations reported here were carried out at the High Performance and Grid Computing Center (TRUBA Resources) of TUBITAK ULAKBIM.
*
Appendix A Crystal structure calculations using the optB86b-vdW functional
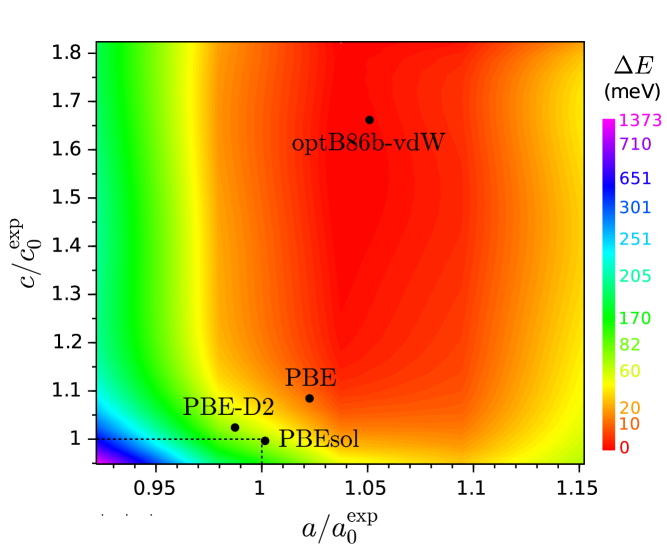
We computed the total energy as a function of the lattice parameters and using the optB86b-vdW functional,Klimeš et al. (2011) and determined the energy minimum . A colored contour plot of the energy difference versus and is given in Fig. A1, where and denote the experimental values of the equilibrium lattice parameters of and , respectively. There appears to exist an anomalously flat energy plateau that is the red portion of the plot in Fig. A1. Within this plateau, the optB86b-vdW functional results in a great overestimation in () by 66 % (5 %). In other words, crystal structure calculations using the optB86b-vdW functional yield an unacceptably unrealistic (unexpectedly inaccurate) prediction for (), cf. the solid black circles in Fig. A1, which is clearly not the case with the other calculation (PBE, PBE-D2, PBEsol) results. Owing to this difficulty, the resolution of which is beyond the scope of this paper, we avoid employing the optB86b-vdW functional in electronic structure calculations.
References
- Bahramy et al. (2012) M. S. Bahramy, B.-J. Yang, R. Arita, and N. Nagaosa, Nat. Commun. 3, 679 (2012).
- Xi et al. (2013) X. Xi, C. Ma, Z. Liu, Z. Chen, W. Ku, H. Berger, C. Martin, D. B. Tanner, and G. L. Carr, Phys. Rev. Lett. 111, 155701 (2013).
- Ideue et al. (2014) T. Ideue, J. G. Checkelsky, M. S. Bahramy, H. Murakawa, Y. Kaneko, N. Nagaosa, and Y. Tokura, Phys. Rev. B 90, 161107 (2014).
- Park et al. (2015) J. Park, K.-H. Jin, Y. J. Jo, E. S. Choi, W. Kang, E. Kampert, J.-S. Rhyee, S.-H. Jhi, and J. S. Kim, Sci. Rep. 5, 15973 (2015).
- Liu and Vanderbilt (2014) J. Liu and D. Vanderbilt, Phys. Rev. B 90, 155316 (2014).
- Tran et al. (2014) M. K. Tran, J. Levallois, P. Lerch, J. Teyssier, A. B. Kuzmenko, G. Autès, O. V. Yazyev, A. Ubaldini, E. Giannini, D. van der Marel, and A. Akrap, Phys. Rev. Lett. 112, 047402 (2014).
- Chen et al. (2013) Y. Chen, X. Xi, W.-L. Yim, F. Peng, Y. Wang, H. Wang, Y. Ma, G. Liu, C. Sun, C. Ma, Z. Chen, and H. Berger, J. Phys. Chem. C 117, 25677 (2013).
- Güler-Kılıç and Ç. Kılıç (2015) S. Güler-Kılıç and Ç. Kılıç, Phys. Rev. B 91, 245204 (2015).
- Perdew et al. (1996) J. P. Perdew, K. Burke, and M. Ernzerhof, Phys. Rev. Lett. 77, 3865 (1996).
- Grimme (2006) S. Grimme, J. Comp. Chem. 27, 1787 (2006).
- Perdew et al. (2008) J. P. Perdew, A. Ruzsinszky, G. I. Csonka, O. A. Vydrov, G. E. Scuseria, L. A. Constantin, X. Zhou, and K. Burke, Phys. Rev. Lett. 100, 136406 (2008).
- Tunega et al. (2012) D. Tunega, T. Bucko, and A. Zaoui, J. Chem. Phys. 137, 114105 (2012).
- Shevelkov et al. (1995) A. Shevelkov, E. Dikarev, R. Shpanchenko, and B. Popovkin, J. Solid State Chem. 114, 379 (1995).
- P. E. Blöchl (1994) P. E. Blöchl, Phys. Rev. B 50, 17953 (1994).
- Kresse and Joubert (1999) G. Kresse and D. Joubert, Phys. Rev. B 59, 1758 (1999).
- G. Kresse and J. Furthmüller (1996) G. Kresse and J. Furthmüller, Phys. Rev. B 54, 11169 (1996).
- Hobbs et al. (2000) D. Hobbs, G. Kresse, and J. Hafner, Phys. Rev. B 62, 11556 (2000).
- Marsman and Hafner (2002) M. Marsman and J. Hafner, Phys. Rev. B 66, 224409 (2002).
- Monkhorst and Pack (1976) H. J. Monkhorst and J. D. Pack, Phys. Rev. B 13, 5188 (1976).
- Klimeš et al. (2011) J. Klimeš, D. R. Bowler, and A. Michaelides, Phys. Rev. B 83, 195131 (2011).
- Ishizaka et al. (2011) K. Ishizaka, M. S. Bahramy, H. Murakawa, M. Sakano, T. Shimojima, T. Sonobe, K. Koizumi, S. Shin, H. Miyahara, A. Kimura, K. Miyamoto, T. Okuda, H. Namatame, R. Taniguchi, M. amd Arita, N. Nagaosa, K. Kobayashi, Y. Murakami, R. Kumai, Y. Kaneko, Y. Onose, and Y. Tokura, Nat. Mater. 10, 521 (2011).
- (22) See Supplemental Material for (i) Fig. S1 that displays the fourth- and fifth-order BM fits for the PBEsol-calculated and dispersion-corrected (PBE-D2) energy-volume curves, respectively, (ii) Fig. S2 that shows the plots of and versus the normalized pressure, where () denotes the equilibrium value of the lattice parameter ().
- Lee et al. (2011) J. S. Lee, G. A. H. Schober, M. S. Bahramy, H. Murakawa, Y. Onose, R. Arita, N. Nagaosa, and Y. Tokura, Phys. Rev. Lett. 107, 117401 (2011).
- Allan et al. (1998) D. R. Allan, A. A. Kelsey, S. J. Clark, R. J. Angel, and G. J. Ackland, Phys. Rev. B 57, 5106 (1998).
Supplemental Material
-
•
Figure S1 displays the fourth- and fifth-order Birch-Murnaghan fits for the PBEsol-calculated and dispersion-corrected (PBE-D2) energy-volume curves, respectively.
-
•
Figure S2 shows the plots of and versus the normalized pressure , where and denote the equilibrium values of the lattice parameters and , respectively.