Anomalous Tunneling Systems in Amorphous Organic Materials
Abstract
We compare the heat release data of organic glasses with that of amorphous and glass like crystalline solids. Anomalous behavior was found in all these materials, which disagrees with the standard tunneling model. We can explain the most of the experimental observations within a phenomenological model, where we assume that for a part of tunneling systems the barrier heights are strongly reduced as a consequence of the local stress produced during the cooling process.
pacs:
72.15.Eb, 65.40.Ba, 66.70.Hk, 73.40.GkI Introduction
Let us begin with an overview of the main results and conclusions concerning the heat capacity and heat release experiments in inorganic and glasslike crystalline materials. It has been recently shown that barrier heights of two-level systems (TLSs) in both amorphous and glasslike crystalline solids can be drastically reduced by frozen in local mechanical stresses caused by a rapid cooling of the sample c1 . The value of the reduction can be estimated in the framework of Eyring model c05 that is widely employed for describing stress-induced yielding and non-linear mechanical response in polymer glasses c0 . Strong local fluctuations of the stress are expected to exist in glasses and the maximum barrier height is reduced to after the cooling of the sample with where is a so-called activation volume (a typical volume required for a molecular shear rearrangement) and is the frozen in stress caused by the thermal expansion. As a consequence, the distribution of the barrier heights becomes much more complicated than that assumed within the standard tunneling model (STM) c2 ; c3 , which gives roughly a constant distribution . Namely, there appears a step in the distribution function at (see Fig. 1). Moreover, the relaxation time of the tunneling process also exhibits a step at the corresponding relaxation time .
In the one-phonon approximation, the relaxation rate of a thermally activated process is written as
| (1) |
One gets at where the minimum tunneling energy
| (2) |
is the zero-point energy c4 , and
| (3) |
TLSs with the reduced barrier heights were called anomalous (aTLSs). The results agree well with the predictions of the STM for all parameters when the experimental time scale is less than . For example, in vitreous silica is found to be of the order of s, and the spectral density obtained from the heat capacity (), thermal conductivity, ultrasound, damping (internal friction) agree quite well with the STM c5 . However, the heat release was measured at longer time up to s and for gives a spectral density roughly times smaller than the spectral density deduced from the heat capacity. One can estimate the value of the step as , where a small contribution of anomalous TLSs to the heat release at ( in Fig. 1) has been neglected (explanation see below). We get for vitreous silica, which means that the main part of TLSs is anomalous c5 . It should be stressed that the most of thermodynamical parameters taken from experiments do not allow us to distinguish between the contribution of normal and anomalous TLSs, while this is possible by the heat release measurements.
The heat capacity experiment yields the spectral density , which is an average value of all tunneling systems between and , where is the minimum relaxation time of the TLSs and is the time of the heat capacity measurement (typically, s). Thus, the heat capacity always gives the spectral density for , that is .
The heat release is caused by TLSs with the relaxation time close to the measuring time (numerical calculations with a standard distribution function show that the heat release at the time is produced by TLSs with the relaxation time ). Their corresponding barrier heights are located in a quite small range , where is an average value, which determines the relaxation time . Thus, the heat release experiments give us the spectral density for a well-defined barrier height and, therefore, by increasing time one can move from the left to the right side of the step in the distribution . Notice that the new parameter plays an important role in our model. Namely, in accordance with Fig. 1 we get different results for both the heat release and its correlation to the heat capacity in three different regions:
-
1.
and
-
2.
and
-
3.
and
In the first region we reproduce the results of the STM with a new spectral density . Explicitly,
| (4) |
where , and
| (5) |
with being the volume of the sample, the starting, and the final temperature. At low temperatures (, ), for the heat release we found no difference from the STM. Here is the crossover temperature, where the relaxation rate of the tunneling is equal to the relaxation rate of the thermally activated process. Above the crossover temperature the relaxation time of normal TLSs decreases rapidly with increasing temperature due to the Arrhenius law. As a consequence, a part of TLSs relaxes during the cooling process and does not contribute to the heat release. In this case, the heat release deviates from behavior. At high enough temperatures ( is the freezing temperature), all TLSs with the energy reach the state of equilibrium during the cooling process, and the heat release saturates. Thus a maximum value of the heat release will be observed at in Eq. (5). depends weekly on the cooling rate at this temperature and is directly proportional to the barrier height of the TLSs causing the heat release at given time after the cooling to a temperature . Notice that the freezing temperature is close to the crossover temperature for normal TLSs (see c6 ). However, the barrier height of anomalous TLSs increases with increasing temperature and their freezing temperature can be essentially higher than . In this case, a giant heat release will be observed since the heat release saturates at very high temperatures .
In the second region, the heat release relaxes very fast and can be described by the relation
| (6) |
where and are proportional to and , respectively. In the heat release one can directly see the step in the distribution function and determine the maximum relaxation time of anomalous TLSs as a function of an average energy . This rare case was observed in ZrCaO c7 . Fig. 2 shows the heat release as a function of time after cooling from different to K.
Notice that Eq. (6) describes the time dependence very well. Fig. 3 shows the energy dependence of , where we point out another interesting fact: the maximum energy is not proportional to , as expected from the STM (see Eq. (1)) but roughly proportional to .
In the region 3 there is a remarkable discrepancy between and since
| (7) |
In this case, the heat release is mainly determined by the normal TLSs, and the maximum heat release is much smaller than the value measured at . Nevertheless, there is also a small contribution of anomalous TLSs ( in Fig. 1). It was suggested that this small contribution to the heat release at could be caused by some distribution of the local stresses in the sample after a rapid cooling. Within this scenario, the maximum local stress will reduce to after the cooling. For smaller stress, the corresponding will take the values between and at the relaxation time , and a corresponding freezing temperature varies between . Thus, the distribution of the local stresses leads to a contribution of anomalous TLSs at . Such a contribution was observed in all materials with . Notice that is small in comparison to - for example, for vitrous silica c5 . Nevertheless, for high initial temperatures this fraction of anomalous TLSs gives the dominant contribution to the heat release (roughly 2 times larger than the contribution of normal TLSs) since they have also a much higher in comparison to (see Fig. 4).
Measuring the -dependence of the heat release one can separate the contribution of normal and anomalous TLSs. Fig. 4 shows the parameter as a function of . The contribution of normal TLSs saturates for a-SiO2 at K while for anomalous TLSs () it saturates above K. Values of these two contributions are proportional to and , correspondingly. depends on the values of local stresses and as well as on the mass of tunneling entity. The last possibility was demonstrated for TLSs in NbTi caused by H or D in c1 .
The heat release and heat capacity data of all investigated inorganic amorphous and glasslike crystalline solids complies with one of these three cases (see Table 1). A transition between cases one and three is rarely observed since changing measuring time in the heat release experiments by a factor of ten modifies the corresponding barrier height by a few percents only. All three cases were observed in ZrO2CaO c7 (see Fig. 2), PLZT c8 and also in a-SiO2 c5 and NbTi-H c1 .
It should be noted that the heat release in amorphous organic materials has not yet been analysed in detail. At the same time, the experimental studies of organic glasses show a rather specific behavior of the heat release. In this paper, we make a comparison of the heat capacity and heat release data between organic glasses, inorganic glasses, and glasslike crystalline materials. Our analysis clearly indicates the existence of anomalous TLSs in all these materials; their possible origin is the local stresses during the cooling process.
II Heat capacity and heat release of amorphous organic materials
Our purpose is to analyse the relevant heat release and heat capacity data for organic amorphous materials and show that anomalous TLSs should also exist in these materials. If this is the case, the distribution function must be similar to that in inorganic glasses with a step at . There is, however, an important difference: in organic materials the heat release decays as with in contrast to both the predictions of STM and the behavior observed in most of inorganic glasses. As a possible explanation one can assume an additional strong increase of near . Let us consider an extreme case of a -like growth. In this case, the heat release should be written as
| (8) |
with
| (9) |
where is a time independent contribution to the heat release. Otherwise, we would expect to find for a value larger or close to for , and a fast relaxation of the heat release at .
II.1 Heat capacity and heat release of PMMA
One of the first long time heat release experiments were performed by Zimmermann and Weber with a-SiO2 and PMMA c9 ; c10 . In both materials the poor agreement with the STM was observed. The results of vitreous silica were considered and discussed in detail in ref. c5 . The results of PMMA are shown in Fig. 5. For low , the heat release is roughly proportional to as predicted by the STM. However, a markedly different time dependence was observed for higher .
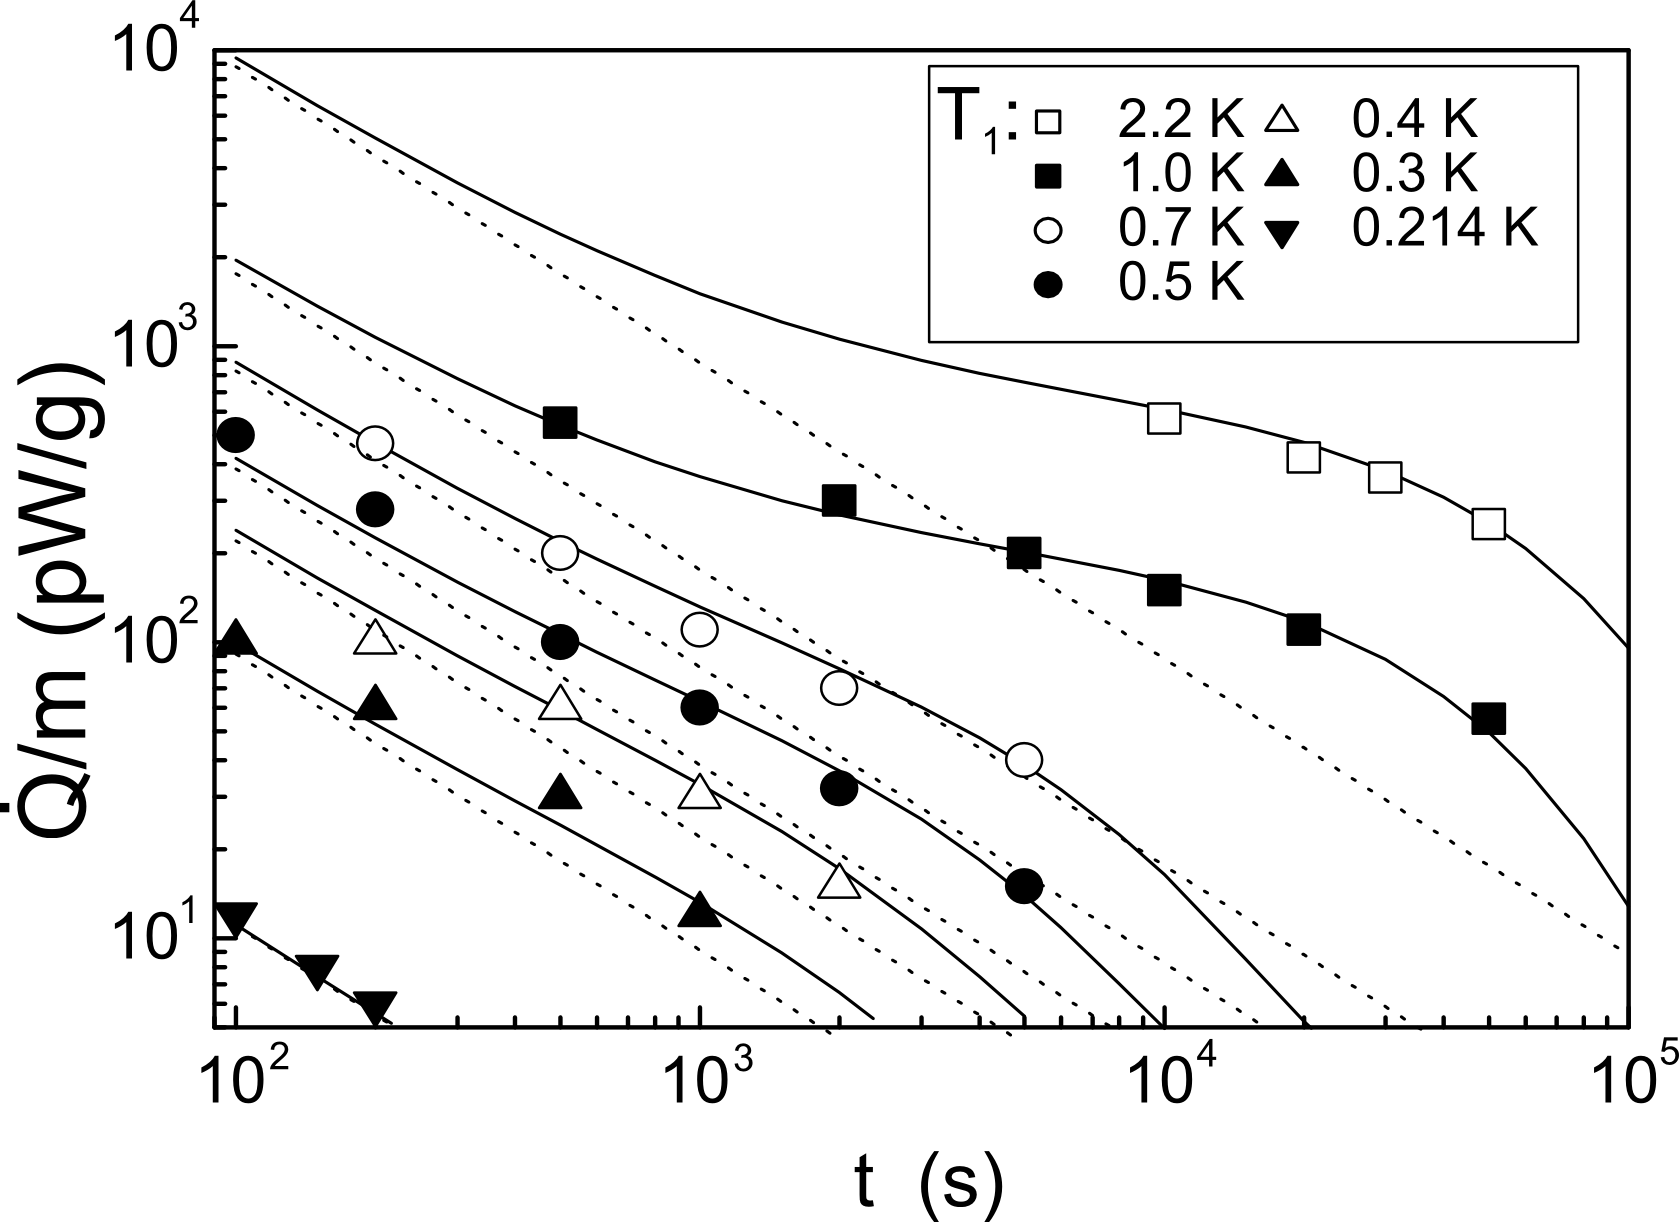
A much better agreement we get with a fit
| (10) |
where
| (11) |
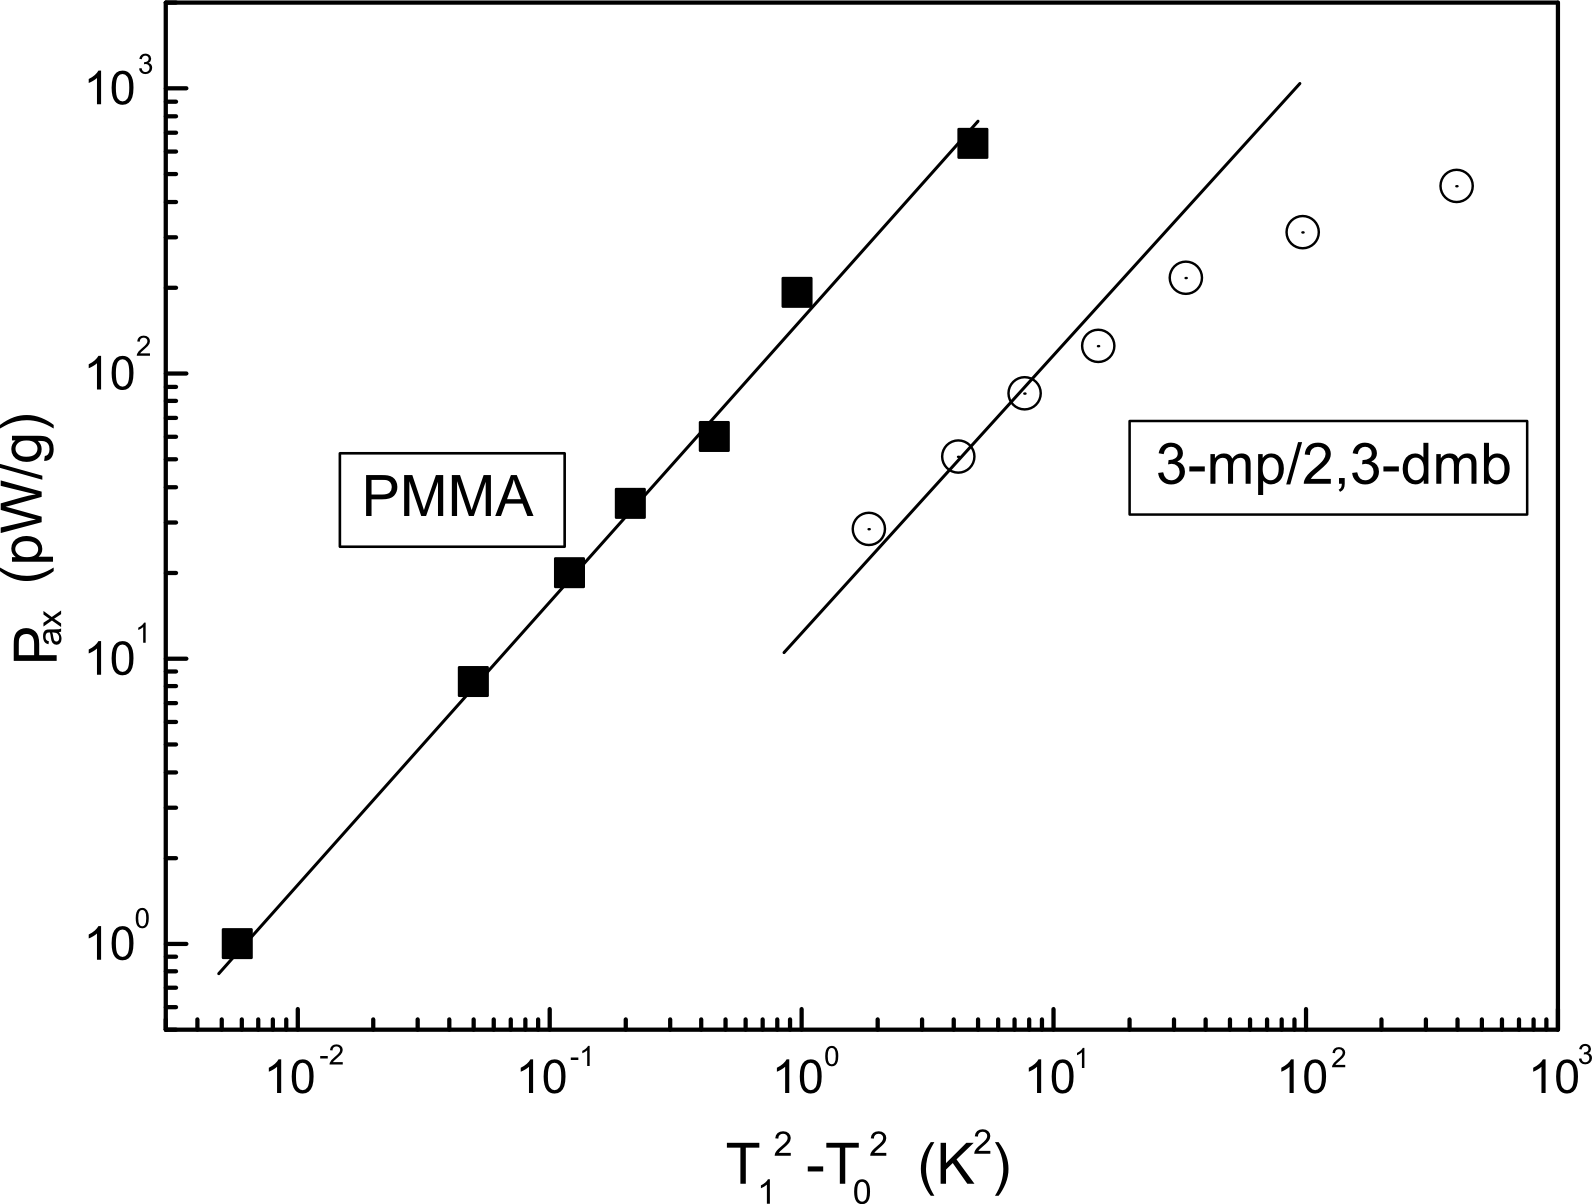
The heat release of PMMA is at low temperatures and short time mainly determined by the term and agrees here quite well with the STM. However, Eq. (10) yields a much better agreement with the experimental data including that data at higher and long time. As is seen, that Eq. (10) differs from Eqs. (8) and (9): the exponent cuts down also , and therefore this fit fails at . In order to separate terms and we need the heat release data either for higher temperatures or for . Unfortunately, they are not yet available for PMMA. As we see in Fig. 4, dependence of agrees with the STM. Thus, we can estimate the distribution parameter by using the STM. The result is Jm3 at g/cm3. Notice that this parameter really markedly exceeds the value deduced from the heat capacity Jm3 c11 . This finding indicates that the heat release is strongly influenced by the new term which is also strongly proportional to (see Fig. 6). This means that all contributions to the heat release have the same or similar distribution function of the energy ().
Notice that the increase of the distribution function with could explain the deviation from behavior of the heat release. However, in this case we would obtain a deviation from behavior as well. In particular, the model with TLS-TLS interaction taken into account gives Burin . This function was successfully used to fit the data of spectral diffusion in PMMA Maier . However, using this distribution function in our case we obiain , which is inconsistent with the heat release experimental data (see Fig. 4).
The contribution of the anomalous TLSs and normal TLSs cannot be separated because this requires the heat release experiments with higher which were not performed up to now.
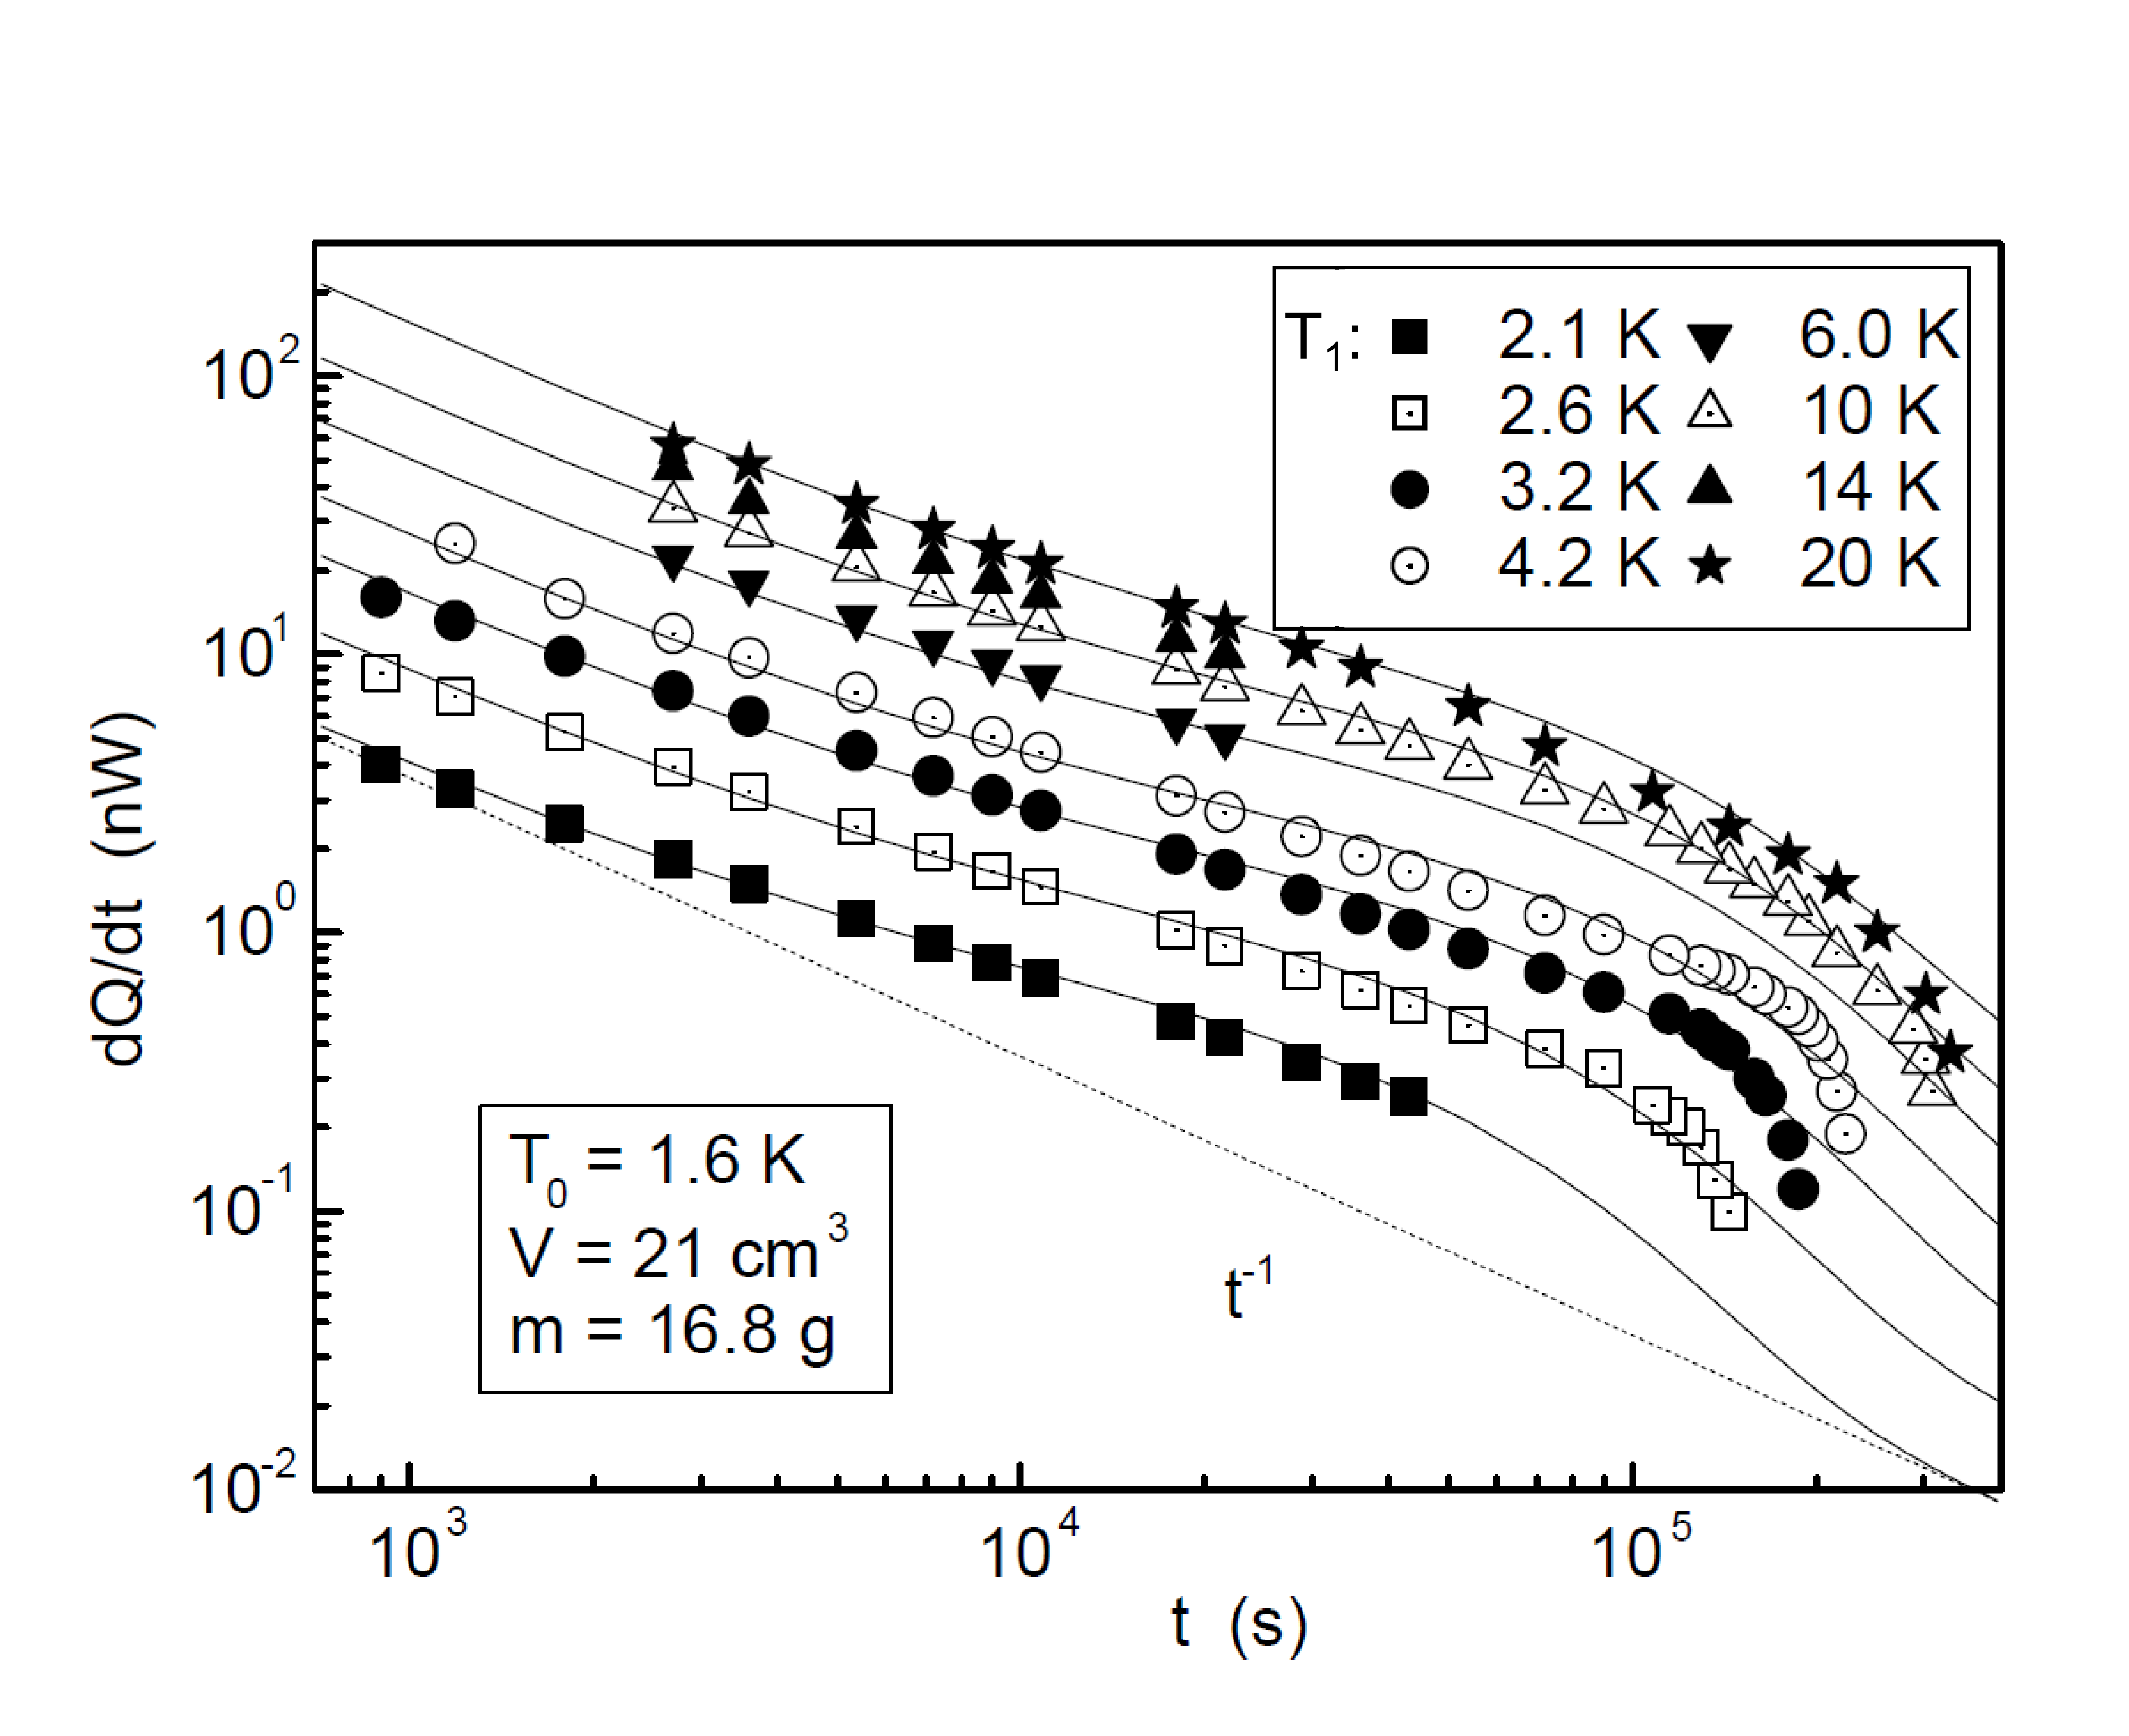
II.2 Heat release of 3-MP/2,3-DMB
Heat release measurements were performed with 3-methylpentane/2,3-dimethylbutan at much higher starting temperature than for PMMA (up to 20 K) c12 . The heat release is found to be roughly proportional to and relaxes much faster for a very long time (see Fig. 7). Notice that even a sharp cut of the TLSs distribution function could not provoke such strong dying in . The full lines present the fit curves according to Eq.(10). The corresponding parameters and are shown in Figs. 4 and 6 as a function of . is evidently proportional to for K and one can estimate Jm3. At higher , the results deviate from the linear dependence. However, no saturation of the heat release as a function of is observed up to K, which is a typical behavior of anomalous TLSs. This is a clear indication that . At long time we observe a faster relaxation due to . The additional contribution determines the heat release far a long time. The energy dependence is similar to that for . The parameter is close to the corresponding values of PMMA with a similar energy dependence for low (see Fig. 3).
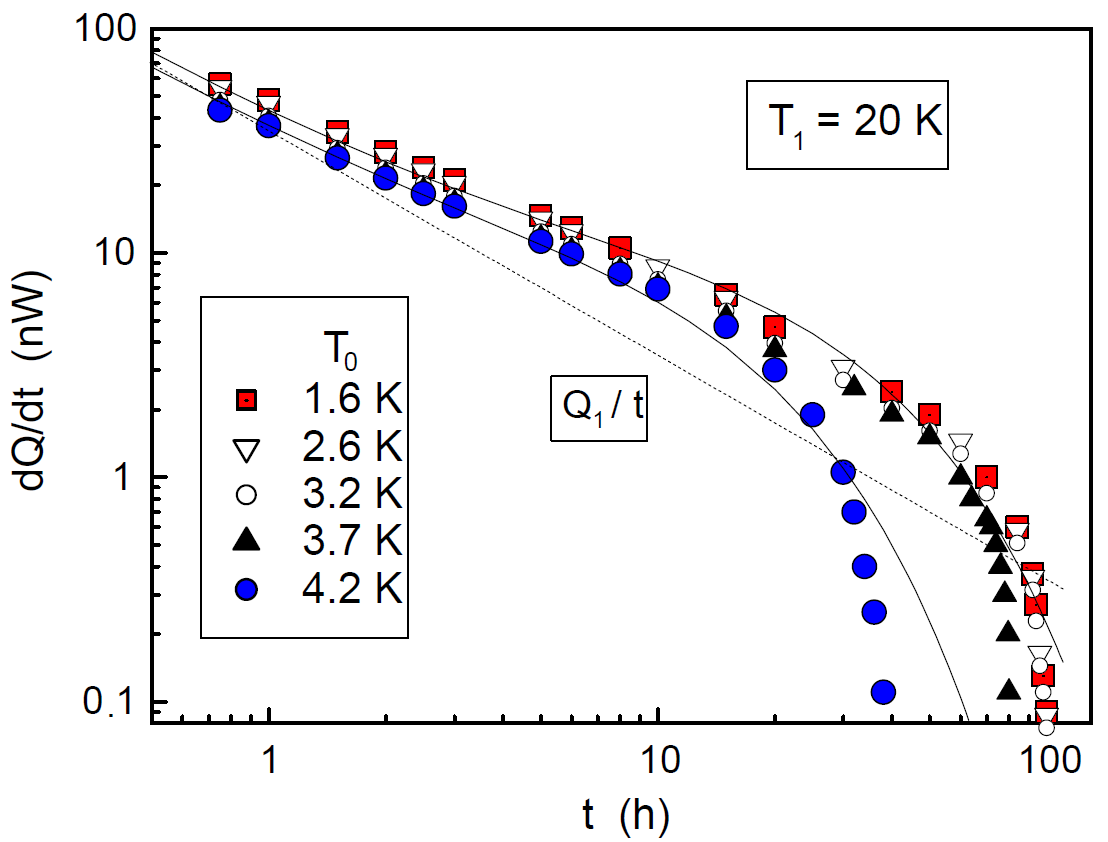
Interesting results were obtained for this material by measuring the heat release as a function of the final temperature (see Fig. 8). The variation in from 1.6 K to 3.2 K does not influence the parameter . However, a strong reduction of is observed for K. This means that above K the thermal activation process dominates, and we expect a saturation of the heat release as a function of around K provided that the barrier heights are constant. In fact, is no more proportional to for K (the heat release caused by normal TLSs saturates). However, no saturation is observed up to K which is a strong indication that the further increase of the heat release at K is caused by anomalous TLSs.
II.3 Heat capacity and heat release of PS
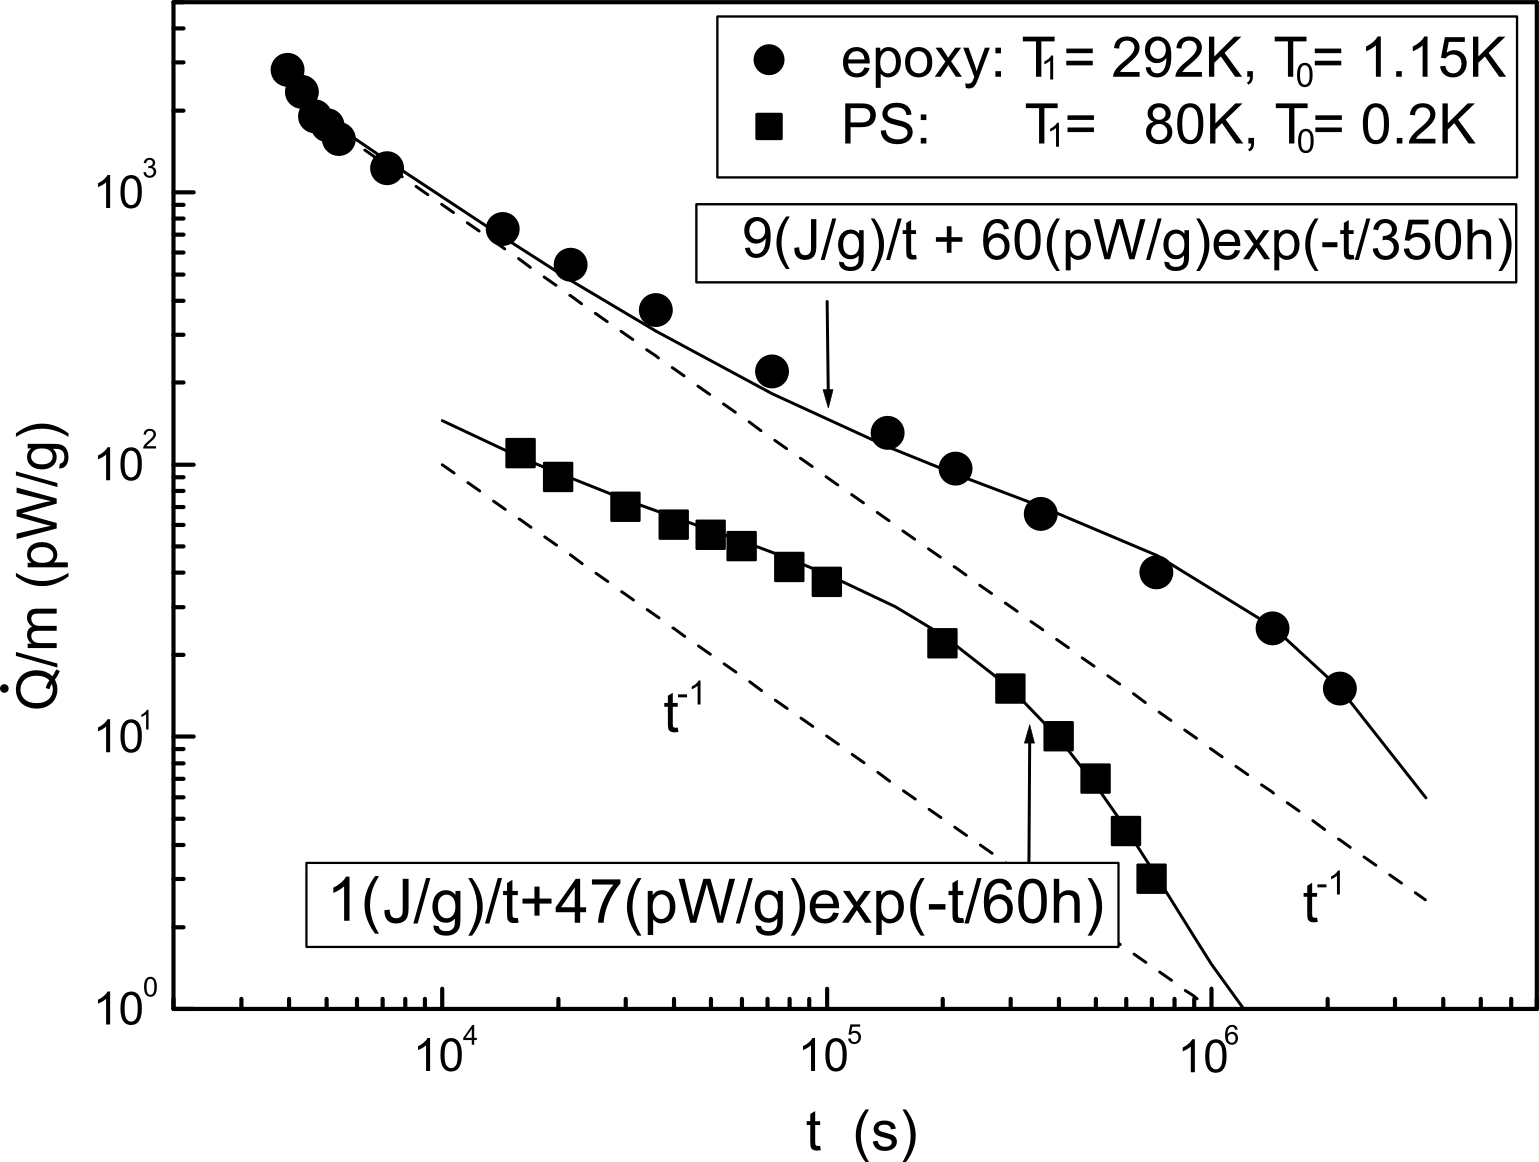
Heat release measurements in polystyrene were performed by Nittke et. al Nittke . In the range of h h at K with K K measurments show that the heat release and are proportional to and , respectively (see Fig. 17 in Nittke ). Resulting J/g, is in a good agreement with J/g deduced from the heat capacity Nittke ; c13 . All results are in perfect agreement with the STM and no contributions of anomalous TLSs was observed. Notice, however, that the heat release was measured for a quite short time and low only. The contribution of anomalous TLSs would be much larger for high and long time. Indeed, the heat release measured after cooling from K to K in a wide time range shows the typical time dependence caused by the anomalous TLSs (see Fig. 9) with h.
II.4 Heat capacity and heat release of epoxy resin
The heat release of epoxy resin was measured after cooling from K to K during days c14 . It was found to be proportional to (see Fig. 9). A similar time dependence was found for epoxy glue Stycast c15 . Eq. (8) gives a good fit for epoxy with a very long h. At lower the power law in the time dependence does not change: the relation between and is the same for different . This holds only when both contributions are caused by anomalous TLSs. deviates from the STM at K (the saturation of the heat release caused by the normal TLSs) but the heat release is still increasing up to the highest temperature K. This is again a clear indication that the heat release is produced by anomalous TLSs.
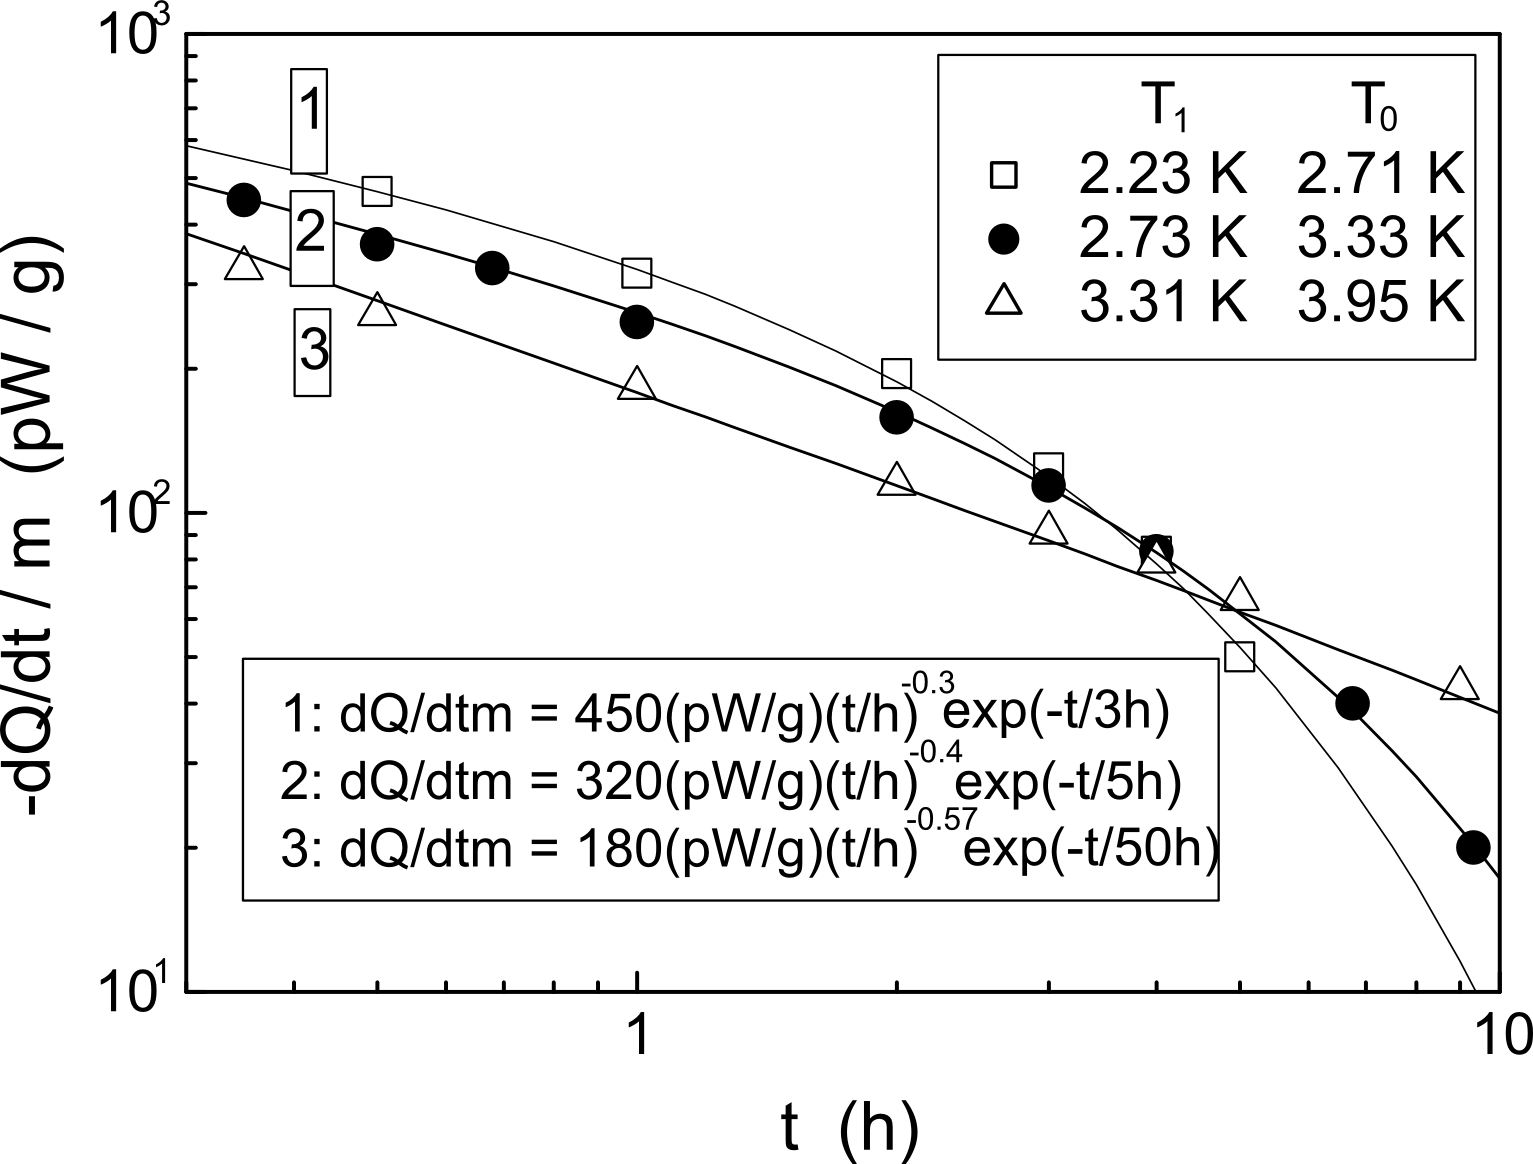
The step in the distribution function was found for higher in the thermally activated range c14 (see Fig. 10). Here the thermal absorption was measured after heating the sample from to (i.e. ). Since the thermal activation alters the time dependence for shorter time as well, we fit the data by a power law
| (12) |
where is the heat release at () and the fit parameter depends on . The parameter changes rapidly with increasing temperature from h at K to h at K.
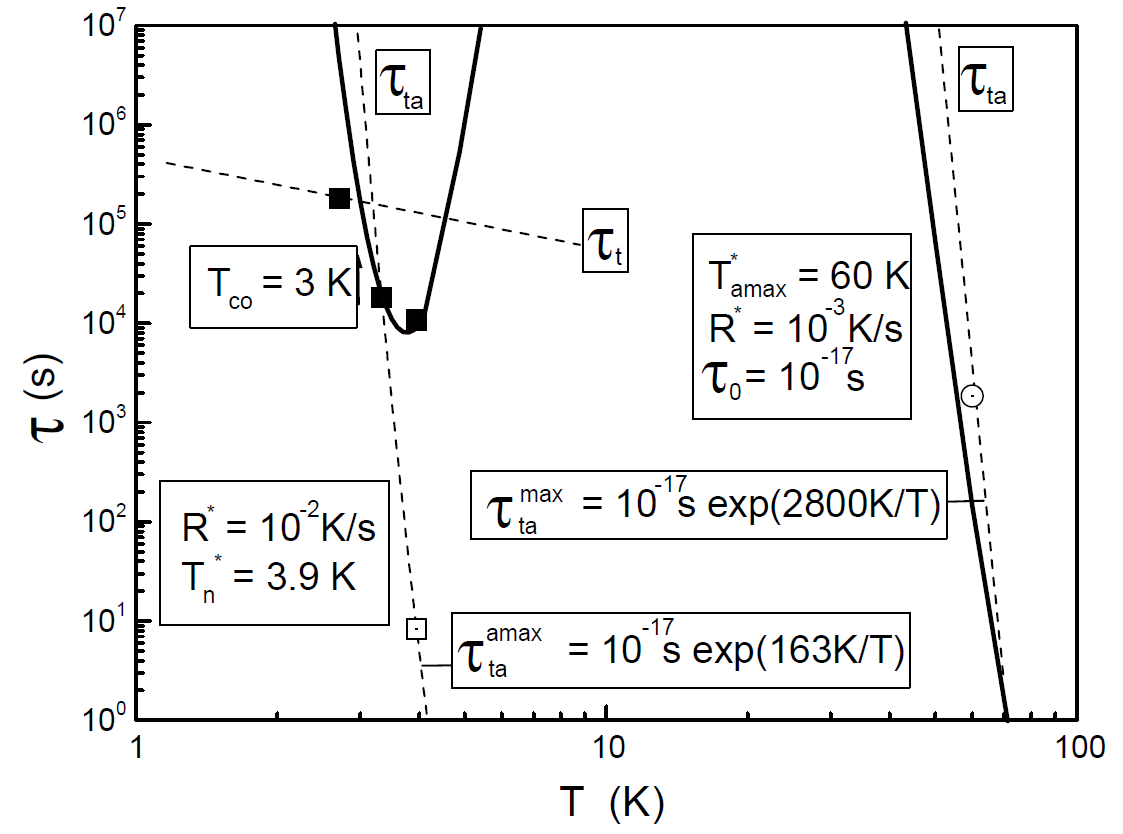
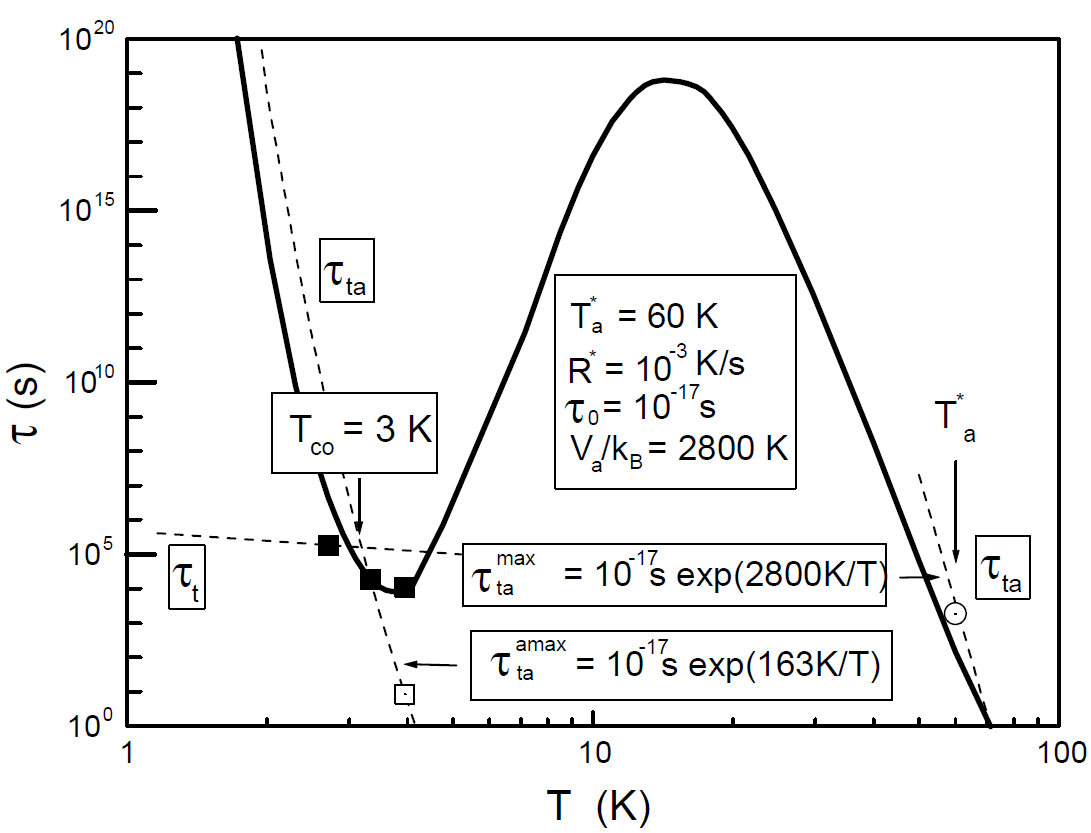
For a better understanding, Fig. 11 shows these data together with the calculated temperature dependencies within the STM. At the crossover temperature K the tunneling relaxation rate becomes equal to the rate of thermal activation. Thus the value of at the lowest temperature lies in the tunneling range, while two others are in the range of thermal activation. The Arrhenius law with s yields effective barrier heights K ( K) of the TLSs causing at this time the heat. It is expected within the STM (where barrier heights are temperature independent) that the corresponding relaxation time decreases very rapidly with increasing temperature (see Fig. 11, dashed line). For normal tunneling systems this leads to the saturation of the heat release at the freezing temperature , which is about 20% higher than , i.e. K. However, no saturation was found up to K (see Fig. 4). In addition, the measured at K is orders of magnitude longer than expected from the Arrhenius law (open square in Fig. 11). All these facts demonstrate that the effective barrier height increases at higher temperature as shown in Fig. 12. Both the barrier height and the corresponding relaxation time in Fig. 11 were calculated with the following fit function (the curve in Fig. 12):
| (13) |
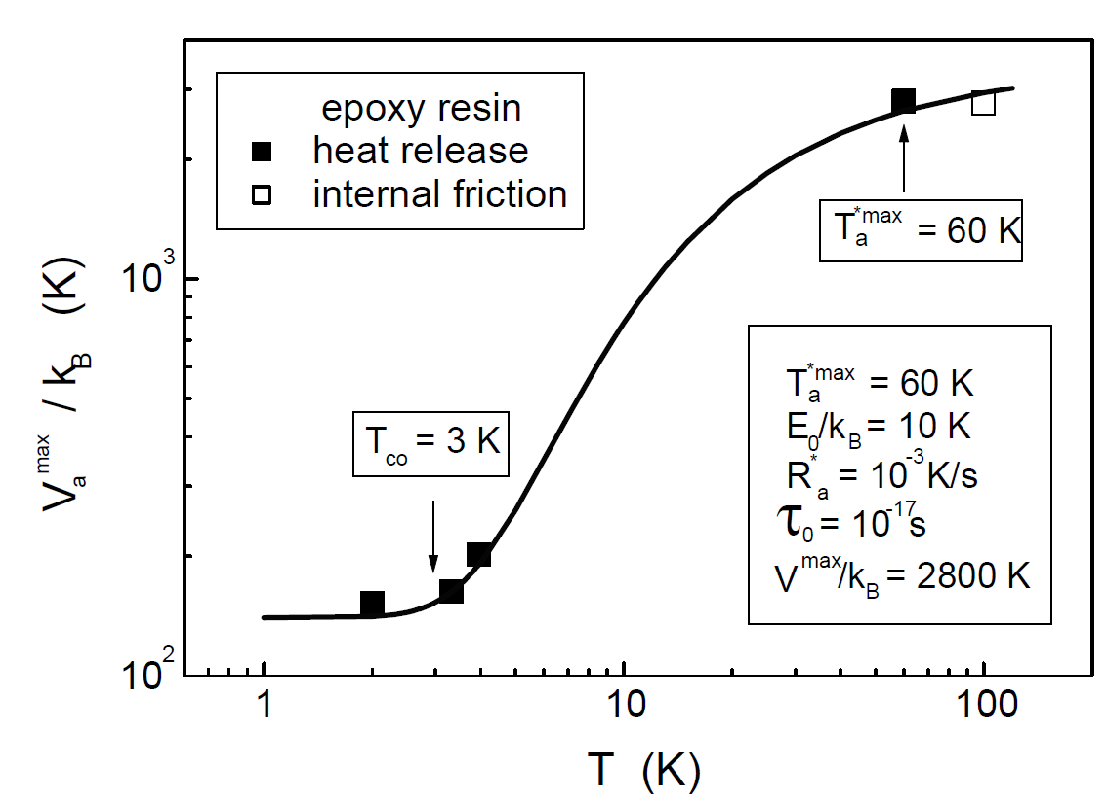
We can estimate the freezing temperature K from the dependence of the parameter in Fig. 4 by extrapolation of the experimental data at high and low ; finally we get from Eq. (8) in c1 the barrier height K, which is close to .
One can also estimate the maximum barrier height from the internal friction experiments. No maximum of the damping was observed in experiments with epoxy up to K ( MHz) c16 . This leads to a maximum barrier height larger than K. A damping peak nearby K can be estimated for the TLSs in the vibrating reed experiments ( KHz) with stycast c17 . This yields K (full squares in Fig. 12). All these parameters are in a reasonable relation. Thus, the TLSs with the maximum barrier heights become frozen in state at K (open circles in Figs. 11 and 13) and their relaxation time increases with decreasing temperature, reaches a maximum value of s at about K than returns to a short time s at K (see Fig. 13). Let us note that the Arrhenius law gives s (!) for the relaxation time of TLSs with the maximum barrier height at K.
II.5 Heat release of pentanol-2
Pentanol is a good candidate for a proton target due to its high hydrogen content (C5H11OH). However, a high polarization requires an uniform distribution of the paramagnetic centers, which is much better in amorphous than crystalline materials. A standard cooling of pentanol with a dilution refrigerator yields polycrystalline pentanol. A difficult procedure was necessary to get the amorphous structure. The pentanol was mixed with % water and cooled down rapidly by liquid nitrogen (the glass transition temperature lies near K). Then the solid pentanol was mounted rapidly in the dilution refrigerator and cooled down to lower temperatures. This procedure is not too convenient. Therefore we check Pentanol-2, where the OH-group is transferred from the end of the long molecule to the side. Indeed, the worse symmetry of the molecules leads to an amorphous structure by normal cooling in a dilution refrigerator. Heat release experiments showed clearly a glassy behavior, however with deviations in the time dependence: the heat release was found to be proportional to between and min c18 . Eq. (8) gives also a good fit of the time dependence. The corresponding parameters are shown in Fig. 4. The crossover temperature is near K and one expects a saturation within the STM above K. However, the -dependence does not saturate up to K. The data are close to that of epoxy resin (see Fig. 4).
III Discussion
We can make three main conclusions from the above-reviewed experimental data for amorphous organic materials:
-
1.
The main contribution to the heat release comes from anomalous TLSs. Indeed, the heat release saturates at very high starting temperatures (a giant heat release), the distribution parameter is close to (or larger) and the heat release relaxes faster at very long time.
-
2.
The heat release experiments with organic glasses correspond to the considered cases (1) and (2), where . In fact, in organic glasses is longer than in inorganic ones or glasslike crystalline materials, except NbTi/D (see Fig. 3).
-
3.
In contrast to inorganic materials, for a long time, but the heat release is roughly proportional to with .
We also put emphasis on an abrupt decrease of the heat release with time in 3-mp/2,3-dmb, which cannot be described even by suggesting a cut in .
Let us analyse these conclusions with relation to the model of local mechanical deformations due to giant large-scale fluctuations in thermal expansion during the cooling of a sample Karpov . According to this model, the thermal expansion coefficients take random values inside the dilatation centers of the sample. The dispersion in the distribution of is suggested to be much bigger than its mean value: , where is the deformation potential, is the Grüneisen parameter. Rapid cooling from an initial temperature to a final results in a generation of strong local mechanical stresses, which provokes a linear reduction in the barrier height. As a consequence, the life time of high-energy TLSs reduces and their heat release becomes experimentally observable. Namely these TLSs are called anomalous.
This model allows us to explain qualitatively an increase of with an average energy of TLSs (see Fig. 3). Indeed, the dispersion decreases when grows. This results in growing barrier heights of anomalous TLSs, reducing of , and increasing relaxation time. Regarding the second item of our conclusions, the edge in the distribution function of anomalous TLSs is shifted to the left against the edge of normal TLSs on the value . This step can be explained under the assumption of a fixed limit of local stresses . Taking into account the structural characteristics of the materials one can suggest that has a maximal value for inorganic crystalls, a little lesser for amorphous materials and has a smaller value for organic polymers. Indeed, the corresponding inverse behavior of takes place (see Fig. 3).
Deviations from the behavior in the heat release can be related to the increase of the spectral density during the cooling process. This means a gradual increase of local stresses and/or sizes of stress concentrated regions. In the last case, an increase of will be accompanied by a shift of to the left. This can explain an abrupt decrease of in 3-mp/2,3-dmb.
It should be stressed that there is no evidence of any deviations from behavior in the heat release in inorganic materials. Therefore, a suggested increase of local stresses should be a specific property of organic materials. We suppose that local stresses are influenced by an expansion of the sample during the heat release process. Indeed, an average thermal expansion coefficient is related to , Grüneisen parameter and isothermal compressibility as
| (14) |
According to (4), the heat capacity grows with time. At the same time, in organic polymers and have a several orders bigger and lesser values, respectively, in comparison to the inorganic materials. A decrease of is a result of strong electron-phonon interactions in polymers. Hence in polymers we can expect a more pronounced influence of . Even a slow drift of can provoke a formation of additional local stresses and, as a consequence, a raising quantity of anomalous TLSs.
As another possible explanation of this phenomenon (which would also approve Eq. (8)) one can suggest the existence of an unknown additional channel which provides the relaxation of TLSs in the time independently of the barrier heights. Unfortunately, the origin of this sort of TLS relaxation is still an open question. A possible candidate is the resonant relaxation based on TLS-TLS interaction at very low temperatures suggested in Burin .
IV Summary
Summarising, our analysis shows that all glasses (amorphous organic, inorganic, and glasslike crystalline materials) reveal an universal behavior of the relation between the heat release and the heat capacity in good agreement with our model of anomalous TLSs (see Table 1). The heat release shows a similar behavior in various organic polymers and has some peculiar properties in comparison with inorganic glasses and glasslike crystals. We have shown that despite these peculiarities all existing heat release data can be explained within the model of local mechanical stresses where specific properties of organic polymers are caused by a lower value of the maximum stress and a more pronounced drift of an average thermal expansion coefficient due to a bigger value of isothermal compressibility and stronger electron-phonon interaction. It should be stressed that organic glasses are convenient for further experimental investigations of the giant heat release owing to their longer .
| Material | case | Ref. | |||||||
|---|---|---|---|---|---|---|---|---|---|
| J-1 m-3 | J-1 m-3 | K | K | K | K | ||||
| a-SiO2 | 8.0 | 2.0 | 4.0 | 4.0 | 4.8 | 14.5 | c5 | ||
| NbTi | 43.2 | 5.3 | 8.2 | 4.4 | 5.4 | 47 | c1 | ||
| NbTi9%H | 120 | 45 | 2.7 | 4.8 | 5.9 | 32 | c1 | ||
| ZrO2CaO | 18.5 | 5.7 | 3.2 | 5.5 | 6.9 | 35 | c7 | ||
| ZrO2CaO | 18.5 | 19.2 | 0.96 | 5.5 | 6.9 | 64 | c7 | ||
| NbTi9%D | 86 | 84 | 1.02 | 2.5 | 3.1 | 51 | c1 | ||
| PMMA | 4.8 | 28 | 0.30 | 2 | c9 ; c10 | ||||
| Epoxy resin | 10 | 7.8 | 1.28 | 2.0 | 2.6 | 60 | c14 | ||
| PS | 7.9 | 9.5 | 0.83 | 1 | c13 | ||||
| 3pm/2,3dmb | 16.7 | 2.5 | 3.0 | 20 | c12 | ||||
| pentanol | 4.1 | 4.0 | 3.5 | 12 | c18 |
This work has been supported by the Heisenberg-Landau Program under Grant No. HLP-2013-26.
List of Symbols
| The thermal expansion coefficient. | |
| Grüneisen parameter. | |
| : Effective deformation potential for longitudinal or transversal phonons. | |
| The tunneling energy. | |
| Isothermal compressibility. | |
| The Gamow parameter. | |
| Mass density. | |
| Mechanical stress. | |
| Pre-exponential factor in the Arrhenius law. | |
| Relaxation time of tunneling systems due to phonon-assisted interaction for anomalous TLSs. | |
| Relaxation time of tunneling systems due to phonon-assisted interaction. | |
| Thermally activated relaxation time of TLSs. | |
| Minimum relaxation time of TLSs. | |
| A parameter proportional to with dimensions J-3 s-1 | |
| The specific heat at constant pressure. | |
| Deformation potential of TLSs. | |
| The zero-point energy. | |
| Average energy of TLSs causing the heat release. | |
| The mass. | |
| Constant density of states of TLSs | |
| Constant density of states of anomalous TLSs. | |
| Constant density of states deduced from the heat capacity. | |
| Constant density of states of normal TLSs. | |
| Constant density of states deduced from the heat release. | |
| Constant density of states of anomalous TLSs deduced from the heat release long time measurement (). | |
| A fit parameter of Eqs. (8) and (10). | |
| Cooling rate in heat release experiments. | |
| Freezing temperature; below it and for typical cooling rates the TLSs remain in a non-equilibrium state and contribute to the heat release. | |
| Measuring temperature in heat release experiments. | |
| “Charging” temperature in heat release experiments. | |
| Crossover temperature where the thermally activated relaxation time equals the tunneling relaxation time. | |
| Freezing temperature for anomalous TLSs. | |
| Freezing temperature for normal TLSs. | |
| A fit parameter of Eq. (10). | |
| A fit parameter of Eq. (8). | |
| A fit parameter of Eq. (6) | |
| A fit parameter of Eq. (8). | |
| A fit parameter of Eq. (6). | |
| Potential barrier height. | |
| Potential barrier height of anomalous TLSs. | |
| The average barrier height of the TLSs causing the heat release (is directly proportional to the freezing temperature). | |
| Volume of the sample | |
| Activation volume. | |
| The sound velocity. |
References
- (1) S. Sahling, S. Abens, V.L. Katkov, and V.A. Osipov, Phys. Rev. B 82, 174204 (2010)
- (2) H. Eyring, J. Chem. Phys. 4, 283 (1936)
- (3) Haward R. N. and Young R. J. The Physics of Glassy Polymers (London: Chapman and Hall) 1997
- (4) P.W. Anderson, B.I. Halperin, and C.M. Varma, Phil. Mag. 25, (1972)
- (5) W.A. Phillips, J.Low. Temp. Phys. 7, 351 (1972)
- (6) D. Tielbürger, R. Mertz, R. Ehrenfels and S. Hunklinger, Phys. Rev. B 45, 2750 (1992)
- (7) S. Sahling, S. Abens and T. Eggert, J. Low Temp. Phys. 127, 215 (2002)
- (8) D.A.Parshin and S. Sahling, Phys. Rev. B 47, 5677 (1993)
- (9) S. Abens, K. Topp, S. Sahling, and R.O. Pohl, Czechoslovak Journal of Physics 46, 2259 (1996)
- (10) S. Sahling, A. Sahling, B.S. Neganov, and M.Koláč, Solid State Commun. 59, 643 (1986) and S. Sahling, A. Sahling, and M. Koláč, J. Low Temp. Phys. 73, 407 (1988)
- (11) J. Zimmermann and G. Weber, Phys. Rev. Lett. 46, 661 (1981)
- (12) J. Zimmermann, Cryogenics 24, 27 (1984)
- (13) R.B. Stephens, Phys. Rev. B 8, 2896 (1973)
- (14) A.L. Burin and Yu. Kagan, JETP 80, 761 (1995).
- (15) H. Maier, B. M. Kharlamov, and D. Haarer, Phys. Rev. Lett. 76 2085 (1996).
- (16) Sahling, unpublished
- (17) Nittke et. al J. Low Tem. Phys., 98, 517, (1995)
- (18) Tunneling Systems in Amorphous and Crystalline Solids, edited by P.Esquinazi (Springer, Berlin, 1998)
- (19) M. Koláč, B.S. Neganov, A. Sahling, and S. Sahling, J. Low Temp. Phys. 68, 285 (1987)
- (20) M. Schwark, Pobell, M. Kubota and R.M. Mueller, J. Low Temp. Phys. 58, 171 (1985)
- (21) P. Doussineau and W. Schön, J. Physique 44, 373 (1983)
- (22) K. Topp Ph. D. (Cornell University 1996)
- (23) E.I. Bunyatova, A. Sahling and S. Sahling, Solid State Comm. 75,125 (1990)
- (24) V.G. Karpov, JETP Lett. 55, 60 (1992)