Anomalous Isotopic Effect of Tunneling States in NbTi-H/D
Abstract
The thermal conductivity, heat capacity and heat release of NbTi, NbTi-H and NbTi-D were measured at low temperatures. All three systems reveal low temperature anomalies typical for structural glasses. It is shown that above a concentration of 2% H or D the tunneling states of the NbTi matrix disappear. Therefore, for higher concentration it is a good system to proof how the change of the mass of tunneling atoms influences the low temperature anomalies. For the heat capacity we found the expected isotopic effect. However, the anomalous isotopic effect observed for the heat release data cannot be explained within the standard tunneling model. A surprising result is that tunneling systems with very high barrier heights, even the systems with the maximum barrier height, influence remarkable the heat capacity and the heat release data at low temperatures. As a possible origin, we consider large-scale fluctuations in thermal expansion which could generate anomalous two-level systems.
pacs:
72.15.Eb, 65.40.Ba, 66.70.-f, 73.40.GkI Introduction
All investigated amorphous solids show quite universal low temperature anomalies of the acoustic, dielectric and thermal properties. Although most of these anomalies can be explained within either the phenomenological tunneling or soft potential model, their microscopic origin is not yet cleared up. Surprisingly, a glassy-like behavior was also observed in some crystalline solids at low temperatures W1 ; W2 ; W3 ; Cleve ; Ray ; Chur . In some plastically deformed crystals (Al,Ta, and Nb) the intrinsic properties of linear defects (dislocations) were found to be of importance Chur . However, the analysis shows that this picture is not universal. For example it is not appropriate for the description of observed glass-like anomalies in alloys.
One of the physically interesting solids is a stabilized cubic zirconium dioxide Abens . In experiments with a Ca stabilized ZrO2 single crystal we found together with a typical glassy behavior of the low temperature properties (like the thermal conductivity, heat capacity, ultra sound velocity and internal friction) a giant heat release, which exceeds typical values for amorphous and other glass-like crystalline solids by roughly two orders of magnitude. The analysis of these data shows that the giant heat release is caused by tunneling systems with extremely large barrier heights. An interesting question is why the relaxation time of these tunneling systems is so short that they can contribute to the heat release in a time scale of minutes? Unfortunately, any theoretical attempts to explain this phenomenon are failed. The reason is that the giant heat release depends on many factors such as the maximum barrier height of the distribution, a zero point energy of tunneling systems, cooling rates, and the thermal expansion of the material.
In this paper, we focus on a study of the low-temperature behavior of NbTi Sahling2 . Ti atoms in NbTi act like traps for atomic hydrogen (H) or deuterium (D). It seems that at low temperatures H or D atoms can change their positions near Ti atoms by a tunneling process thereby causing typical for structural glasses anomalies in the heat capacity Neumaier or in the long-time heat release Schwark . Since the hydrogen in a given NbTi sample can be easily replaced by deuterium, we are permitted to investigate the influence of the mass of tunneling atoms on the low temperature anomalies, which is impossible for structural glasses. Therefore we have measured the thermal conductivity, heat capacity and heat release of NbTi with nearly the same concentration of H or D.
An additional problem is that the internal friction of pure polycrystalline NbxTi1-x with 0.2 0.6 also shows low temperature anomalies typical for structural glasses Cleve . Actually, our measurements of pure Nb0.37Ti0.63 reveal evidence of a glassy behavior for other main thermal characteristics. Thus, additional tunneling states are caused by atoms in the matrix. These tunneling systems are originated from local phase fluctuations between the - and - phases, which are close in their energy Cleve . However, investigations of the crystal structure of NbTi show that a small amount of hydrogen leads to a thermally and mechanically stable single - phase structure Ilyin and we can assume that these additional tunneling states disappear above some critical concentration of H or D.
II Model
Let us start from some useful theoretical background. The experimental data will be analyzed within the standard tunneling model (STM) Anderson1 ; Phillips1 which is based on the assumption that there exist two-level systems (TLSs) with a constant distribution of their asymmetry energy and tunneling parameter
| (1) |
where is a so-called ”spectral density”. For the thermal conductivity, , STM yields
| (2) |
where is the mass density, are the coupling constants between TLSs and phonons, and are the sound velocities of the longitudinal and transversal sound waves. As is seen, the thermal conductivity is very sensitive to magnitudes of the coupling constants.
On the contrary, the specific heat depends quite weakly on the coupling constants. This fact allows one to extract from experiment (here and below we use notation for the parameter when it was extracted from the heat capacity measurements). Explicitly,
| (3) |
where is a characteristic time of the heat capacity measurement and is the minimum relaxation time. can be estimated from the general expression for the relaxation time of a tunneling process
| (4) |
with and
| (5) |
on conditions that .
The long-time heat release is of our main interest here because it is most sensitive to the expected isotopic effect. After a rapid cooling of a sample from some initial (equilibrium) temperature to a final (phonon) temperature , the tunneling systems with relaxation time longer than the time necessary for cooling remain in a non-equilibrium state. Their further relaxation to a new equilibrium state leads to an energy transfer from tunneling systems to phonons Phillips2
| (6) |
and
| (7) |
where is the tunneling parameter extracted from the heat release measurements, is the volume of the sample, and the freezing temperature is given by Parshin1
| (8) |
Here is the effective barrier height of TLS causing the heat release at given time , is the cooling rate at the freezing temperature , and is the constant of the thermal activation rate. The saturation of the heat release above is a consequence of the thermal activation process which dominates at high enough temperatures. The relaxation time at higher temperatures becomes so short that TLSs with given and higher energies reach the equilibrium during the cooling process and do not contribute to the heat release.
Obviously, within the STM . Numerical calculations show that 95% of the heat release observed at fixed time is produced by tunneling systems whose relaxation times lie in the range of . These TLSs are located in a quite small region of the distribution function with for a typical time of the heat release experiments h and varying between 15 and 20. For instance, in structural glasses this range amounts to about 20% of the effective tunneling parameter determined by the equation . Thus, all TLSs causing the heat release at time are contained in a small range of around . If we replace H by D and measure the heat release at the same time we observe the heat release of TLSs with equal . The relation between and is given by Phillips1
| (9) |
where is a distance between potential minima and is the mass of tunneling atoms. Therefore, if we replace H by D and assume that the distribution of TLSs is completely determined by NbTi matrix, the heat release at the same time will be caused by TLSs with markedly smaller barrier heights. Indeed, at equal one obtains as long as . According to Eq. (8) this results in a large isotopic effect in the freezing temperatures
| (10) |
In addition, the distribution parameter should also be changed. From Eq. (9) follows
| (11) |
since the places of D and H and the barrier heights between them are determined by the lattice of NbTi (i.e. and we expect for equal concentrations the same number of TLSs (), which is proportional to .
Thus we expect a drastic change in the maximum value of the heat release
| (12) |
for . In other words, the heat release caused by D saturates at much lower temperature with an essentially smaller peak value.
Assuming that the double-well potential can be formed by two identical harmonic potentials with a shifted position of their potential minima, the tunneling parameter is written as Tielburger
| (13) |
where E0 is the zero-point energy in a single harmonic well. One obtains
| (14) |
This relation will also be tested in our experiments.
III Experimental
Three samples were prepared from the same Nb0.37Ti0.63 target: a large one ( cm3, g) for the heat release experiments, a small one g) for the heat capacity and a long one for the thermal conductivity measurements. Firstly, all these samples were heated up to 650∘C for 24 h at a pressure of mbar to reduce the concentration of trapped H, N and O to values less than 10 at ppm. After experiments with pure NbTi the samples were charged with H by 650∘C and different pressure of hydrogen gas. The H-concentration in the samples was calculated from the mass difference and is given by the ratio of H atoms to the total number of Ni and Ti atoms. In this way H-concentrations ranging between 1 and 50 % were obtained. After experiments with NbTi-H the hydrogen was again reduced to zero (in fact the initial mass of the pure NbTi was obtained again) and than charged with D in the same way.
Heat capacity and thermal conductivity experiments were performed in a 3He -4He - dilution refrigerator, the heat release was measured mainly at K after cooling from different in a 4He cryostat. For the heat capacity measurements both the pulse technique and the relaxation time method were used. A special cryostat with a low and very stable parasitic heat flow to the sample nW was used. The rapid cooling of the sample was realized by a mechanical heat switch. The heat release of the sample was determined from the temperature drift of the sample
| (15) |
where is an addendum heat capacity (the thermometer, the heater, the plate). The total heat capacity (the time dependence of can be neglected) and the heat link between the sample and the sample chamber were measured separately. The sample was fixed by thin nylon threads, which causes by open heat switch together with the electrical wire of the heater and the thermometer the heat link . In some experiments, where the temperature drift was very strong, the heat switch was some times closed during the measurement to reduce the sample temperature to again. Thus, was close to during the whole time of the heat release measurement mK at K).
IV Results and Discussion
IV.1 Thermal conductivity
The thermal conductivity of pure NbTi is shown in Fig. 1 (black squares).
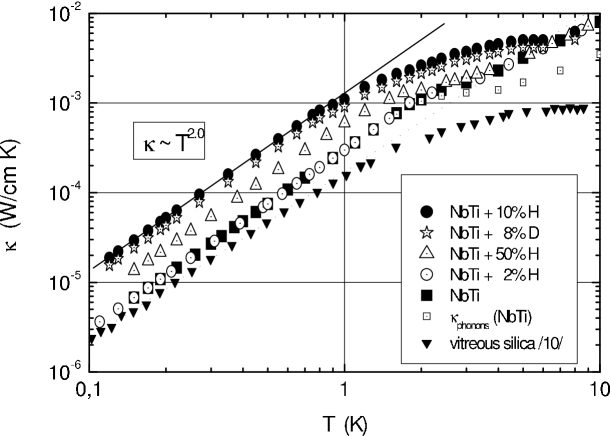
Below 1 K the heat capacity is exactly proportional to with an absolute value close to that of vitreous silica (black triangles). Thus, the thermal conductivity of polycrystalline NbTi exhibits low temperature anomalies typical for structural glasses in accordance with glassy behavior of the internal friction, observed for the same material in Cleve . When we increase H or D concentrations in NbTi the power law remains always unchanged. At the same time, we observed a surprising dependence of the absolute value. Namely, the thermal conductivity of NbTi with 2 % H shows the expected result being about 6 % smaller the value of pure NbTi, i.e. one has an additional scattering on the tunneling states produced by the hydrogen atoms. However, the thermal conductivity of NbTi with 10 % H is 3.4 times larger the value of pure NbTi. A similar result we get with D. A simple explanation of this unexpected behavior is that the local fluctuations, which are responsible for the tunneling states and low thermal conductivity of pure NbTi, disappear at higher concentrations of H or D (). In fact, above some critical concentration (2% 8%) the hydrogen (or deuterium) stabilizes - phases and, as a consequence, one expects that the glassy behavior at low temperatures disappears Ilyin . At the same time, H (or D) produces new tunneling states. For this reason, the thermal conductivity is still glassy-like: it is proportional to but with a much larger absolute value due to smaller coupling constants. We can calculate the parameter from Eq. (2) with m/s, m/s, g/cm3 and Parshin1 . The results are presented in Fig. 2.
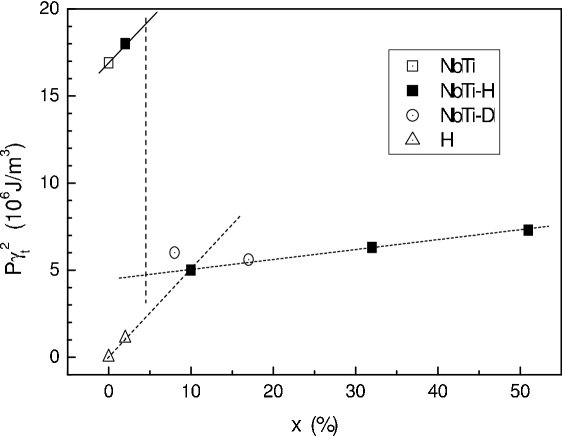
We see clearly the jump of this parameter between 2 and 8 % H or D. The number of the tunneling states produced by H or D increases rapidly with the concentration for and slowly for higher . Since H (or D) is trapped by Ti atoms and changes the positions around them, it is necessary that the new positions are free. For higher concentrations this will be less and less the case and we can even expect a maximum in the dependence of the number of tunneling states on the H or D concentration. Up to 50% this maximum was not observed. Partially this could be masked by an additional scattering on dislocations, which can appear at high concentrations of H or D like in case of hydrogen in cooper wampler ; kolac . We did not try to introduce more than 50% H, since a too high concentration of H destroys the NbTi sample.
IV.2 Heat capacity
Typical results of the heat capacity measurements are shown in Fig. 3.
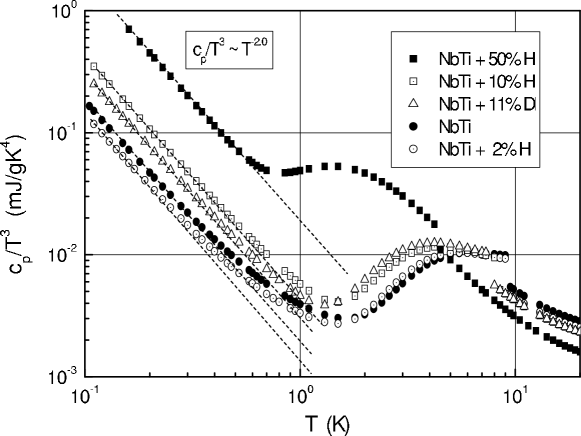
Below 1 K, where the contribution of the electron systems can be neglected, the heat capacity is proportional to (with a coefficient denoted here as ) . This linear term is roughly proportional to the concentration of H or D: mJ/gK2 for 2%. For smaller , increases due to additional tunneling systems caused by the - - fluctuations in NbTi. The distribution parameter of TLSs can be calculated with Eqs. (3)-(5), s. Together with from the thermal conductivity we get also . The most important parameters deduced from the heat capacity are given in Table I.
| Parameter | NbTi | NbTiH2.5% | NbTiH10% | NbTiD11% | NbTiH50% |
|---|---|---|---|---|---|
| (K) | 243 | 253 | 280 | 253 | 303 |
| ats (mJ/gK2) | 2.0 | 1.3 | 4.2 | 3.1 | 18 |
| (g/cm3) | 6.02 | 6.02 | 6.04 | 6.05 | 6.14 |
| (km/s) | 2.64 | 2.75 | 3.04 | 2.75 | 3.29 |
| (1/sK3) | 3.9 106 | 3.4 105 | 2.1 105 | 4.8 105 | 1.4 105 |
| (0.2 K) (s) | 4 | 46 | 76 | 33 | 11 |
| (1/Jm3) | 4.3 1045 | 3.9 1045 | 1.2 1046 | 8.6 1045 | 4.4 1046 |
| (J/m | 1.7 107 | 1.5 106 | 5.1 106 | 5.5 106 | |
| (eV) | 0.39 | 0.12 | 0.13 | 0.16 |
Since the heat capacity and the thermal conductivity were not measured exactly at the same concentration, we used the corresponding extrapolated values from Fig. 2. We do not calculate the coupling parameter for H since a different -dependence of and was observed for 10 %: while is nearly a constant for higher , the linear -dependence of remains unchanged up to 50%. In a case of H we found a different -dependence for both long (heat capacity) and short (thermal conductivity) relaxation time. This different behavior can be explained by making an assumption that the longer relaxation time (with the correspondingly larger tunneling parameter) is caused by a longer distance between two positions (see Eq. (9)). Many more equivalent positions exist for the long-distance tunneling in comparison with the short-distance one and, therefore, a possible maximum of the tunneling rate will be observed at higher concentrations of H or D.
NbTiH2.5% contains nearly the same number of TLSs as in a case of pure NbTi. However, there appear new markedly different tunneling states. The hydrogen produces additional TLSs with an essentially smaller coupling constant (see Table I). Thus, 2.5% H is enough to stabilize the -phase in NbTi.
IV.3 Heat release
IV.3.1 Heat release in NbTi
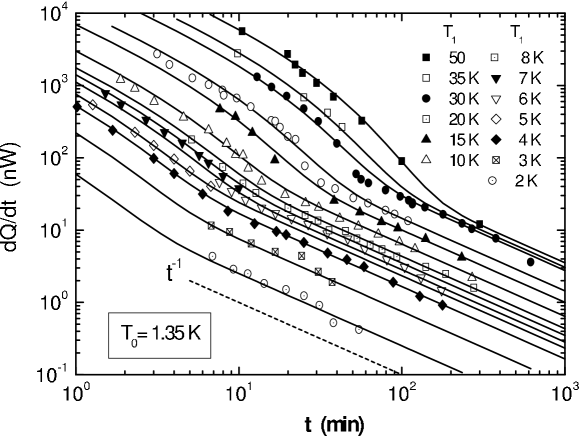
Fig. 4 shows the measured heat release as a function of time after cooling starting with different initial temperatures .
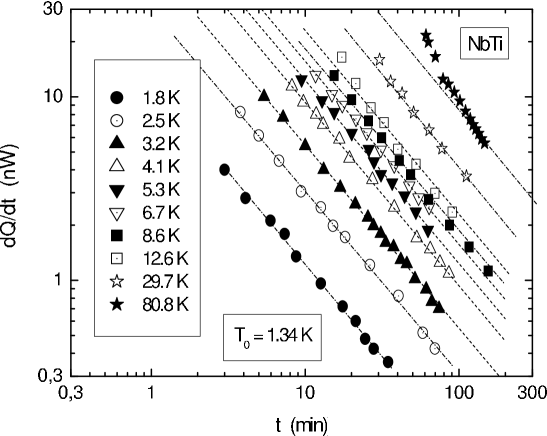
The final temperature was always 1.34 K. The heat release is strongly proportional to (except for K) in agreement with Eq. (6) and thereby with the behavior of structural glasses. At temperatures K the heat release for a fixed time ( min) is proportional to (see the insert in Fig. 5).

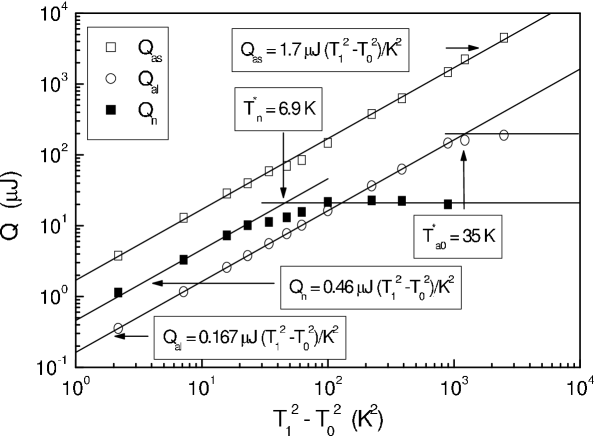
This allows us to obtain the last free parameter in Eq. (6): J-1m-3. For higher temperatures ( K) one could expect the saturation of the heat release as a function of . However, we have obtained a new linear dependence (see Fig. 5) which is saturated at about 50 K only. Such behavior is also well known from different structural glasses Parshin2 : at given time two kinds of tunneling systems with different freezing temperatures contribute to the heat release. For NbTi these two contributions can be easily separated since two freezing temperatures are very different. At higher temperatures, the linear dependence is caused by TLSs with higher freezing temperature K, where the constant at corresponds to the maximum value of the heat release of TLSs with the lower freezing temperature K. These two contributions and the measured heat release as a function of are shown in Fig. 6.
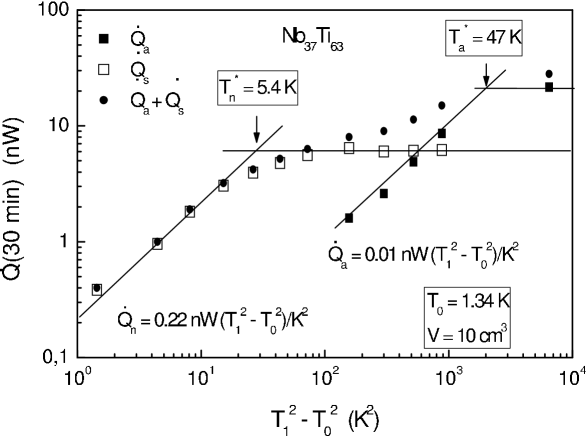
Two corresponding distribution parameters are J-1m-3 and J-1m-3. We will call TLSs with the lower freezing temperature the normal ones and with the higher freezing temperature the anomalous ones.
The value of is very small and takes only 4% of the total value of . However, due to very high freezing temperature ( K) their maximum contribution to the heat release is 3.4 times larger the maximum contribution of the normal TLSs. The heat release is very sensitive to the presence of TLSs with a high freezing temperature.
By using of Eq. (8) one can calculate now the barrier heights of TLSs contributing to the heat release. Since the exact value of for NbTi and NbTi-H/D is unknown, we took for estimations the value of vitreous silica s Sahling1 . Further, for TLSs with we can estimate the corresponding tunneling energy by using of Eq. (4)
| (16) |
where is an average energy of TLSs causing the heat release after cooling from some . Finally, one can find from the relation between and Tielburger
| (17) |
the corresponding tunneling parameter and the zero-point energy . All the calculated parameters and for the normal (n) and anomalous (a) tunneling systems are given in Table II.
| Parameter | NbTi | NbTiH9% | NbTiD9% | a-SiO2 |
|---|---|---|---|---|
| (1044J-1m-3) | 5.3 | 45 | 84 | 2.0 |
| (1044J-1m-3) | 5.1 | 28 | 18.4 | 1.7 |
| (1044J-1m-3) | 0.23 | 17 | 65.6 | 0.3 |
| (K) | 5.4 | 5.9 | 3.1 | 4.8 |
| (K) | 47 | 32 | 51 | 14.5 |
| (K) | 173 | 193 | 98 | 155 |
| (K) | 1606 | 1081 | 1746 | 515 |
| (mK) | 4.5 | 19.2 | 16.2 | |
| (mK) | 1.7 | 8.9 | 4.7 | |
| 15.9 | 14.6 | 14.1 | 16.3 | |
| 19.0 | 17.0 | 18.1 | 17.2 | |
| 11.0 | 13.3 | 6.9 | 9.0 | |
| 87.3 | 63.6 | 96.5 | 25.0 |
Notice that for and we have obtained nearly equal values. A small difference is caused by a higher average energy of the anomalous TLSs in comparison with the normal ones. Within the ordinary STM, the fact that TLSs with very different barrier heights contribute to the heat release at given time could only be explained by suggesting the existence of two kinds of TLSs with very different values of and . However, it will be shown below (see Table III) that the needed relation for the zero-point energy is strongly distorted for anomalous TLSs.
There is a different possibility to explain this surprising result. Namely, since one has only to fulfil the condition we could expect some kind of instability of the effective barrier heights of anomalous TLSs. This means that at the freezing temperature the non-equilibrium state of TLSs with the corresponding barrier height is frozen in, but after cooling this effective barrier height is reduced to . It will be shown below that a strong reduction of the barrier heights occurs as a consequence of local mechanical stresses during the cooling processes. In this case, all TLSs should have the same value of .
Another interesting result follows from the comparison of the distribution parameters deduced from the heat capacity and the heat release. From the STM we expect that . However, our experiment yields (see Tables I and II), i.e. there is an additional contribution to the heat capacity which does not influence the heat release. Since this discrepancy was also observed in other materials Parshin2 ; Sahling1 ; Sahling2 including structural glasses, we will discuss this problem in more detail in chapter IV.4.3.
IV.3.2 Heat release in NbTi-H/D
Figs. 7 and 8 show the heat release of NbTiH9% and NbTiD9% as a function of time after cooling from different initial temperatures to .
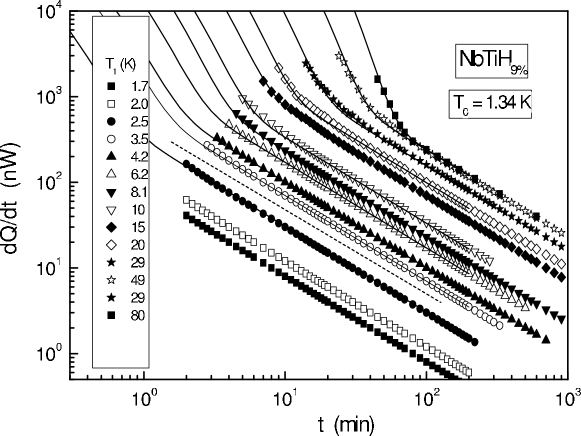
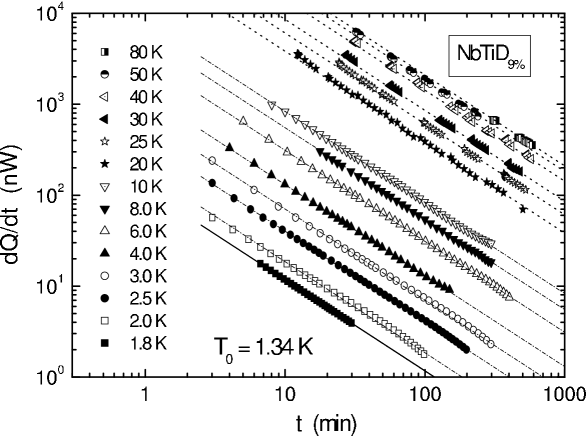
In contrast to both NbTi and NbTiD9% an additional nearly exponential contribution to the heat release was observed for NbTiH9% at temperatures K. Notice that this behavior is not a consequence of different cooling: the cooling rate was the same for NbTi, NbTiD9% and NbTiH99%. At longer time the heat release was found to be again strongly proportional to in agreement with Eq. (6). The further analysis was performed just as described above for NbTi. Again, two kinds of TLSs with different freezing temperatures were found. The separated contributions of both normal and anomalous TLSs as well as the measured values of the heat release for min as a function of are shown in Figs. 9 and 10.

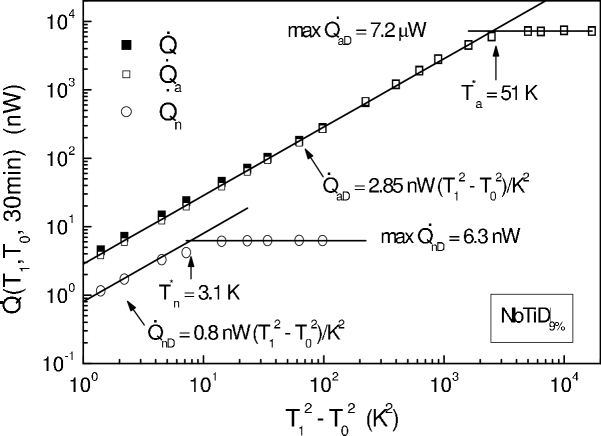
The corresponding parameters , and are given in Table II. Figs. 9 and 10 show clearly the markedly different behavior of the isotopic effect for the normal and anomalous TLSs. While the change of H to D leads to a reduction of the maximum heat release of normal TLSs, the maximum heat release of anomalous TLSs increases significantly. This increase is mainly caused by an increase of : (!)
Notice that in the soft potential model (SPM) the distribution parameter is not a constant like in the STM and decreases weakly with increasing (see Ref. Parshin2 ). In this case the absolute value of the heat release will be smaller than expected from the STM. For instance in vitreous silica this gives roughly a factor of 2 between the distribution parameter deduced from the heat capacity and the heat release in better agreement with the experimental results. In this case a different time dependence should be observed for the heat release, i.e. the relaxation is faster than . Numerical calculation within the SPM yields for vitreous silica . However, the very precise heat release data of vitreous silica give exactly , in agreement with the STM (see Ref. Sahling1 ). Such a faster relaxation was not also found for all other amorphous and glass like crystalline solids.
At the same time, the saturation of the heat release above the freezing temperature is exactly the same, since actually we introduce this temperature from the SPM (see Ref. Parshin2 ). Thus, the heat release data of Ca stabilized ZrO2 and NbTi-H, the unexpected isotopic effect NbTi-H/D and the discrepancies between the distribution parameters deduced from the heat capacity and heat release cannot be explained within the SPM.
IV.4 Isotopic effect
For the normal contribution to the heat release we found the expected isotopic effect (see Table III).
| Parameter | experiment | calculated |
|---|---|---|
| 1.47 | 1.41 | |
| 1.90 | 2.0 | |
| 1.97 | 2.0 | |
| 6.3 | 6.6 | |
| 1.93 | 2.0 | |
| 1.40 | 1.41 | |
| 0.26 | 1.41 | |
| 0.63 | 2.0 | |
| 0.11 | 6.6 | |
| 0.66 | 2.0 |
We also observed the calculated isotopic effect for the distribution parameters deduced from the heat capacity (see Tables II and III). At the same time, for the anomalous TLSs we found a rather unexpected behavior of the distribution parameters, freezing temperatures and the maximum contribution to the heat release (see Table III and the discussion below).
IV.4.1 Comparison between the data of the heat capacity and the heat release
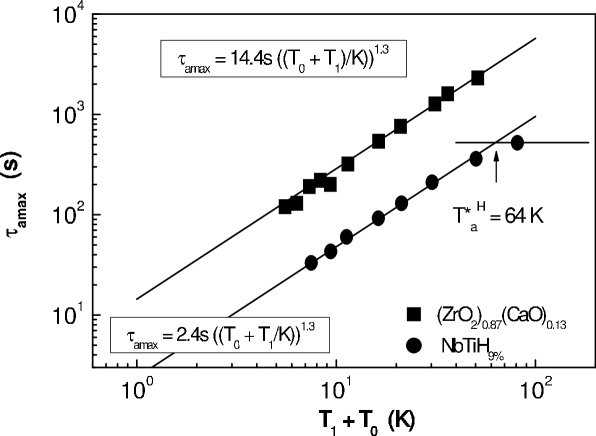
The characteristic feature of anomalous TLSs is their surprisingly high freezing temperature and, correspondingly, the large barrier height (at least at the freezing temperature). In amorphous dielectrics an upper limit of the barrier height distribution was found to lie in the range of 600 K (a - SiO2 Sahling1 ; Keil ) and 3130 K (a - B2O3 Rau ). Thus, the barrier heights of anomalous TLSs are of the order of the maximum barrier height. After cooling, the corresponding maximum tunneling parameter of normal TLSs is and of the anomalous ones , which is essentially smaller . Let us denote the effective tunneling parameter obtained in the heat release measurements as . Generally, one has to consider three possible cases: , and . In the first case, the anomalous TLSs will not contribute to the heat release, however, they will increase the heat capacity, i.e. . This was observed in NbTi, NbTi-H and a-SiO2 (see Table IV). For , the anomalous TLSs contribute to both the heat capacity and the heat release and we expect that . In addition, we have observed a giant heat release after cooling from originated from the high freezing temperature of anomalous TLSs. This is the case for NbTi-D, where . The most interesting case is where we expect to reveal an exponential decrease of the heat release with time at the corresponding maximum relaxation time . Indeed, such behavior was observed in (ZrO2)0.89(CaO)0.11 Sahling2 (see Fig. 11).
A good fit of these heat release data was obtained with
| (18) |
At the giant heat release was observed and (see Table IV).
| Material | ( J-1m-3) | ( J-1m-3) | case | Ref. | |
|---|---|---|---|---|---|
| a - SiO2 | 8.0 | 2.0 | 4.0 | Sahling1 | |
| NbTi | 43.2 | 5.3 | 8.2 | ||
| NbTiH9% | 120 | 45 | 2.7 | ||
| (ZrO2)(CaO) | 18.5 | 5.7 | 3.2 | Sahling2 | |
| (ZrO2)(CaO) | 18.5 | 19.2 | 0.96 | Sahling2 | |
| NbTiD9% | 86 | 84 | 1.02 |
For the contribution of anomalous TLSs reduces significantly, but still remains nonzero. Thus, with the distribution functions and shown in Fig. 12 we can explain all results of the heat release and the heat capacity measurements presented in Tables III and IV.

Important questions arise: what is the origin of in Fig. 12 and why did we observe a reduced but nevertheless a well defined contribution of anomalous TLSs to the heat release for ? Moreover, comparing the corresponding barrier heights with deduced from the acoustic experiments we found that their values are always smaller. For example, in vitreous silica K while K. In (ZrO2)0.89(CaO)0.11 we found for that K in good agreement with K deduced from the measured on the same sample damping peak of internal friction Abens while for we got K. This is also valid for NbTi-H/D. In NbTi-H is shorter since , and the observed contribution to the heat release is caused by . Their barrier height K. For NbTi-D, is larger and the barrier height of anomalous TLSs causing the giant heat release is K ( min).
In order to answer these questions one has to assume the existence of some process leading to a drastic reduction of to after cooling the sample. For example, if the origin of such process is the mechanical deformation of the sample during the rapid cooling, we would have got some distribution of the internal stresses in the sample. In this case, the normal TLSs will be situated in the regions with a minimal stresses. A maximum change of happens to be in the regions with the maximum deformations. In the intermediated regions there will exist TLSs with -values between and , which could cause in the distribution function . In principle, every process which transforms a part of normal tunneling systems into anomalous ones will produce TLSs with tunneling parameters between these two groups. The appearance of a contribution to the heat release at and is probably the consequence of this fact. From this point of view it is not surprising that for all amorphous and glass-like crystalline solids, where , a contribution of the anomalous TLSs to the heat release was observed.
IV.4.2 Possible nature of anomalous TLSs
As it follows from measured anomalous systems should have large barrier heights. On the other hand they are able to relax in experiment time and give contributions to the heat release and the heat capacity. Furthemore, in accordance with Eq. (18) the edge of the distribution function can be extracted from the heat release measurements in both NbTi-H and (ZrO2)0.89(CaO)0.11. can be shifted more to the left (like for NbTi and a-SiO2) or more to the right (NbTi-D) (see Fig. 12). This is also clearly seen from the wrong isotopic relations for anomalous TLSs (see Table III) as well as from the relation (see Table IV).
As was mentioned above this situation could be explained by either markedly different values of and or some kind of instability which influences barrier heights. Since the correct isotopic relation is not fulfilled for observed , it is naturally to suggest that . Therefore, the second possibility looks more reasonable. Indeed, in Ref. Karpov a generation of strong local mechanical stresses during the cooling of sample was suggested. In this case, the fluctuations in thermal expansion of glass-like system can reach giant values. According to Karpov , the thermal expansion coefficients take random values inside the dilatation centers of the sample. The dispersion in the distribution of is suggested to be much bigger of its mean value: . On the other hand,
| (19) |
where and are the ’global’ (’local’) Gruneisen parameters, respectively, and is the deformation potential. Supposing the normal (Gaussian) distribution of the dilatation centers, the maximum value of is estimated as
| (20) |
The stresses at the local thermal expansion are written as
| (21) |
where is the shear modulus. In accordance with the Eyring model an applied stress results in a linear reduction of the barrier height Eyring
| (22) |
where is a so-called activation volume (a typical volume required for a molecular shear rearrangement). Let be the necessary reduction of the barrier height to make the relaxation time comparable with the experiment time, i.e. , where . Then the minimum value of reads
| (23) |
Therefore, the fulfilment of the condition would be a signal that anomalous TLSs can be produced by random local stresses. Taking typical values , K, K eV, Pa, nm3, one obtains that . This estimation allows us to conclude that mechanical deformations can generate anomalous TLSs.
By fitting with Eq. (18) the heat release data for (ZrO2)0.89(CaO)0.11 and NbTiH9% we can deduce also the dependence of on the average energy (see Fig. 14).
As is seen from Fig. 14, is roughly proportional to . This can be explained by the fact that the sample was repeatedly cooled and warmed during experiment so that every next cycle is accompanied by a small relaxation of internal stresses (there is a hysteresis).
IV.4.3 Explanation of Isotopic effect of anomalous tunneling systems
The assumption that the cut-off in the distribution function of anomalous TLSs is caused by the maximum barrier height of normal TLSs with , i.e.
| (24) |
also explains the observed isotopic effect. Taking into account that and are defined by NbTi matrix we conclude that being independent from the mass of TLSs. Therefore the relation between anomalous tunneling parameters takes the following form:
| (25) |
Since and , we expect to obtain and this relation was indeed observed (see Table III). Thus, according to Eq. (25) with an increase of the case (NbTi-H) is changed by (NbTi-D). As discussed above, in the first case we have , with and, hence, . In the second case, one has , and we observe a giant heat release. All these conclusions agree with the experimental results. Moreover, we can explain now also the additional exponential contribution to the heat release observed just after the cooling of NbTi-H. This behavior is seen when is close to the time necessary for cooling the sample. Let us analyze the heat release data of NbTi-H with Eq. (18) where is determined by ,
| (26) |
and for with the only free fitting parameter .
This fit describes the experimental data shown in Fig. 12 perfectly well with an energy dependence of similar to that observed for (ZrO2)0.89(CaO)0.11 (see Fig. 14).
Thus, s with a corresponding . The estimation of with Eq. (25) gives with a corresponding s, which is much larger our longest measuring time of s in the heat release experiment with NbTi-D.
Notice that the effective masses can be influenced by the dressing effect (see, e.g., Sethna ). However, in our case this effect cannot give any reasonable explanation of the results, since it is necessary that the effective mass of H must be increased by a factor of 4, while at the same time the effective mass of D remains unchanged. In addition, the coupling constants between the tunnelling systems and the lattice are very small for H and D (see Table I).
V Conclusion
In all investigated materials, NbTi, NbTi-H, and NbTi-D, the low-temperature anomalies typical for structural glasses have been observed for main investigated characteristics: the thermal conductivity, the heat capacity and the heat release.
The thermal conductivity of NbTi-H/D increases roughly 3 times for concentrations of H or D larger a critical concentration of 2%. H or D with concentrations larger 2% stabilize the -phases of NbTi. In this way, the TLSs of the NbTi matrix which are caused by local fluctuations between the - and - phases disappear. Thus, at concentrations higher than the critical one, the glassy behavior of NbTi-H/D is determined by the TLSs of H or D only and we have a good system to investigate the isotopic effect of TLSs in glasses.
For the heat capacity we found the expected isotopic effect with the distribution parameter being about 40% larger the value .
Two kinds of TLSs contribute to the heat release at a given time. This follows from their different freezing temperatures. Consequently, TLSs with very different barrier heights exhibit the same relaxation time and contribute at the same time to the heat release. This result agrees with that observed in all other investigated amorphous and glass-like crystalline materials.
For TLSs with the lower barrier heights we have observed all isotopic effects estimated within the standard tunneling model. Namely, the distribution parameter is about 40% larger , the freezing temperature is roughly 2 times larger the value , while the ratio of maximum values of the heat release gives the expected factor close to 6.
A completely different behavior we have discovered for the TLSs with the higher freezing temperatures, which we call anomalous TLSs. Instead of the expected reduction of the distribution parameter in comparison with of about 40% we have observed its increase with the factor of 3.8. The freezing temperature is found to be larger the freezing temperature instead of the expected reduction by the factor of 2 and we have observed a giant maximum value of the heat release, roughly 10 times larger the maximum value in NbTi-H, in contrast to the 6 times smaller expected value. In addition, the distribution parameter is much larger the corresponding value deduced from the heat release data , while for NbTi-D we found an excellent agreement between these two parameters. All these anomalous isotopic effects can not be explained within the standard tunneling model.
We have suggested a simple explanation of these surprising results by making an assumption that a cut-off in the distribution function of anomalous TLSs exists. It can be caused by the cut-off in the distribution of barrier heights at with the corresponding maximum distribution parameter . We have noted three possibilities for the average value of the TLSs contributing to the heat release: , and . In the first case, the anomalous TLSs contribute to the heat capacity, but not to the heat release (except for a small contribution which appears also for with large barrier heights, yet smaller than ). In this case, we have observed for most of investigated amorphous and glass-like crystalline solids including NbTi and NbTi-H. In the second case, the anomalous TLSs contribute to both the heat capacity and the heat release and . A characteristic feature of this case is a giant heat release due to the high freezing temperature of the anomalous TLSs. This is the case for NbTi-D. Thus, the anomalous isotopic effect of the tunneling states in NbTi-H/D is caused by an increase of for NbTi-D in comparison with NbTi-H due to the larger mass of the tunneling atoms at the same distances and maximum barrier heights. Finally, in the most interesting case the exponential time dependence is expected. In fact, all three possible cases were observed in (ZrO2)0.89(CaO)0.11. This is a clear experimental argument that our assumption on the existence of anomalous TLSs with high freezing temperatures and, at the same time, small tunneling parameters is quite reasonable. From theoretical point of view, giant large-scale fluctuations in thermal expansion are expected in glasses and related materials. Our estimations show that arising local mechanical deformations could produce anomalous TLSs.
Acknowledgements.
We thank P. Monceau and J.C. Lasjaunias (Neel Institute, France) for the support of the experimental work and very helpful discussions. This work has been supported by the Heisenberg-Landau program under grant No. HLP-2010-29.References
- (1) W. Wasserbäch, S. Abens and S. Sahling, J. Low Temp. Phys. 123, 251 (2001).
- (2) W. Wasserbäch, S. Abens, S. Sahling, R.O. Pohl and E. Thompson, Phys.Stat.Sol. b 228, 799 (2001).
- (3) W. Wasserbäch, S. Sahling, R.O. Pohl, and E. Thompson, J. Low Temp. Phys. 127, 121 (2002).
- (4) J.E. Van Cleve, A.K. Raydchaudhuri, R.O. Pohl, Z. Phys. B 93, 479 (1994).
- (5) A.K. Raychaudhuri and R.O. Pohl, Phys. Rev. B 46, 10657 (1992).
- (6) D.V. Churochkin, S. Sahling and V.A. Osipov, Phys.Rev. B 71, 014116 (2005).
- (7) S. Abens, K. Topp, S. Sahling, and R.O. Pohl, Czechoslovak Journal of Physics 46, 2259 (1996).
- (8) S. Sahling, D.V. Churochkin, and V.A. Osipov, Journal of Physics CS, 150, 042166 (2009).
- (9) K. Neumaier, H. Wipf, G. Canelli and R. Cantelli, Phys. Rev. Lett. 49, 1423 (1982).
- (10) M. Schwark, F. Pobell, M. Kubota and R.M. Mueller, J. Low Temp. Phys. 58, 171 (1985).
- (11) A.A. Ilyin, M. Yu. Kollerov, and I.S. Golovin, J. of Alloys and Compounds, 253-254, 144 (1997).
- (12) P.W. Anderson, B.I. Halperin and C.M. Varma, Philos. Mag. 25, 1 (1972).
- (13) W.A. Phillips, J. Low Temp. Phys. 7, 351 (1972).
- (14) W.A. Phillips, Rep. Prog. Phys. 50, 1657 (1987).
- (15) D.A. Parshin and A. Würger, Phys. Rev. Lett. 46, 762 (1992).
- (16) D. Tielbürger, R. Mertz, R. Ehrenfels, and S. Hunklinger, Phys. Rev. B, 45, 2750 (1994).
- (17) W.P. Wampler, T. Schober and B. Lengeler, Phil. Mag. 34, 129 (1976).
- (18) M. Koláč, B.S. Neganov, A. Sahling and S. Sahling, J. Low Temp. Phys. 63, 459 (1986)
- (19) D.A. Parshin and S. Sahling, Phys. Rev. B. 47, 5677 (1993).
- (20) S. Sahling, S. Abens and T. Eggert, J. Low. Temp. Phys., 127, 215 (2002)
- (21) R. Keil, G. Kasper, and S. Hungklinger, JNCS 164, 11183 (1993).
- (22) S. Rau, C. Enns, S. Hunklinger, P. Neu and A. Würger, Phys. Rev. B 52, 179 (1995).
- (23) V.G. Karpov, Pis’ma Zh. Eksp. Teor. Fiz. 55, 59 (1992)
- (24) H.J. Eyring, Chem. Phys., 4, 283 (1936).
- (25) J.P. Sethna, Phys. Rev. B 24, 698 (1981).