The complex, dusty narrow-line region of NGC 4388: Gas-jet interactions, outflows, and extinction revealed by near-IR spectroscopy
Abstract
We present Gemini/GNIRS spectroscopy of the Seyfert 2 galaxy NGC 4388, with simultaneous coverage from 0.85 - 2.5 m. Several spatially-extended emission lines are detected for the first time, both in the obscured and unobscured portion of the optical narrow line region (NLR), allowing us to assess the combined effects of the central continuum source, outflowing gas and shocks generated by the radio jet on the central 280 pc gas. The H i and [Fe ii] lines allow us to map the extinction affecting the NLR. We found that the nuclear region is heavily obscured, with E(B-V) 1.9 mag. To the NE of the nucleus and up to 150 pc, the extinction remains large, 1 mag or larger, consistent with the system of dust lanes seen in optical imaging. We derived position-velocity diagrams for the most prominent lines as well as for the stellar component. Only the molecular gas and the stellar component display a well-organized pattern consistent with disk rotation. Other emission lines are kinematically perturbed or show little evidence of rotation. Extended high-ionization emission of sulfur, silicon and calcium is observed to distances of at least 200 pc both NE and SW of the nucleus. We compared flux ratios between these lines with photoionization models and conclude that radiation from the central source alone cannot explain the observed high-ionization spectrum. Shocks between the radio-jet and the ambient gas are very likely an additional source of excitation. We conclude that NGC 4388 is a prime laboratory to study the interplay between all these mechanisms.
keywords:
galaxies: nuclei, galaxies: Seyfert, galaxies: individual: NGC 4388, infrared: galaxies, galaxies: jets1 Introduction
Active galactic nuclei (AGNs) commonly have outflows and jets, and these structures/phenomena may strongly influence the surroundings of the AGN. While direct jet-gas interactions affect the velocity field of the local medium, they also produce fast, auto-ionizing shocks which can significantly influence (or even dominate) the observed emission-line strengths and kinematics. In nearby AGN, the warm (T K), ionized gas in the narrow-line region (NLR) can be resolved on scales of a few tens of parsecs in the optical and near-infrared (NIR). They are therefore useful laboratories for determining the extent and kinematics of the various species in the gas, and the role of shocks in producing the integrated emission-line spectrum (Emonts et al., 2005; Rodríguez-Ardila et al., 2006; Morganti et al., 2013).
Because extinction by dust is lower by a factor of 10 relative to the optical, NIR spectroscopy allows us to probe depths unreachable at shorter wavelengths. Seyfert 2 galaxies are the preferred targets as the line of sight to the nucleus is blocked by the intervening dust and molecular material, allowing the study of the environment of the AGN without the effect of dilution caused by the bright central source.
In this context, NGC 4388, a highly inclined (Veilleux et al., 1999, ;) Seyfert 2 galaxy in the Virgo cluster (Helou et al., 1981), is a prime target for studying possible feedback effects of the supermassive black hole (SMBH) on the distribution and kinematics of ionized gas and stars. To start with, it was one of the first galaxies in which a conically-shaped NLR was detected (Pogge, 1988; Yoshida et al., 2002). WFPC2/HST observations reported by Schmitt et al. (2003) in the [O iii] filter confirmed the V-shaped NLR with opening angle of 90 toward the south, extended over 560 pc in this direction. In the perpendicular direction, [O iii] was detected over 720 pc. Most of the [O iii] emission comes from regions south of the nucleus, except for some emission corresponding to the counter-cone, which is obscured by the host galaxy, at the NE side of the nucleus. Galactic-scale outflows as well as a rich complex of highly ionized gas that extends 4 kpc above the disk were detected by Veilleux et al. (1999). Matt et al. (1994) detected soft X-ray emission extending over 4.5 kpc in observations with ROSAT. Later, Iwasawa et al. (2003) and Bianchi et al. (2006) using Chandra, found that the soft X-ray emission is coincident in extent and overall morphology with [O iii] 5007 Å. In the radio, Stone et al. (1988) and Hummel & Saikia (1991) found that NGC 4388 is double-peaked with a primary peak on the nucleus and a secondary peak 230 pc southwest of it. They also report a plume of radio plasma to the north of the optical nucleus. The good overall match between optical emission-line and radio morphology reported by Falcke et al. (1998) led them to suggest that NGC 4388 is an example of an interaction between a radio jet and ambient gas.
An additional property that makes NGC 4388 interesting is the presence of water maser emission from a circumnuclear disk, allowing accurate measurement of the mass of its SMBH. Kuo et al. (2011), using VLBI, studied the kinematics of the water maser emission and derived a BH mass of 8.5 M. Moreover, Greene et al. (2013) found a stellar nuclear disk with PA of 75, radius of 200 pc, and a 100 pc-scale jet oriented at a PA of 24.
In the NIR, NGC 4388 has not been studied very extensively, with most spectroscopic studies reported in the and bands only (Winge et al., 2000; Knop et al., 2001; Lutz et al., 2002; Imanishi & Alonso-Herrero, 2004; van der Laan et al., 2013; Greene et al., 2014). They all indicate that NGC 4388 is a complicated system with much spatial structure at all wavelengths. Very recently, Greene et al. (2014) found, by means of band IFU data, a drop in the stellar velocity dispersion in the inner 100 pc, interpreted as the signature of a dynamically cold central component. They also report [Si vi] 1.963m and Br oriented at PA, aligned with the jet on similar scales, and also with the [O iii] emission that traces the narrow line region.
Because of the mounting evidence of jet-gas interactions and rich circumnuclear structures/environment in NGC 4388, we are interested in studying the inner 500 pc of this source to more closely examine the physical conditions of the atomic, molecular and ionized gas. Our aim is to carry out, for the first time, a simultaneous analysis of the spectral region 0.84m. It includes the wavelength intervals where the brightest NIR lines in AGNs are located (i.e., [S iii] 0.953 m, He i 1.083 m, [Si vii] 2.483 m), and these lines have not yet been observed in NGC 4388. We perform detailed 1D mapping along PA = 64 of the most relevant NIR spectroscopic properties, searching for features of the morphology and gas kinematics that will help us to understand the origin and nature of the nuclear/circumnuclear gas, and its role within the AGN and outflows already detected in this source.
This paper is structured as follows. In Sect 2 we describe the observations and data reduction. In Sect. 3 we describe the most important NIR features detected in the spectra, analyses the main spectral (line and continuum) properties including the extinction affecting the gas and the main excitation mechanisms that produce the observed lines. Sect 4 discusses the kinematics of the neutral, low, medium and high ionization gas as well as the kinematics of the stellar component. Sect 5 deals with the main ionization mechanisms of the high-excitation gas. Sect 6 contains the main conclusions found from our work. Throughout this paper we adopt the Tully-Fisher distance to NGC 4388 of 19 Mpc (Kuo et al., 2011), which translates into a spatial scale of 92 pc/″. Emission lines with wavelengths shortwards of 1 m will be quoted in Angstroms (Å) while those longwards of that value will be quoted in microns (m).
2 Observations and Data Reduction
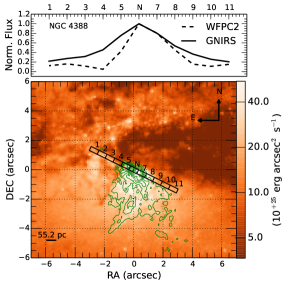
NGC 4388 was observed as part of a set of NIR spectroscopic observations of galaxies from the Palomar nearby galaxy survey (Ho et al, 1997; Mason et al., 2015). The spectra were obtained using the cross-dispersed mode of the Gemini Near-Infrared Spectrograph (GNIRS) on the Gemini North 8.1 m telescope111Program ID: GN-2013A-Q-16. This configuration provides a continuous spectral coverage from 8400 Å to 2.48 m at a spectral resolution of 1200 with a spatial scale of 0.15″/pixel. The 0.3 slit was set at a position angle PA = 64 east of north and centered on the peak of the 1.6 m emission. The seeing during the galaxy observation was 0.6″ as measured from the telluric A1V standard HIP 58616, observed right before the galaxy at a similar airmass. Left panel of Figure 1 shows the slit position overlaid on the WFPC/HST F606W (5935 Å) image of NGC 4388. The contours correspond to WFPC/HST observations of [O iii] 5007, described in Falcke et al. (1998).
The observations used an object-sky-sky-object pattern, with the sky position 50″ away from the galaxy nucleus, free of extended emission or background stars. Four individual on-source integrations of 240 s each were carried out.
The spectral reduction, extraction, and wavelength and flux calibration procedures were performed using version 1.9 of the “XDGNIRS” code detailed in Mason et al. (2015). Briefly, the processing consists of removing cosmic ray-like features, dividing by a flat field, subtracting sky emission, and rectifying the tilted, curved spectra. Wavelength calibration is achieved using argon arc spectra, and then a spectrum of each order is extracted, divided by a standard star to cancel telluric absorption lines, and roughly flux-calibrated using the telluric standard star spectrum. The pipeline merges the different spectral orders for each extraction window into a single 1D spectrum from 0.84 m to 2.48 m. In all cases the agreement in flux between the overlapping regions of two consecutive orders was very good, and scaling factors of 3% were necessary.
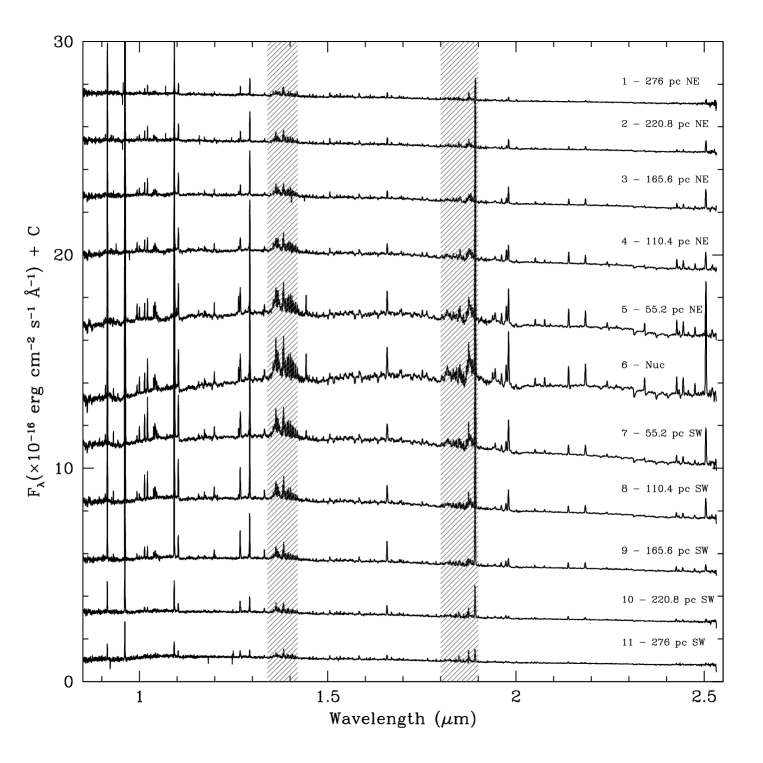
The brightest emission lines clearly extend all along the slit, so 10 off-nuclear extractions were made in the spatial direction, as shown in Figure 1. “N” represents the region where the nuclear spectrum was extracted, centred at the peak of the continuum emission. The labels 1 to 11 mark the different extractions, with 1 to 5 to the NE and 7 to 11 to the SW. The aperture size of the extraction window used in all cases was 0.6″, similar to the seeing measured from the telluric standard.
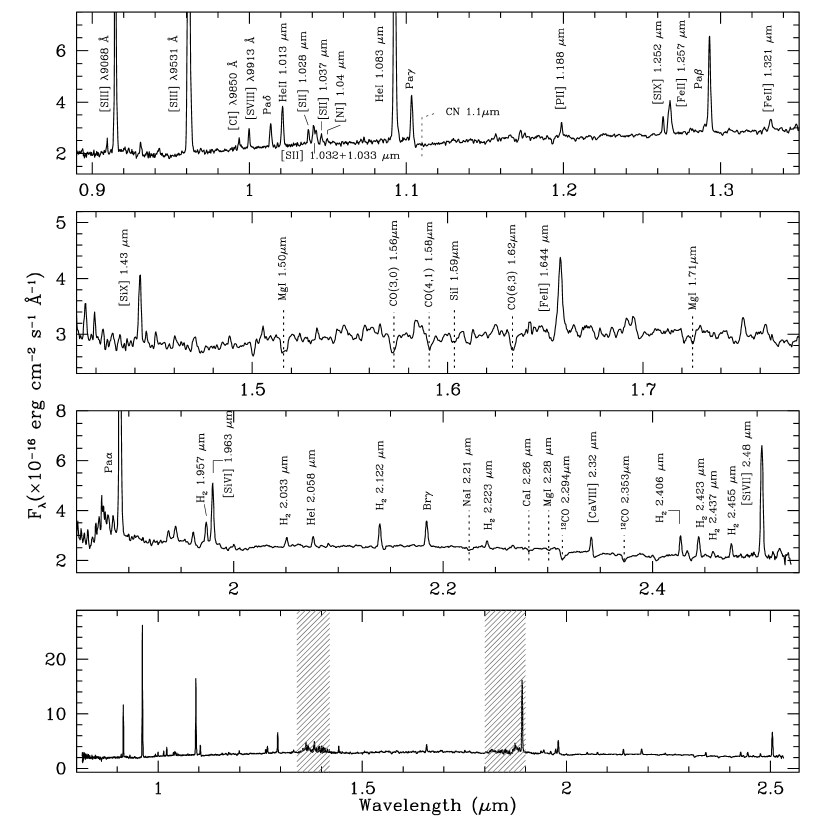
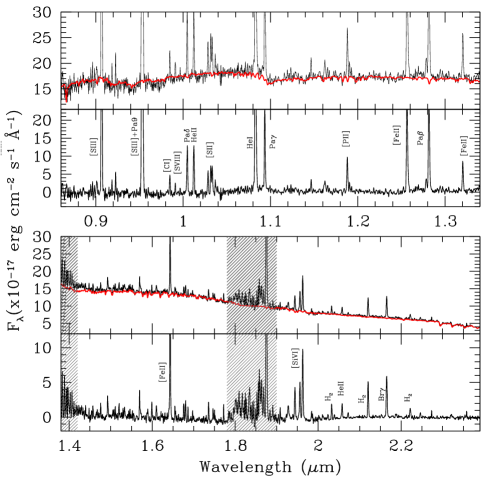
Figure 2 shows the nuclear spectrum in the galaxy frame with the most conspicuous emission lines identified in the laboratory frame. Figure 3 displays all extractions made along the spatial direction, also in the galaxy frame. A Galactic extinction of of 0.09 from Schlegel et al. (1998) was found for this source. Because it is negligible, we have not corrected for this effect.
3 The Near-infrared spectrum of NGC 4388
Figures 2 and 3 reveal that NGC 4388 displays an outstanding emission line spectrum with prominent lines of [S iii] 9068,9531 Å, He i 1.083 m, [Fe ii] 1.257m, Pa, H2 2.122 m, [Si vi] 1.963 m and [Si vii] 2.48 m. These lines all extend from the nucleus to the NE and SW ends of the slit. Extended emission of [Fe ii], Pa, H2 2.122 m and [Si vi] have previously been reported for this AGN (Knop et al., 2001; van der Laan et al., 2013; Greene et al., 2014). Our data, however, reveal that not only are those lines spatially resolved but also [S iii], [C i], He i, [S ix] and [Si vii], which are detected at distances of up to 280 pc NE and SW of the nucleus.
The presence of high ionization lines in the nuclear and off-nuclear spectra of NGC 4388 is also evident from Figures 2 and 3. [Si vii] 2.48 m, a coronal line with IP = 205 eV is the second brightest forbidden line after [S iii] 0.953 m. In addition to [Si vii], we also report here first detections of [S viii] 0.991 m, [Si x] 1.43 m and [Al ix] 2.048m. The latter two are rather compact, with no evidence of extended emission. [S ix] 1.252 m and [Ca viii] 2.32 m are also detected in our data in the nuclear and off-nuclear apertures. These lines were previously reported by Knop et al. (2001) and Greene et al. (2014), respectively.
In addition to the emission lines, the continuum emission of NGC 4388 displays stellar absorption features of CO and CaT in the extreme red and blue portions of the NIR spectra, respectively. Moreover, absorption lines of Mg i, CO, and Si i are also evident in the -band. The CN band at 1.1 m is prominent in the nuclear and circumnuclear apertures, indicating the presence of red giant and/or asymptotic giant branch stars (Riffel et al., 2015a).
Figure 4 displays the light distribution along the spatial direction of the brightest emission lines detected in this object. For comparison, the light profile of the continuum at different wavelengths is also shown. It can be seen that the NLR of NGC 4388 has a complex, irregular structure. For most lines, the brightest emission coincides with the peak of the continuum light (and we identify this location as the active nucleus). The exception is the [S iii] 9531 line, which reaches its maximum 50 pc SW of the continuum peak. In fact, many of the lines show secondary peaks 50 pc SW of the nucleus. Such peaks are particularly prominent in He i, [Si vi] and [Si vii]. A third peak is observed at 150 pc SW from the nucleus, most noticeable in Pa, [Fe ii] and [Si vii] but also detected in other lines. A fourth peak of emission at 150 pc NE of the nucleus is detected, quite prominent in [S iii] and also observed in He i, H i, [Fe ii], [Si vi] and [Si vii].
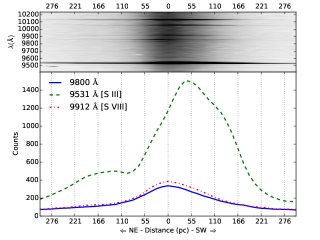
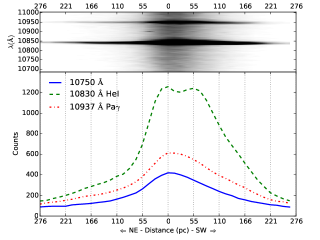
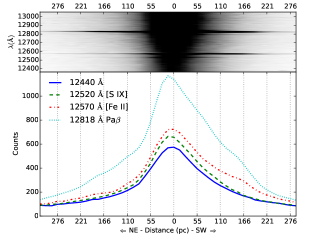
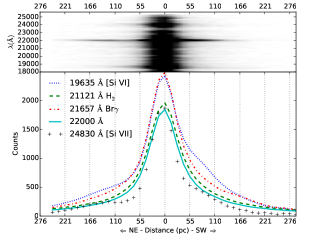
The asymmetry of the line distributions, with excess emission towards the SW compared with the NE, is most pronounced at shorter wavelengths. This reflects the dusty nature of NGC 4388, whose inner few hundred parsecs from the centre to the NE are highly obscured at optical wavelengths. Strong dust lanes crossing the nuclear and circumnuclear region are evident in the WFPC/HST images of Schmitt et al. (2003). The fact that the NIR region is significantly less affected by dust allows us to map this hidden region in a variety of emission lines, something that has not been possible using optical spectroscopy.
The very rich nuclear and extended emission line spectrum found in the NIR for NGC 4388 is not surprising. Pogge (1988), using optical imaging and spectrophotometry, described the complexity of the extended, ionized gas clouds surrounding the nucleus, reaching distances on the kiloparsec scale, well above the plane of the galaxy. When compared to other well-known Seyfert nuclei, NGC 4388 has one of the most richly structured circumnuclear regions yet observed. Our data offer a unique opportunity to extend and compare previous results on the kinematics and ionization structure of NGC 4388 based on molecular and low-ionization gas to the high-ionization gas covering a wide range of ionization potentials.
3.1 Emission-line fluxes
In order to accurately measure weak emission lines, it is necessary to remove the stellar continuum. As we only wish to obtain a good representation of the stellar spectrum, rather than extract information about the stellar population itself, we fit the spectrum with the IRTF library of empirical stellar spectra (, 2009). This library contains 0.8 - 5.0 spectra of 210 stars of spectral type F, G, K, M and S/C. We used a subset of 60 stars, removing similar spectra of stars with the same spectral types. To this we added theoretical spectra of hotter stars (T = 9000K, 10000K and 20000K, log=3.0 and 4.5 dex, solar metallicity - calculated as in Coelho 2014, (private communication) which might be important if a younger stellar population is present in the galaxy. The stellar population modeling was done using the spectral synthesis code STARLIGHT (Cid Fernandes et al., 2004, 2005a, 2005b; Asari et al., 2007). In addition to the stars we included a power-law in the form of to represent the AGN featureless continuum. Extinction is modelled by STARLIGHT as due to foreground dust, and parametrized by the band extinction Av. We use the Cardelli et al (1989) extinction law. To accurately model the stellar continuum, the emission lines are masked out of the fit. We also masked the regions of strong telluric absorption, where their correction was not possible, and the bluest part of the spectrum (), where the flux calibration can be most uncertain.
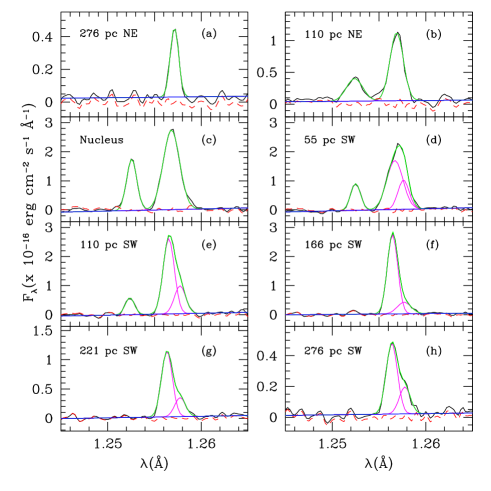
Examples of the fit obtained can be seen in Figure 5, where the stellar template derived for the aperture 9, centred at 166 pc SW, can be observed. The observed spectrum (black line) is overlaid on the stellar population template (red line) followed by the residual spectrum after removing the stellar population. The most conspicuous nebular emission features are marked.
We measured line fluxes on the starlight-subtracted spectra using the LINER routine (Pogge & Owen, 1993), a -squared minimization algorithm that can fit simultaneously up to eight profile functions to a given line or set of blended lines. In addition, LINER also provides values for the peak position and the full width at half maximum (FWHM) of each profile function fit. In NGC 4388 one Gaussian was necessary to represent the observed profiles for most lines. The exception was [Fe ii] 1.257 m, which required two Gaussians in the extractions from 55 pc SW from the centre and outwards. Examples of the Gaussian fit for [Fe ii] 1.257 m are shown in Figure 6. The two uppermost panels, labeled (a) and (b), show the fit done in the apertures centred at 276 pc and 110 pc NE from the nucleus, respectively. Panel (c) shows the result for the nucleus. Note that only one component is evident in these spectra. In contrast, panels (d) to (h) display the best fit for the apertures where two Gaussian profiles were necessary to represent the iron line. Note the presence of the red component, which carries up to one third of the total [Fe ii] 1.257 m flux at some apertures. [S ix] 1.252 m is well-represented by a single Gaussian even at the positions where two components are employed for [Fe ii] 1.257 m (55 pc and 110 pc SW). [Fe ii] 1.644 m, the second most brightest [Fe ii] line, was fit in all apertures by a single-Gaussian. The lack of the red component in that line is probably due to the fact that it is intrinsically weaker than [Fe ii] 1.257 m (by a factor of 30%).
The fluxes of most lines changed little after subtracting the stellar component. The exceptions are [Ca viii] 2.322 m, Pa and He i 1.083 m. The former is severely affected by the CO bandhead at 2.324 m while the latter two lines sit over the broad CN-band at 1.1m.
The starlight-subtracted, integrated fluxes of the most conspicuous lines are reported in table 1. The errors quoted are 1- although a line was considered detected if it was above the 3- errors of the adjacent continuum. Upper limits are 3- representative.
| N∗ | R | [S iii] | [C i] | [S viii] | Pa | He ii | [S ii] | He i | Pa | [S ix] |
|---|---|---|---|---|---|---|---|---|---|---|
| (pc) | 9531 | 9851 | 9913 | 1.005 m | 1.0124 m | 1.032 m | 1.083 m | 1.0937 m | 1.252 m | |
| 1 | -276 | 7.210.03 | 0.1 | 0.140.03 | 0.270.03 | 0.400.03 | 0.300.06 | 1.840.03 | 0.590.03 | 0.1 |
| 2 | -220.8 | 12.510.04 | 0.140.03 | 0.300.04 | 0.550.03 | 0.750.03 | 0.820.12 | 3.490.03 | 1.010.03 | 0.130.02 |
| 3 | -165.6 | 17.530.05 | 0.390.04 | 0.530.03 | 0.950.03 | 1.180.03 | 1.170.15 | 6.260.05 | 1.730.05 | 0.210.02 |
| 4 | -110.4 | 21.410.06 | 0.590.05 | 0.650.07 | 1.290.06 | 1.320.06 | 1.750.20 | 11.090.10 | 2.590.10 | 0.550.07 |
| 5 | -55.2 | 36.270.11 | 1.330.07 | 1.170.08 | 1.860.09 | 1.880.08 | 4.410.34 | 27.400.13 | 3.640.13 | 1.850.10 |
| 6 | 0 | 66.670.10 | 1.130.08 | 1.910.08 | 2.710.10 | 3.890.10 | 6.550.40 | 42.610.15 | 5.820.16 | 2.410.15 |
| 7 | 55.2 | 71.200.06 | 0.560.08 | 1.880.08 | 3.350.10 | 4.930.09 | 5.520.23 | 41.650.11 | 6.030.11 | 1.160.09 |
| 8 | 110.4 | 60.870.08 | 0.880.07 | 1.020.08 | 2.930.07 | 3.610.07 | 4.430.21 | 29.160.09 | 5.250.09 | 0.730.07 |
| 9 | 165.6 | 29.510.08 | 0.460.04 | 0.230.04 | 1.600.06 | 1.540.06 | 2.660.22 | 13.850.07 | 3.140.07 | 0.24 |
| 10 | 220.8 | 9.270.06 | 0.130.03 | 0.110.03 | 0.730.06 | 0.550.04 | 0.600.19 | 4.390.04 | 1.200.04 | 0.1 |
| 11 | 276 | 4.170.08 | 0.18 | 0.13 | 0.300.09 | 0.17 | 0.300.13 | 1.520.04 | 0.480.04 | 0.09 |
| N∗ | R | [Fe ii] | Pa | [Si x] | [Fe ii] | [Si vi] | H2 | Br | [Ca viii] | [Si vii] |
| (pc) | 1.257 m | 1.282 m | 1.43 m | 1.644 m | 1.963 m | 2.1218 m | 2.1657 m | 2.32 m | 2.483 m | |
| 1 | -276 | 0.470.02 | 1.070.02 | 0.08 | 0.380.02 | 0.270.06 | 0.110.01 | 0.160.01 | 0.07 | 0.410.17 |
| 2 | -220.8 | 0.860.04 | 2.150.03 | 0.1 | 0.700.02 | 0.810.06 | 0.280.01 | 0.430.01 | 0.120.02 | 1.050.12 |
| 3 | -165.6 | 1.020.04 | 3.960.03 | 0.2 | 0.930.03 | 1.510.08 | 0.720.02 | 0.920.02 | 0.220.02 | 2.080.09 |
| 4 | -110.4 | 1.780.07 | 6.330.06 | 0.3 | 1.700.07 | 1.840.13 | 2.070.03 | 1.800.03 | 0.320.03 | 2.320.13 |
| 5 | -55.2 | 3.870.13 | 9.200.10 | 1.580.16 | 3.700.11 | 2.770.25 | 3.510.05 | 3.010.06 | 1.290.03 | 4.070.19 |
| 6 | 0 | 6.070.24 | 13.800.18 | 4.260.24 | 7.050.20 | 6.710.58 | 4.780.11 | 6.200.13 | 4.170.06 | 13.400.41 |
| 7 | 55.2 | 3.660.12∗∗ | 12.640.14 | 1.410.13 | 4.690.15 | 4.440.36 | 2.500.06 | 3.180.08 | 1.450.04 | 5.830.26 |
| 1.490.08 | ||||||||||
| 8 | 110.4 | 3.860.09 | 10.810.10 | 0.55 | 4.290.14 | 2.940.17 | 1.640.04 | 2.250.05 | 0.570.05 | 3.270.15 |
| 1.430.09 | ||||||||||
| 9 | 165.6 | 3.710.09 | 6.970.07 | 0.22 | 3.820.06 | 1.230.12 | 1.200.02 | 1.510.03 | 0.190.05 | 1.110.15 |
| 0.760.13 | ||||||||||
| 10 | 220.8 | 1.50.06 | 2.350.05 | 0.15 | 2.050.05 | 0.370.10 | 0.650.02 | 0.600.03 | 0.06 | 0.360.10 |
| 0.580.07 | ||||||||||
| 11 | 276 | 0.680.05 | 0.760.04 | 0.15 | 0.820.03 | 0.100.05 | 0.240.01 | 0.180.02 | 0.06 | 0.190.08 |
| 0.290.05 | ||||||||||
| ∗ Aperture number along the slit as identified in Figure 1 | ||||||||||
| ∗∗ When two entries are listed, the top one is the flux of the blue component and the bottom one that of the red component. | ||||||||||
3.2 Internal extinction distribution
The host galaxy of NGC 4388 is a nearly edge-on spiral with a dust lane crossing the nuclear region. Therefore, dust obscuration plays an important role in the interpretation of the galaxy structure. Optical imaging by Falcke et al. (1998) shows two wedges of reduced emission, demonstrating the presence of obscuring dust bands along the disk of this galaxy right into the nuclear region.
It is then necessary to quantify the amount of extinction towards the nucleus and in the circumnuclear region of NGC 4388 in order to determine the true luminosity of both the active nucleus and the NLR. Large and small values have been reported in the literature for this source. Phillips & Malin (1982), for example, reported an = 0.5 mag based on the H/H ratio for the nucleus. Later, Colina (1992) found = 0.2 and 0.6 mag in regions SW and NE of the nucleus, respectively, and a nuclear extinction of at least 0.3 mag. Petitjean & Durret (1993) found an = 0.32 also from the Balmer decrement. However, few works on NGC 4388 in the literature have addressed this issue using NIR diagnostic lines, probably because the lack of simultaneous observations covering at least two extinction sensitive lines.
The numerous H i and forbidden lines observed simultaneously in the spectra of NGC 4388, spanning a large interval in wavelength, allowed us to evaluate, for the first time, the intrinsic extinction affecting the nuclear and off-nuclear gas within the central 550 parsecs by means of several indicators. For this purpose, we used the Pa/Br, Pa/Br and Pa/Br flux line ratios and the expressions:
| (1) |
| (2) |
| (3) |
where FPaβ, FPaγ FPaδ and FBrγ are the observed emission lines fluxes of Pa, Pa, Pa and Br, respectively, listed in Table 1. In Equations 1 to 3, the extinction law of Cardelli et al (1989) was adopted. The intrinsic ratios FFBrγ = 5.88; Pa/Br = 3.22 and Pa/Br = 2, corresponding to case B recombination (Osterbrock & Ferland, 2006), were employed.
Figure 7 and columns 2 to 4 of Table 2 show the values of E(B-V) found for the nuclear and off-nuclear apertures using the three different H i line ratios described above. Our results show that the region covered by the nuclear spectrum displays the highest amount of extinction, E(B-V) 1.9 mag. To the NE, from the nucleus to distances of 150 pc, the extinction remains large, 1 mag. Farther out, it drops considerably, to E(B-V) = 0.6, becoming negligible at 240 pc. The large reddening found in the centre and the inner 150 pc to the NE is consistent with the system of dust lanes seen in the optical images of Pogge (1988) that obscures the northern portion of the galaxy. To the SW, right after crossing the nuclear region, the extinction drops steeply, reaching E(B-V)0.5 at 150 pc. Farther out, it rises again, to 0.87 mag at 240 pc.
The very good match between the E(B-V) found from different indicators in most apertures indicates the consistency of our approach. Although some discrepancies are noted at some specific locations, overall differences of less than 0.2 mag between the minimum and maximum values of E(B-V) were observed.
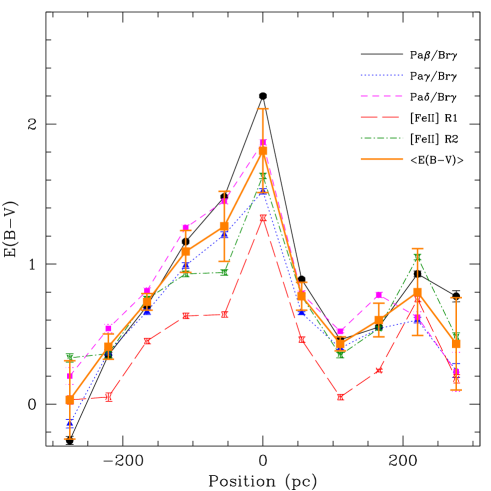
In addition to the H i lines, there are a good number of [Fe ii] lines in the NIR region that originate from radiative transitions involving levels within the 34 multiplet. Having more than one line from the same upper level is useful because their intrinsic line ratio becomes insensitive to density and tempeture effects. Thus, they can be used as a dust extinction diagnostic. The strongest lines that fullfil this requirement and were detected in all apertures are 1.257 m and 1.644 m. The intrinsic 1.257 m/1.644 m ratio is estimated to be 1.25 with an accuracy of 20% (Bautista et al., 2015). Extinction due to dust would decrease this ratio.
We employed the [Fe ii] 1.257 m/1.644 m flux ratio measured along the different apertures in order to map the extinction affecting the region where that ion is formed. As for the H i lines, the law of Cardelli et al (1989) was adopted. The derived equation for E(B-V) employed is,
| (4) |
where F and F are the observed fluxes of [Fe ii] 1.257m and [Fe ii] 1.644m, respectively, listed in Table 1. In the apertures where two components were detected in the former line we opted to sum up their fluxes. Although the presence of splitted lines may suggest separate kinematic systems, we are primarily assessing here extinction due to dust between the NLR and the observer. As both components are in the same line of sight, it is consistent to use the total flux observed. The values of E(B-V) derived using this indicator are listed in Column 5 of Table 2 and plotted in Figure 7 with a dashed red line.
| R | Pa/Br | Pa/Br | Pa/Br | [Fe ii] (R1)1 | [Fe ii] (R2)2 | E(B-V) |
|---|---|---|---|---|---|---|
| -276 | -0.260.03 | -0.140.03 | 0.200.06 | 0.030.03 | 0.330.03 | 0.030.28 |
| -220.8 | 0.350.02 | 0.370.02 | 0.540.03 | 0.050.03 | 0.360.03 | 0.410.09 |
| -165.6 | 0.700.01 | 0.660.02 | 0.810.02 | 0.450.02 | 0.750.02 | 0.730.06 |
| -110.4 | 1.160.01 | 0.990.02 | 1.260.02 | 0.630.02 | 0.930.02 | 1.090.15 |
| -55.2 | 1.480.01 | 1.210.02 | 1.450.02 | 0.640.02 | 0.940.02 | 1.270.25 |
| 0 | 2.200.01 | 1.520.02 | 1.870.02 | 1.330.02 | 1.630.02 | 1.810.30 |
| 55.2 | 0.890.01 | 0.650.01 | 0.790.02 | 0.460.02 | 0.770.02 | 0.770.10 |
| 110.4 | 0.460.01 | 0.400.01 | 0.520.01 | 0.050.02 | 0.350.01 | 0.430.05 |
| 165.6 | 0.550.01 | 0.540.01 | 0.780.02 | 0.240.01 | 0.540.02 | 0.600.12 |
| 220.8 | 0.930.02 | 0.600.02 | 0.620.04 | 0.750.02 | 1.050.04 | 0.800.31 |
| 276 | 0.770.04 | 0.240.05 | 0.230.14 | 0.180.03 | 0.480.14 | 0.430.33 |
| 1 Values determined using an intrinsic line ratio [Fe ii] 1.257 m/1.644 m of 1.25 (Bautista et al., 2015) | ||||||
| 2 Values determined using an intrinsic line ratio [Fe ii] 1.257 m/1.644 m of 1.36 (Bautista & Pradhan, 1998) | ||||||
Although the overall shape of the dust distribution profile found for iron is very similar to that of hydrogen (see Figure 7), our results point out that the reddening determined from the former, when adopting an intrinsic line ratio of 1.25, is considerably smaller than that of the latter. In the nucleus, for example, the difference in E(B-V) reaches 0.9 magnitudes between both indicators. Similar estimates in the literature have found that the E(B-V) determined from the iron lines is significantly larger than that from hydrogen (Riffel et al., 2006; Mazzalay & Rodríguez-Ardila, 2007; Martins et al., 2013). However, note that these works employed an intrinsic line ratio [Fe ii] 1.257m/[Fe ii] 1.644m of 1.36, as originally proposed by Bautista & Pradhan (1998). Column 6 of Table 2 lists the values of E(B-V) derived from Equation 4 but adopting an intrinsic line flux ratio of 1.36. It can be seen that the difference between the iron and hydrogen extinction decreases considerably. Indeed, it becomes indistinguishable at some positions. Note that the latter intrinsic flux ratio is still within the 20% uncertainty determined by Bautista et al. (2015). Because the results found for [Fe ii] using an intrinsic flux ratio of 1.36 better agree with that of H ii, we opted for keeping these latter values.
Based on the E(B-V) values listed in columns 2 to 4 and colum 6 of Table 2, we determined the average extinction for the inner 560 pc of NGC 4388. In this calculation we employ the results found for the three H i ratios and that of iron assuming an intrinsic flux ratio of 1.36. The average extinction, at each aperture is listed in the last column of Table 2 and also plotted in Figure 7. The results confirm that the central regions of NGC 4388 are dusty, with the dust distributed inhomogeneously, peaking at the nucleus with an E(B-V) of 1.810.3 mag. It then decreases both to the NE and SW although it remains high mainly to the NE. To the SW at 220 pc from the nucleus we see a secondary peak that reaches 0.850.3 mag. Thanks to the reduced sensitivity of the NIR to dust, we are able to see, for the first time, emission from the NE side of the galaxy not observed before in the optical
3.3 Emission line ratios and excitation structure
The rich nuclear and extended emission line spectra of NGC 4388 allow us to study how the gas ionization varies with distance to the central source as well as to gather information about the mechanisms that power these lines. Results obtained by means of imaging and long-slit spectroscopy reveal that line ratios like [Fe ii]/Pa and H2/Br may vary dramatically on scales of 100 pc near the nuclei of Seyfert galaxies (Mazzalay & Rodríguez-Ardila, 2007; Knop et al., 2001; Ramos-Almeida et al., 2006; Mezcua et al., 2015). The analysis of these line ratios points to partially ionized regions created by X-ray photoionization from the nucleus or shocks from the interaction of outflowing gas, or both. This complex scenario has been confirmed in the last decade thanks to the gain in angular resolution provided by adaptive optics (AO) observations. The distinct flux distributions and kinematics of the H and [Fe ii] emitting gas in nearby AGNs show that the former is more restricted to the plane of the galaxy, with the nuclear disc being fed by gas coming from the outer regions. The [Fe ii] traces the outflows related to radio jets, evidenced by the highest velocity dispersion values (up to 150 km s-1) and the highest blueshifts and redshifts of up to 500 km s-1 of these lines when compared to the stellar rotation velocity or velocity dispersion of other emission lines (Riffel & Storchi-Bergmann, 2011; Riffel et al., 2013; Mazzalay et al., 2015).
Most of the studies (including the ones with NGC 4388) aimed at studying the excitation mechanisms leading to the observed emission line spectrum are restricted to the [Fe ii] and H2 lines, and very few works have traced the gas distribution using emission lines that are usually the most prominent ones in the NIR region. This is the case of [S iii] 9531 and He i 1.083 m. The former can be considered as the equivalent of [O iii] 5007 because of the similarity in the ionization potential of both lines. The latter is emitted in a 2 to 2 transition and because of its small energy change ( = 1.14 eV), it is readily collisionally excited from the metastable 2 triplet state. For that reason, it can potentially be a useful indicator of the density of the NLR.
Using the fluxes listed in Table 1 we have plotted in Figure 8 the line flux ratios [S iii]/Pa, He i/Pa, [Si vi]/Br, [Si vii]/Br, [Fe ii]/Pa, and H2/Br. For the [Fe ii] 1.257 m line, only the flux of the blue component was employed. As will be shown in Sect 4, the gas emitting that component follows very closely the kinematics exhibited by Pa, specially in the SW side, suggesting that these two lines are emitted by the same parcel of gas. In spite of the strong extinction affecting the circumnuclear region of NGC 4388, the ratios are formed by lines that are close enough in wavelength so that they are nearly or totally independent of the presence of dust. Except for the final two, these ratios have never been presented before for this source.
Overall, Figure 8 confirms that the gas distribution in the inner 500 pc of NGC 4388 is highly inhomogeneous, with at least two regions of enhanced high-ionization emission lines: one in the centre, and another at 250 pc NE of the nucleus. Both, the [S iii]/Pa and the silicon lines ([Si vi] and [Si vii]) display high ratios at these locations, with values in the off-nuclear position as high or higher than those in the nucleus. To the SW, the silicon lines drop considerably in intensity relative to Br from 100 pc of the nucleus to 280 pc.
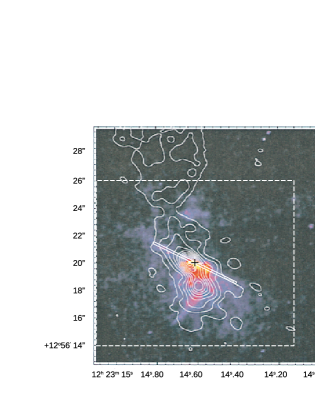
These results are consistent with the optical maps of the central region of this source presented by Falcke et al. (1998). Their uppermost right panel of Figure 12 (and partially reproduced here in the right panel of Figure 1) displays WFPC2/HST H emission for the inner 12. In this image, it can be seen a bright emission coincident with the nucleus and a faint cloud at RA = 12h 14m 76s; DEC = 14 56 21 that should be enhaced in the NIR because of the reduced sensitivity to dust. We associate the later region to the high-ionized peak detected at 250 pc NE of the nucleus.
The behaviour of the He i line relative to hydrogen contrasts with what is seen with the higher ionization lines. It displays a flat peak in the central 100 pc and then drops steeply to the NE, reaching less than half the peak value at 270 pc. To the SW, the line ratio also decreases but more smoothly. If the line emissivity of He i 1.083 m is strongly dependent on the gas density, the results show a much larger gas density in the central region of NGC 4388.
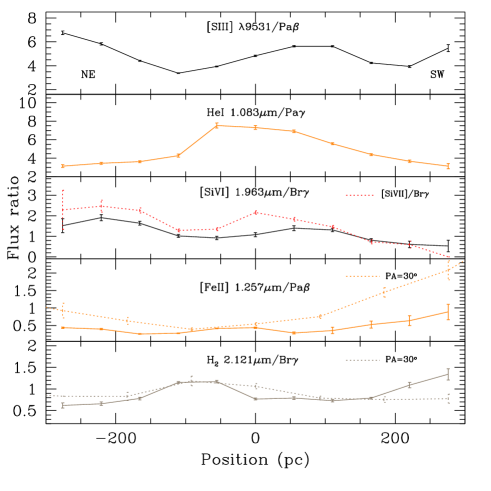
The line ratios [Fe ii]/Pa and H2/Br, plotted in the last two panels (from top to bottom) of Figure 8, confirm previous results presented by Knop et al. (2001) using and band spectroscopy. They employed a slit position angle of 30, very close to the orientation of the elongated, jetlike radio structure at PA=24. Their results are also shown in Figure 8 with dotted lines for comparison. For [Fe ii]/Pa, both this work and Knop’s et al. data shown an increase in the values of the ratio towards the SW, starting from the position where double-peak iron lines show up, suggesting an extra-source of line excitation. Knop et al. (2001) do not reported splitted iron lines. However, in their figure 13 it can be noticed broad assymetric iron lines SW of the nucleus.
We interpret the enhancement of the [Fe ii]/Pa ratio to the SW as direct evidence of shocks produced by the interacion between the radio-jet and the ISM gas. The larger value of that ratio, relative to the one found in the nucleus, is more pronounced in the Knop et al. (2001) data than in ours. This is consistent with the fact that the slit in Knop’s et al. observations was nearly aligned to the elongated radio structured to the SW. To the NE, our data show a subtle decrease in the values of the ratio and then an increase 200 pc NE and outwards. The relationship betwen [Fe ii] and radio-emission is well-know since Forbes & Ward (1993). They found that the strength of the former in the central regions of AGNs is tightly correlated with the 6-cm radio emission. This correlation has been widely confirmed by means of AO NIR integral field unit (IFU) observations in several AGNs (Riffel & Storchi-Bergmann, 2011; Riffel et al., 2015a, b) at spatial scales of a few parsecs. All these works clearly evidence that the interaction of the radio jet with the gas produces wings in the [Fe ii] line profiles at locations around the radio hotspots. In single-Gaussian fits, this effect appears as an enhancement of , similar to what is observed in the [Fe ii] lines to the NE (See Sect 4).
The line ratio H2/Br shows values 1 in most of the apertures, including the nucleus. The exception is the region between 50 pc and 100 pc NE of the AGN, when it increases to 1.2 and at 200 pc SW and outwards, where it reaches 1.3. Our results agree to those reported by Knop et al. (2001) and Greene et al. (2014). They can be understood if we consider that most of the H2 is located in a nuclear disk with a PA of 90. As our slit is positioned along the edge of the ionization cone, both above and below the disk, the values of the ratio are low within the cone (H2/Br1) and larger in the regions dominated by the disk (H2/Br1).
The results discussed above highlights the very complex nature of the nuclear and circumnuclear region of NGC 4388. Our data reveal what is probably one of the best pieces of evidence of the intricated mixture of an AGN, a radio-jet, dust and circumnuclear gas. The detection of splitted [Fe ii] lines SW of the nucleus points out to this scenario. Shocks produced by the interaction between the jet and the NLR gas enhanced this emission. Observations at superior angular resolution as provided by adaptive optics and sub-arsecond radio observations of the jet with VLA would be helpful to unveil at greater detail this turbulent cauldron.
4 Stellar and gas kinematics of NGC 4388
The velocity and excitation structure of the NLR of NGG 4388 is widely known for being very complex (Corbin et al., 1988; Veilleux et al., 1991) both at optical and radio wavelengths. It has been described by rotation plus outflow by several authors (e.g., Veilleux et al., 1999, 2001; Greene et al., 2014). The radio-emission morphology suggests a collimated AGN-driven outflow reaching 200 pc south of the nucleus (e.g., Stone et al., 1988; Falcke et al., 1998). The extended optical emission has two components: One associated with the galactic disc and another reaching 50″ (4 kpc) above the galactic plane in the form of two opposite cones (Pogge, 1988; Corbin et al., 1988; Falcke et al., 1998; Veilleux et al., 1999). The current scenario for this object is that the north edge of the galaxy is the near side. We see primarily the south ionization cone coming roughly towards us and the northeast ionization cone directed away from us. In the optical region, the northeat cone shows up only when it is no longer obscured by the disk. The reduced sensitivity of the NIR to dust allows that both the northern and southern components of the ionization cone can be observed.
The GNIRS data set allows us to extend our understanding of the stellar and gas kinematics of NGC 4388 by constructing position-velocity (PV) diagrams for extended line emission covering a wide range of species and ionization potentials. As shown by Figure 4, the [S iii] 9531, [S viii] 9913, He i 1.083 m, He ii 1.012m, [Fe ii] 1.257m, Pa, H2 2.122 m, [Si vi] 1.963 m, Br, [Si vii] 2.48 m lines extend all across the inner 560 pc in the NE-SW direction mapped by our slit, providing unique evidence of the gas kinematics around the nucleus. In particular, this list includes three very high-ionization lines: [Si vi] 1.963 m, [Si vii] 2.48 m and [S viii] 0.991m. To the best of our knowledge the latter two have not yet been used for this kind of analysis of this source. In absorption, the CO band heads provide information about the resolved stellar kinematics.
For each of the above emission lines we measured their centroid position in each aperture by fitting a Gaussian function to the observed profile using the LINER routine as described in §3.1. To construct the PV diagram for the stellar component of NGC 4388 we used the penalized Pixel-Fitting (pPXF) method of Cappellari & Emsellem (2004) to fit the 12CO and 13CO stellar absorption band heads around 2.3 m and obtain the line-of-sight velocity distributions (LOSVD) of the stars. The pPXF outputs the radial velocity (V∗), stellar velocity dispersion (), and higher order Gauss-Hermite moments ( and ), as well as the uncertainties for each parameter. As stellar template spectra we used those of the Gemini library of late spectral type stars observed with the GNIRS IFU and NIFS (Winge et al., 2009), which contains the spectra of 60 late type stars. The spectral resolution of the stellar templates (3.2Å at 2.3 m) is better than that of our data. Therefore, we degraded the stellar templates to the same resolution as that of NGC 4388 before running the pPXF to measure the LOSVD.
We also derived the velocity dispersion for [S iii], He i, [Fe ii], Pa, [Si vi], H2 as well as for the stellar continuum. For the emission lines, the velocity dispersion was derived from the full-width at half maximum (FWHM) found from the Gaussian fit when measuring the line centroid along the different apertures. This parameter was left to vary freely during the spectral fits, corrected in quadrature for the instrumental broadening, and then transformed into velocity dispersion using the relationship =FWHM/2.35.
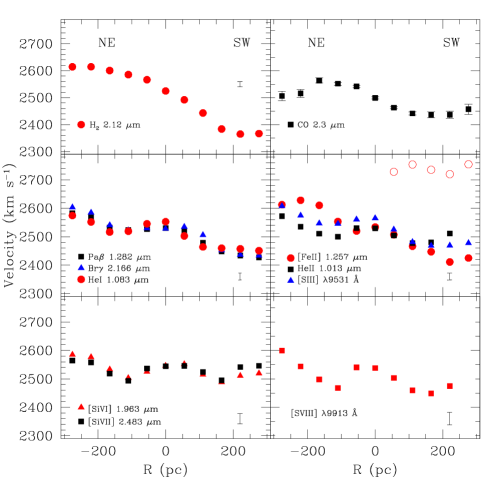
The resulting PV diagrams, shown in Figure 9, exhibit the complex kinematics of NGC 4388 already noted in optical and previous NIR spectroscopy of this source. In all emission lines except the coronal lines, a velocity amplitude of 135 km s-1 is clearly detected along the slit. However, only H2 2.121 m displays an organized velocity pattern, following a curve consistent with disk rotation. The amplitude of the velocity curve is largest in this line, reaching 250 km s-1. This value is slightly larger than the one (175 s-1) found by van der Laan et al. (2013), who also obtained a rotation-like curve for this same line but at a different PA (90).
The stellar component also displays rotation, but it is much flatter than that of the molecular gas, with a maximum amplitude of 60 km s-1 at 150 pc from the nucleus. An organized pattern is also seen in the velocity dispersion of the stellar component, consistent with disk rotation and in agreement with that presented by Greene et al. (2014). While this is apparent in H2, the stars are considerably dynamically hotter than the molecular gas, with the latter concentrated in a thinner disk than the former. The stellar also shows a feature not present in : a drop in the dispersion field between 150-200 pc NE of the centre. At that location, a sudden decrease of nearly 50 km s-1 is observed. This feature is also reported by Greene et al. (2014). Because of their 2D view, they also found, on the same scale, a jump in velocity, PA, and ellipticity, which they attributed to evidence of a transition from an inner disk to more bulge-dominated kinematics. For the particular case of NGC 4388, the most likely explanation of these observations is that there is a disk within the inner 180 pc embedded in the larger-scale bulge/bar.
From our data, the galaxy recession velocity derived for H2 2.121 m (V=25255 km s-1) in the nuclear aperture matches well, within uncertainties, the value reported in the literature using H i 21 cm observations: 25241 km s-1 (Lu et al., 1993). The best-fit systemic velocity for the stellar component is 25004 km s-1. This is 25 km s-1 smaller than the velocity found from the molecular gas. The reason for this difference is not clear but it is probably due to the fact that our data were taken with the slit at just one PA, far from the minor axis of the galaxy.
The observed recession velocities for Pa and Br (in the nuclear aperture) are also in very good agreement (25305 km s-1 and 25287 km s-1, respectively) with the systemic velocity of NGC 4388 derived from H2 2.121 m. For the remaining lines, redshifts relative to the systemic velocity at the galaxy nucleus were measured. The largest redshift is that of [S iii] 0.953 m, 40 km s-1 followed by He i 1.083 m (28 km s-1). The high ionization lines [Si vi] 1.963 m, [Si vii] 2.48 m and [S viii] 0.991m show, on average, redshifts of 22 km s-1. The velocity amplitude measured in the inner 560 pc for these three lines is small: 66 km s-1, 18 km s-1 and 69 km s-1, respectively.
Figure 9 shows that all emission lines but [Fe ii] are blueshifted NE of the nucleus and redshifted SW of it relative to H2 2.121 m. Moreover, the high-ionized gas is non-rotation dominated. The case of [Fe ii] is more complex. It is the only line that clearly display splitted profiles. The blue component follows closely the disk rotation with local perturbations at some positions (full circles in the middle-right panel of Figure 9). The red peak that shows up to the SW (open circles) exhibit no sign of rotation and is strongly redshifted relative to both the molecular and ionized gas across the different apertures where it is detected.
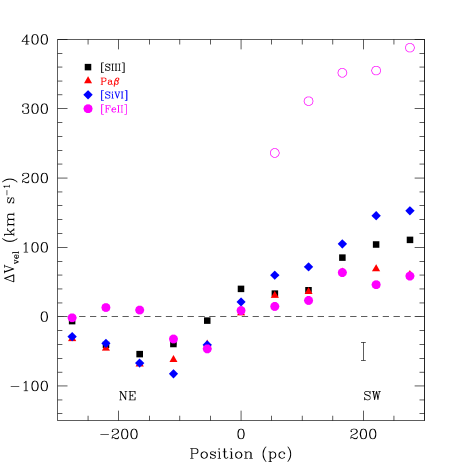
Assuming that the galaxy rotation in the FOV covered by our slit is well represented by the H2 2.121 m rotation curve, differences in velocity between the ionized and molecular gas at a given position can be interpreted as a departure of the ionized gas from the rotation of the galaxy’s disk. This is illustrated in Figure 10, where it is seen that [S iii], [Si vi] H i and the red component of [Fe ii] largely depart from pure disk rotation. The case of the later line is extreme. The residual velocity increases steeply from 240 km s-1 at 55 pc SW of the nucleus, to 400 km s-1 at 276 pc. The clouds emitting the red component of [Fe ii] are clearly part of a distinct system, moving away from the observer. We propose here that this system is produced by interactions between the radio-jet and the NLR gas. This is consistent with the radio-emission morphology, which suggests a collimated AGN-driven outflow reaching 200 pc south of the nucleus (Stone et al., 1988; Falcke et al., 1998).
The residual velocity exhibited by the high-ionized gas in Figure 10 confirms that the bulk of that emission is out of the nuclear disk, very likely distributed along the ionization cone. This hypothesis is consistent with the [Si vi] 1.963 m IFU maps presented by Greene et al. (2014) in their Figures 5 and 7, where it can be seen that this emission runs preferentially at an angle of , tracing the general orientation of the radio jet. The gas velocity for this line measured from our data at the different positions along the slit (PA=64) matches that presented in figure 8 of Greene et al. (2014). This result, in combination with the excellent agreement between the PV curves of the coronal lines in Figure 9 supports that the bulk of this emission is oriented in the direction of the radio-jet, with very little gas in the nuclear disk.
Mid- and low-ionization lines ([S iii], Pa and [Fe ii]) show a more complex kinematics, reflecting the fact that they should be produced by gas distributed both along the disk and along the ionization cone. The blue peak of [Fe ii], for example, follows closely the disk rotation of H to the NE and up to 100 pc SW of the nucleus. Farther out to the SW we see predominantly iron gas that lies along the ionization cone. In contrast, [S iii] is primarily distributed along the ionization cone, although some sulfur gas should lie in the inner 100 pc of the nuclear disk. This is also the case for Pa.
The blueshifted emission shown by the ionized gas relative to the molecular gas to the NE (see Figure 10) along with the redshifted ionized emission SW of the nucleus, i.e., diametrically opposite to the blueshifted northeast complex, points out to a bipolar outflow of extraplanar gas. To the NE, bulk of this component is approaching us while to the SW it is is moving away from us. Line splitting to the southwest clouds may reflect regions of high dissipation of kinetic energy caused by the interaction/deflection of the outflowing gas with ambient NLR gas. We are thus seeing in detail the inner 600 pc of the well-known outflow system of ionized material that extends to kiloparsec scales in this object.
The velocity dispersion of the gas, , covers a broad range of values (see Figure 11), with the largest ones ocurring in or around the nucleus. [Fe ii] 1.257m is the line that displays the largest , reaching 190 km s-1 at the galaxy centre. Moreover, it sistematically displays the largest values of velocity dispersion to the NE. [S iii] also displays a maximum of at the galaxy centre while for [Si vi] and Pa peaks at 55 pc SW of the nucleus. A similar result was also found for [Si vii], Pa and Pa, although for clarity they were omitted from Figure 11). Note that 55 pc SW of the nucleus coincides with the location where [Fe ii] 1.257m splits into two components, suggesting that the kinematics of the ionized gas from this position and outwards is dominated by the outflow component. As was already pointed out in the literature (e.g. Riffel & Storchi-Bergmann, 2011; Riffel et al., 2015a, b, and references therein), the interaction of the radio jet with the gas typically produces splitted [Fe ii] profiles or an enhancement of in single-Gaussian fits at locations around the radio hotspots. Both effects are observed for [Fe ii], giving further support to the role of shocks as an additional source of gas excitation in the central few hundred parsecs of NGC 4388.
In contrast to the ionized gas, molecular hydrogen displays velocity dispersion values of 100 km s-1 across all the FOV of the slit. This reflects the fact that the bulk of this emission is concentrated in the nuclear disk. He i 1.083 m is the only ionized line that shows low values of , at the limit of the spectral resolution. However, we noted an increase in the velocity dispersion at 166 pc SW of the nucleus and outwards.
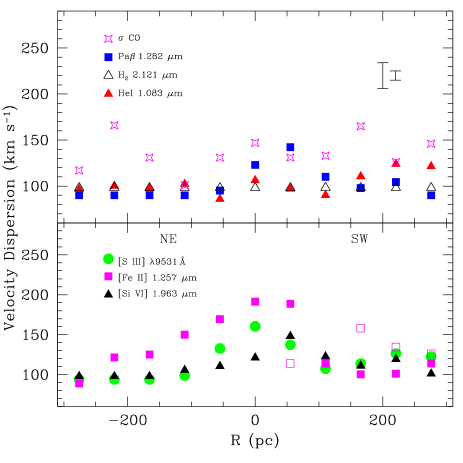
No trend is observed between the velocity dispersion and the ionization potential of the lines. A close inspection to Figure 11 shows that He i is spectroscopically unresolved at all apertures while Pa is only resolved in the nucleus and at 55 pc SW of it. [Si x], the line with the largest ionization potential of all detected in NGC 3288 (see Table 3), is narrower than [Si vi] (100 km s-1 and 120 km s-1, respectively). In contrast, [Fe ii] is the broadest ionized line not only at the nucleus but also to the NE, being resolved in nearly all apertures. Assuming that the gas is virialized, the lack of any correlation between IP and width of the lines implies that the NLR gas we see in NGC 4388 is no longer afected by the potential well of the central supermassive black hole and instead primarily governed by the gravitational potential of the stars. Additional sources of line broadening such as shocks/outflows should become important, particularly in the circumnuclear region. Rodríguez-Ardila et al. (2011), in their study of the NIR properties of 51 AGNs, already noticed the lack of that correlation in some sources while in others it is clearly present.
In summary, the kinematics of the stellar and emission gas within the central 560 pc of NGC 4388 reveals the presence of a nuclear disk where the stars and molecular gas are distributed. In adition, a bipolar outflow of ionized gas is found to be distributed mostly outside the nuclear disk, along the direction of the radio-jet. We also found evidence of an an additional structure, probably a shell of gas, not reveal before and traced by [Fe ii], very likely due to direct interaction between the NLR gas and the radio-jet.
5 The high ionization line emitting gas
Figure 3 shows that NGC 4388 displays a remarkable high-ionization emission line spectrum, with prominent lines seen not only in the the nuclear but also in the off-nuclear apertures. In the wavelength interval covered by GNIRS, lines of [S viii] 0.991 m, [S ix] 1.252 m, [Si x] 1.43 m, [Si vi] 1.963 m, [Al ix] 2.045 m, [Ca viii] 2.32 m and [Si vii] 2.48 m were detected, some of them reported for the first time here. Lutz et al. (2002) had already reported the detection of [Si ix] 3.94 m in this object. All these lines span a large interval of ionization potentials (IPs), from 127.7 eV ([Ca viii]) up to 351.1 eV ([Si x]), see Table 3). The spatial distribution of [S ix], [Al ix] and [Si x], the lines with the largest IPs, is essentially point-like, while [S viii], [Si vi] and [Si vii] extend all over the inner 560 pc region covered by the GNIRS slit. Few objects in the literature reveal such an spatially extended coronal line spectrum. To be best of our knowledge, the only comparable examples are NGC 1068 (Mazzalay et al., 2013) and Mrk 78 (Ramos-Almeida et al., 2006).
| Ion | IP | log |
|---|---|---|
| (eV) | (cm-3) | |
| [S viii] 9913 Å | 280.9 | 10.6 |
| [S ix] 1.252 m | 328.8 | 9.4 |
| [Si x] 1.423 m | 351.1 | 8.8 |
| [Si vi] 1.963 m | 166.8 | 8.8 |
| [Al ix] 2.045m | 284.6 | 8.3 |
| [Ca viii] 2.321 m | 127.7 | 7.9 |
| [Si vii] 2.48 m | 205 | 7.30 |
| [Si ix] 3.94 m | 303 | 6.32 |
The conspicuous coronal line (CL) spectrum in the NIR contrasts strongly with the modest high-ionization spectrum in the optical region. Pogge (1988) and Veilleux et al. (1991), for example, did not detect [Fe vii] 6087 (IP = 97 eV), a CL that is typically strong in AGN coronal line emitters, although Colina (1992) does report it in his integrated nuclear spectrum. Moreover, the SDSS spectrum of this object reveals the presence of [Fe vii] at 5721 and 6084 and very likely, [Fe x] 6374.
To the best of our knowledge, this is the first simultaneous detection of all the above NIR lines in NGC 4388. The fact that three Silicon lines ([Si vi], [Si vii] and [Si x]) and two Sulfur lines ([S viii] and [S ix]) with different degrees of excitation are present in this AGN, allow us to construct line ratios between ions of the same atom that are independent of the metallicity of the gas. Very few sources with a positive detection of at least four out of the five lines above are found in the literature (Oliva et al., 1994; Riffel et al., 2006; Ramos-Almeida et al., 2009; Martins et al., 2010; Mason et al., 2015).
All the above makes NGC 4388 an optimal target to study the relationship between coronal emission and the physical conditions suitable for their formation. It is known that extended, soft X-ray emission coincident in extension and overall morphology with the [O iii] 5007 emission is observed in this object (Bianchi et al., 2006). Does this high-energy emission provide sufficient photons to ionize the gas and produce the extended coronal line spectrum observed? Rodríguez-Ardila et al. (2011), for instance, found that coronal line emission becomes stronger with increasing nuclear X-ray emission (soft and hard). This result would indicate photoionization as the dominant excitation mechanism for the high-ionization lines. However, this trend holds only when considering Type 1 sources alone; it gets weaker or vanishes when including Type 2 sources, very likely because the X-ray emission measured in the latter is not the intrinsic ionizing continuum.
Given the difference in ionization potential between the coronal lines listed in Table 3, their flux ratios are useful to map the ionization structure and mechanisms powering them. Fig. 12 shows, in open circles and from top to bottom, the observed [Si vii]/[Si vi], [S ix]/[S viii] and [Ca viii]/[Si vii] line flux ratios in the different apertures where these lines were detected at the 3- level. Note that the first two ratios are insensitive to abundace effects while the last one was proposed by Ferguson et al. (1997) as a reliable abundance indicator. The three line flux ratios shown for each aperture were corrected for extinction assuming the E(B-V) listed in Column 7 of Table 2 and the law of Cardelli et al (1989).
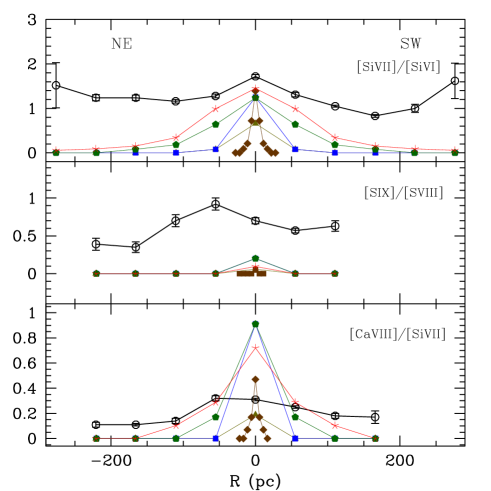
For [Si vii]/[Si vi] (upper panel of Fig. 12), the largest value in the ratio is found in the nuclear region, where it reaches 1.70.04. Outside the nucleus, to the NE, the distribution is nearly flat, with values close to 1.25. Towards the SW, this ratio decreases smoothly from the centre, reaching 1 at 220 pc. Overall, [Si vii]/[Si vi] varies from 0.8 to 1.7 in the inner 550 pc from the nucleus. The [S ix]/[S viii] ratio (middle panel of Figure. 12) peaks at 55 pc NE of the NIR nucleus, where a line flux ratio of 0.90.2 is measured. Further to the NE, it decreases sharply, down to 0.40.07 at 166 pc. In the opposite direction, it decreases smoothly, down to 0.6 at 150 pc from the peak. The distribution of values for this ratio is clearly assymetric. Moreover, [S ix] is significatively more extended towards the NE than to the SW. It is observed up to distances of 220 pc NE of the centre. In contrast, it is detected up to 110 pc to the SW.
The bottom panel of Fig. 12 displays [Ca viii]/[Si vii]. As with the previous line ratio, it peaks at 50 pc NE of the nucleus, with a value of 0.320.02. Farther out, it decreases sharply, falling to about one third of the peak value and remaining nearly constant up to 220 pc NE, where [Ca viii] is no longer detected. Towards the SW, the values of that line ratio at the different apertures decrease smoothly relative to the peak, reaching 0.170.05 at 166 pc. This ratio is also distributed assymetrically.
Ferguson et al. (1997) presented the results of a large number of photoionization simulations of coronal emission lines in AGNs, with the ionization parameter (H) being the fundamental parameter of their models. They found that CLs form at distances from just outside the broad-line region to pc, where is the ionizing luminosity in units of 1043.5 ergs s-1, in gas with ionization parameter -2.0 log (H) 0.75. This suggests that CLs form close to the nucleus in high-density gas and further out from the nucleus in lower density gas. The models provide the peak equivalent width of each line. Since that quantity is referenced to the same point in the incident continuum, ratios between the equivalent width of different lines should indicate grossly their expected relative strengths.
Using Table 1 of Ferguson et al. (1997), a [Si vii]/[Si vi] ratio of 1.2 is predicted. This value is about 40% smaller than the one observed in nucleus of NGC 4388 and is similar to the ratios observed at distances larger than 100 pc. However, Ferguson’s et al. models refer to the peak in the equivalent width distribution, which occurs at distances of a few parsecs from the central source and gas density cm-3. At distances of about 100 pc, the predicted equivalenth width of [Si vii] drops to just a few angstroms, implying in weak emission lines, close to the detection limit. This strongly contrasts with our observations at these distances, with equivalent widths of tens of Angstroms. Sulfur and calcium coronal lines are not that bright as those of silicon but the gas that emits them in NGC 4388 also extends to scales of a few hundred of parsecs.
To further investigate whether photoionisation by the central source can be responsible for the observed coronal line ratios, we followed the multi-cloud approach presented by Kraemer & Crenshaw (2000). To this aim, we generated a grid of models using CLOUDY (version C013.03, Ferland et al. (2013)).
The input to the models include the gas density, ; the distance of the clouds to the nucleus, ; the AGN luminosity, the spectral energy distribution of the ionizing radiation, the elemental abundances, the dust/gas ratio, and the column density of the emission-line clouds. Solar abundaces from Grevesse et al. (2010) were employed in all cases. The numerical abundances relative to hydrogen are as follows: He = 8.51 , C = 2.69 , O = 4.9 , N = 6.76 , Ne = 8.51 , S = 1.32 , Si = 3.24, Mg = 3.98 , and Fe = 3.16. No other values of abundances were used as no reliable indicators of that quantity exist using NIR lines. Moreover, evidence of gas with solar abundances in this source has been reported using optical and X-ray observations (Yoshida et al., 2004; Shirai et al., 2008).
The ionizing continuum employed was similar to that deduced by Mathews & Ferland (1987). It is meant to represent a typical radio-quiet AGN continuum and consists of several broken power-laws of the form with taking different values according to the wavelength range. The intrinsic luminosity of NGC 4388 above the Lyman limit, 1.26 erg s-1, was estimated by Vasudevan et al. (2013). This value is typical of Seyfert 1 nuclei (Pier et al., 1994), and was employed in all models. Clouds with densities = and cm-3 were considered at distances varying from a fraction of a parsec to 270 pc from the nucleus, covering the range of distances mapped by our observations.
Figure 12 displays the model predictions for clouds with gas density = 500 cm-3 (stars), cm-3 (full pentagons), cm-3 (full squares) and 105 cm-3 (full diamonds) for the three coronal line ratios already described at the different apertures extracted in NGC 4388. Results for clouds of = cm-3 are not shown as they produce coronal lines only for the nuclear aperture. Full triangles show the predictions for clouds of = 104 cm-3, assuming depletions of elements from gas phase with a size distribution and abundance similar to the ISM of our Galaxy. Figure 13 shows the variation of the ionization parameter with the distance from the centre for clouds of density = cm-3, = 104 cm-3 and = 105 cm-3. The symbols are the same as those displayed in Figure 12.
| Line ratio | Cloud A1 | Cloud B2 | Composite3 | Observed4 |
|---|---|---|---|---|
| [S iii]/Pa | 0.83 | 0.73 | 0.78 | 10.950.18 |
| [S viii]/Pa | 0.12 | 0.14 | 0.13 | 0.280.02 |
| [S ii]/Pa | 0.07 | 0.06 | 0.07 | 0.830.05 |
| He i/Pa | 6.44 | 7.1 | 6.8 | 4.840.11 |
| [S ix]/Pa | 0.02 | 0.01 | 0.02 | 0.190.01 |
| [Fe ii]/Pa | 0.12 | 0.0 | 0.06 | 0.460.02 |
| [Si x]/Pa | 0.06 | 0.0 | 0.03 | 0.260.01 |
| [Si vi]/Br | 2.25 | 2.89 | 2.57 | 2.510.09 |
| [Si vii]/Br | 2.8 | 4.02 | 3.41 | 4.310.11 |
| [Ca viii]/Br | 2.54 | 1.9 | 2.22 | 1.340.05 |
| [Si vii]/[Si vi] | 1.25 | 1.39 | 1.32 | 1.70.04 |
| [S ix]/[S viii] | 0.2 | 0.07 | 0.14 | 0.70.04 |
| [Si x]/[Si vi] | 0.16 | 0.0 | 0.08 | 0.550.05 |
| [Ca viii]/[Si vii] | 0.91 | 0.47 | 0.69 | 0.310.01 |
| 1 = 0.7; = 3.2 pc; = cm-3. | ||||
| 2 = -0.3; = 3.2 pc; = cm-3. | ||||
| 3 50% cloud A, 50% cloud B. | ||||
| 4 Dereddened; () = 1.810.3; Pa = 5.5 erg cm-2 s-1. | ||||
| Line ratio | Cloud A1 | Cloud B2 | Composite3 | Observed4,5 |
|---|---|---|---|---|
| [S iii]/Pa | 2.12 | 2.35 | 2.19 | 7.350.09 |
| 7.190.12 | ||||
| [S viii]/Pa | 0.15 | 0.05 | 0.14 | 0.210.02 |
| 0.20.02 | ||||
| [S ii]/Pa | 0.06 | 0.07 | 0.06 | 0.790.02 |
| 0.560.01 | ||||
| He I/Pa | 4.14 | 4.62 | 4.28 | 4.840.11 |
| 4.110.14 | ||||
| [S ix]/Pa | 0.0 | 0.0 | 0.0 | 0.210.02 |
| 0.100.01 | ||||
| [Fe ii]/Pa | 0.15 | 0.16 | 0.15 | 0.460.02 |
| 0.410.02 | ||||
| [Si vi]/Br | 3.35 | 4.0 | 3.55 | 2.110.06 |
| 2.850.11 | ||||
| [Si vii]/Br | 3.32 | 2.57 | 3.10 | 2.700.04 |
| 3.740.13 | ||||
| [Ca viii]/Br | 0.96 | 0.43 | 0.8 | 0.860.02 |
| 0.940.04 | ||||
| [Si vii]/[Si vi] | 1.0 | 0.64 | 0.89 | 1.280.04 |
| 1.310.05 | ||||
| [S ix]/[S viii] | 0.0 | 0.0 | 0.0 | 0.920.08 |
| 0.570.03 | ||||
| [Ca viii]/[Si vii] | 0.29 | 0.17 | 0.25 | 0.320.02 |
| 0.250.01 | ||||
| 1 = -0.46; = 55 pc; = 500 cm-3. | ||||
| 2 = -0.76; = 55 pc; = cm-3. | ||||
| 3 70% cloud A, 30% cloud B. | ||||
| 4 The first entry corresponds to the NE aperture while the second one | ||||
| to the SW aperture. | ||||
| 5 Dereddened; ()NE = 1.270.25; ()SW = 0.770.1. | ||||
| Pa = 2.34 erg cm-2 s-1 | ||||
| Pa = 2.31 erg cm-2 s-1. | ||||
An inspection to the [Si vii]/[Si vi] line ratio in Figure 12 shows that all models, regardless of the density, peak at a similar value of that ratio (1.4). The main difference among them is on the size of the emission region as well as on the value of the ionization parameter. High-density clouds ( cm-3) produce very compact [Si vii] and [Si vi] emission regions, peaking at the nucleus and extending only to the central few tens of parsecs. The ionization parameter for these clouds is high but still within the expected conditions of the NLR. In contrast, lower density clouds ( = 500 and cm-3) emit silicon up to distances of a few hundred of parsecs. However, in the innermost few parsecs, the ionization parameter for these later clouds is rather high, up to two orders of magnitude higher than that expected for NLR clouds.
We found that a suitable combination of clouds of density = 500, 10 and cm-3 are able to reproduce the observed values (open circles) within the central 55 pc from the nucleus. At larger distances, these clouds do not produce enough [Si vii] to sustain the large values of that ratio compatible to the observations. At 110 pc, for instance, low-density clouds ( cm-3) can account for only 30% of the observed ratio while at 160 pc and farther away, they are responsible for less than 10% of the observed values. Note that we have assumed that the clouds in all apertures are not coplanar. Therefore, no screening of one cloud by the other takes place. This warrants that all clouds are illuminated by the same AGN continuum. We also assume that the coronal lines are emitted preferencially by these clouds. This may not be the case for mid- and low-ionization lines, for which clouds not facing directly the central source may also contribute to the observed flux.
| Line ratio | Cloud A1 | Cloud B2 | Composite3 | Observed4,5 |
|---|---|---|---|---|
| [S iii]/Pa | 3 | 3.9 | 3.09 | 5.740.06 |
| 6.510.13 | ||||
| [S viii]/Pa | 0.09 | 0.0 | 0.09 | 0.170.05 |
| 0.100.01 | ||||
| [S ii]/Pa | 0.06 | 0.09 | 0.06 | 0.440.01 |
| 0.220.03 | ||||
| He I/Pa | 3.22 | 3.9 | 3.29 | 2.320.06 |
| 3.190.14 | ||||
| [S ix]/Pa | 0.0 | 0.0 | 0.0 | 0.150.03 |
| 0.080.01 | ||||
| [Fe ii]/Pa | 0.24 | 0.31 | 0.25 | 0.320.03 |
| 0.490.02 | ||||
| [Si vi]/Br | 3.6 | 2.7 | 3.51 | 2.200.14 |
| 2.820.32 | ||||
| [Si vii]/Br | 1.24 | 0.49 | 1.17 | 2.560.18 |
| 2.960.36 | ||||
| [Ca viii]/Br | 0.13 | 0.0 | 0.12 | 0.360.04 |
| 0.530.06 | ||||
| [Si vii]/[Si vi] | 0.34 | 0.18 | 0.32 | 1.160.04 |
| 1.050.2 | ||||
| [S ix]/[S viii] | 0.0 | 0.0 | 0.0 | 0.700.08 |
| 0.630.07 | ||||
| [Ca viii]/[Si vii] | 0.1 | 0.0 | 0.09 | 0.140.02 |
| 0.180.02 | ||||
| 1 = -1.06; = 110 pc; = 500 cm-3. | ||||
| 2 = -1.36; = 110 pc; = cm-3. | ||||
| 3 90% cloud A, 10% cloud B. | ||||
| 4 The first entry corresponds to the NE aperture while the second one | ||||
| to the SW aperture. | ||||
| 5 Dereddened; ()NE = 1.090.15; ()SW = 0.430.05 | ||||
| Pa = 1.44 erg cm-2 s-1 | ||||
| Pa = 1.5 erg cm-2 s-1. | ||||
CLOUDY predictions for [S ix]/[S viii] are shown in the middle panel of Figure 12. It can be seen that all models, regardless of the density, underpredict the observations. The observed extinction corrected ratio at the nucleus is 0.70.04 while clouds with = 104 cm-3 predict a ratio of 0.2. Moreover, none of the clouds considered are able to form [S ix] and [S viii] at distances larger than 55 pc and 110 pc, respectively, from the centre. This strongly contrasts with our observations, as we detect [S viii] as far as 221 pc NE and SW of the nucleus. The gas emitting [S ix] is less extended than that of [S viii] to the SW but yet it is detected up to 110 pc from the AGN. Thus, clouds with suitable physical conditions for the NLR fail at reproducing our data. It is important to mention that the values for that ratio in NGC 4388 do not appear to be unusual among AGN. For example, NGC 1068 shows sulfur coronal line ratios rather similar to those of NGC 4388 in its nuclear and extended NLR (Martins et al., 2010). Moreover, the observed sulfur ratios in NGC 4388 are also well within the distribution of values for that ratio presented by Rodríguez-Ardila et al. (2011) in their study of coronal lines in 54 AGNs. Thus, sulfur coronal line emission posses a challenge to photoionization by the central source.
Model results for [Ca viii]/[Si vii] show that clouds with cm-3 reproduce the data points at the nucleus while lower density clouds dominate the emission of highly-ionized calcium farther out. Note, however, that CLOUDY is unable to produce [Ca viii] at distances larger than 110 pc while that ion is detected up to 220 pc NE and 160 pc SW in NGC 4388. Ferguson et al. (1997) proposed the [Ca viii]/[Si vii] line flux ratio as a suitable abundance indicator. Assuming solar abundances, the models reproduce consistently the observations up to the point where [Ca viii] is theoretically produced. Optical and X-ray observations (Yoshida et al., 2004; Shirai et al., 2008) had already pointed out solar metallicity in the nucleus of NGC 4388. Our results support these previous findings.
In order to check the consistency of our results, we have compared high- mid- and low-ionization lines to hydrogen recombination lines. The results are shown in Figure 14, where eight different ratios are plotted. Observed data are represented by open circles while the models follow the same convention employed in Figure 12. A rapid inspection to Figure 14 reveals that for most coronal lines the models strongly underpredict the observations for apertures 150 pc and farther away from the centre. At these same positions low- and mid-ionization lines are well covered by CLOUDY.
It is possible, by suitably combining clouds of different physical conditions weighted by their contribution to the total flux, to fit the observed emission line ratios displayed in Figures 12 and 14 at each aperture. This multi-component approach is based on the evidence that components of different densities at the same radial distances exist in the NLR. It has been succesfully employed in the literature (Schulz & Komossa., 1993; Kraemer & Crenshaw, 2000) to model the NLR and extended NLR of AGNs. Tables 4 to 9 list the predicted line ratios at the nucleus and at the off-nuclear apertures. The composite flux was obtained after combining the output of two given pairs of models plotted in Figures 12 and 14. For simplicity, we have limited ourselves to a two-component model (named Cloud A and Cloud B) although we are aware that this is a degenerate problem, so that multiple solutions for each aperture are possible. The main goal here is to illustrate the range of physical conditions necessary to to fit the coronal and low- to mid-ionization lines.
An inspection to Table 4 shows that clouds of = 104 cm-3 and 105 cm-3, located at 3 pc from the centre, are able to reproduce the line ratios measured in the nucleus of NGC 4388. The good agreement found between model predictions and observations for most line ratios points out that photoionization by the AGN is the main source of excitiation for the nuclear gas.
Farther out, at 55 pc from the centre (see Table 5), photoionization by the AGN is still able to reproduce most of the observations. However, the density of the clouds responsible for the production of the emission lines must be lower than that in the nucleus, 103 cm-3. Indeed, a larger contribution of clouds with = 500 cm-3 (70% by weight) was found. As can be observed in Figure 14, clouds with cm-3 produce negligible or no coronal lines at all at that position. At 110 pc from the AGN, the bulk of clouds responsible for the production of high-ionization lines is dominated by low-density clouds, of 500 cm-3. This result is shown in Table 6. It can also be seen that CLOUDY underpredicts by a factor of 2-3 the observations of CLs, pointing out that either a more complex approach is needed or that photoionization by the AGN starts failing at sustaining the production of high-ionization lines. Low-ionization lines, in contrast, are well reproduced by the models. Their production are largely favored by clouds of 103 cm-3, giving further support to our results. Recall that [S iii] 9531 Å and He i 1.083 m are the strongest lines detected in all apertures.
Tables 7 to 9 show that at 166 pc and farther away from the AGN, photoionization by the central source alone is no longer able to reproduce the observations of high-ionization lines: CLOUDY predicts line ratios that are one order of magnitude smaller than the observations or it is unable to produce them. Indeed, at 221 pc, clouds with 103 cm-3 are unable to produce coronal lines while they still sustain the production of low- to mid-ionization lines. We also tested models with clouds of gas density as low as = 200 cm-3. This later value was derived by Colina (1992) from the optical [S ii] 6717,6731 doublet in NGC 4388 for a projected distance of 380 pc from the nucleus and agrees with the density found by Petitjean & Durret (1993) at a similar distance from the central source. Although such clouds do produce coronal lines, the predicted line ratio [Si vii]/[Si vi] is 0.21. That it, a factor 5 lower than observed.
| Line ratio | Cloud A1 | Cloud B2 | Composite3 | Observed4,5 |
|---|---|---|---|---|
| [S iii]/Pa | 4.2 | 6 | 4.68 | 6.350.10 |
| 5.700.09 | ||||
| [S viii]/Pa | 0.01 | 0.0 | 0.01 | 0.170.03 |
| 0.050.01 | ||||
| [S ii]/Pa | 0.08 | 0.0 | 0.10 | 0.370.05 |
| 0.640.03 | ||||
| He I/Pa | 2.8 | 3.60 | 3.04 | 1.870.04 |
| 2.320.06 | ||||
| [S ix]/Pa | 0.0 | 0.0 | 0.0 | 0.070.01 |
| [Fe ii]/Pa | 0.4 | 0.54 | 0.44 | 0.260.03 |
| 0.640.02 | ||||
| [Si vi]/Br | 2.3 | 1.20 | 1.97 | 2.550.11 |
| 1.550.06 | ||||
| [Si vii]/Br | 0.3 | 0.10 | 0.24 | 3.160.16 |
| 1.290.06 | ||||
| [Ca viii]/Br | 0.0 | 0.0 | 0.0 | 0.350.04 |
| 0.220.04 | ||||
| [Si vii]/[Si vi] | 0.16 | 0.08 | 0.14 | 1.240.06 |
| 0.830.03 | ||||
| [S ix]/[S viii] | 0.0 | 0.0 | 0.0 | 0.350.07 |
| … | ||||
| [Ca viii]/[Si vii] | 0.0 | 0.0 | 0.0 | 0.110.01 |
| 0.170.05 | ||||
| 1 = -1.42; = 166 pc; = 500 cm-3. | ||||
| 2 = -1.72; = 166 pc; = cm-3. | ||||
| 3 70% cloud A, 30% cloud B. | ||||
| 4 The first entry corresponds to the NE aperture while the second one | ||||
| to the SW aperture. | ||||
| 5 Dereddened; ()NE = 0.730.06; ()SW = 0.600.12 | ||||
| Pa = 6.84 erg cm-2 s-1 | ||||
| Pa = 10.9 erg cm-2 s-1. | ||||
| Line ratio | Cloud A1 | Cloud B2 | Composite3 | Observed4,5,6 |
|---|---|---|---|---|
| [S iii]/Pa | 5.40 | 7.40 | 6.20 | 7.170.34 |
| 5.780.16 | ||||
| [S viii]/Pa | 0.0 | 0.0 | 0.0 | 0.160.02 |
| 0.120.05 | ||||
| [S ii]/Pa | 0.10 | 0.20 | 0.14 | 0.450.12 |
| 0.340.08 | ||||
| He I/Pa | 2.53 | 3.40 | 2.88 | 1.860.07 |
| 2.220.06 | ||||
| [S ix]/Pa | 0.0 | 0.0 | 0.0 | 0.100.02 |
| … | ||||
| [Fe ii]/Pa | 0.53 | 0.80 | 0.64 | 0.400.04 |
| 0.90.09 | ||||
| [Si vi]/Br | 1.30 | 0.50 | 0.98 | 2.410.24 |
| 1.090.17 | ||||
| [Si vii]/Br | 0.10 | 0.0 | 0.06 | 3.000.29 |
| 1.090.17 | ||||
| [Ca viii]/Br | 0.0 | 0.0 | 0.0 | 0.350.08 |
| … | ||||
| [Si vii]/[Si vi] | 0.09 | 0.0 | 0.06 | 1.240.07 |
| 1.00.1 | ||||
| [S ix]/[S viii] | 0.0 | 0.0 | 0.0 | 0.390.08 |
| … | ||||
| [Ca viii]/[Si vii] | 0.0 | 0.0 | 0.0 | 0.110.01 |
| … | ||||
| 1 = -1.66; = 221 pc; = 500 cm-3. | ||||
| 2 = -1.96; = 221 pc; = cm-3. | ||||
| 3 60% cloud A, 40% cloud B. | ||||
| 4Only [Si vii], [Si vi] and [S ix] are detected to the SW at this | ||||
| position. For that reason, only [Si vii]/[Si vi] is shown. | ||||
| 5 The first entry corresponds to the NE aperture while the second one | ||||
| to the SW aperture. | ||||
| 6 Dereddened; ()NE = 0.410.09; ()SW = 0.80.3. | ||||
| Pa = 2.90 erg cm-2 s-1 | ||||
| Pa = 4.31 erg cm-2 s-1. | ||||
The inclusion of dusty clouds (although appealling for several reasons) does not help to improve the fits. The model that takes them into account, shown in Figure 12, produces too little coronal line emission that its contribution appear to be negligible in the central apertures. We also tested models with other values of densities for that type of clouds with similar results as those shown here. Ferguson et al. (1997) had already demonstrated that dust in regions of large absorbs much of the incident continuum. This greatly reduces the strength of the coronal lines, implying that they must be formed in nearly dust-free gas. Thus, under this scenario, most of the extinction affecting the observed spectra should be produced by dust located outside of the CLR.
| Line ratio | Cloud A1 | Cloud B2 | Composite3 | Observed4,5,6 |
|---|---|---|---|---|
| [S iii]/Pa | 6.61 | 8.81 | 7.05 | 6.730.15 |
| 6.640.32 | ||||
| [S viii]/Pa | 0.0 | 0.0 | 0.00 | 0.150.04 |
| … | ||||
| [S ii]/Pa | 0.13 | 0.23 | 0.15 | 0.280.06 |
| … | ||||
| He I/Pa | 2.4 | 3.23 | 2.57 | 1.720.04 |
| 2.150.12 | ||||
| [Fe ii]/Pa | 0.74 | 1.16 | 0.82 | 0.440.02 |
| 1.280.16 | ||||
| [Si vi]/Br | 0.72 | 0.2 | 0.62 | 1.690.4 |
| 0.970.2 | ||||
| [Si vii]/Br | 0.04 | 0.0 | 0.03 | 2.61.1 |
| 1.60.3 | ||||
| [Si vii]/[Si vi] | 0.06 | 0.0 | 0.05 | 1.50.51 |
| 1.60.4 | ||||
| 1 = -2.16; = 276 pc; = 500 cm-3. | ||||
| 2 = -1.96; = 276 pc; = cm-3. | ||||
| 3 80% cloud A, 20% cloud B. | ||||
| 4[Si vii], [Si vi] and [S viii] are the only CLs detected at this | ||||
| position. Thus, only line ratios involving these lines are shown. | ||||
| 5 The first entry corresponds to the NE aperture while the second one | ||||
| to the SW aperture. | ||||
| 6 Dereddened; ()NE = 0.410.09; ()SW = 0.80.3. | ||||
| Pa = 1.07 erg cm-2 s-1 | ||||
| Pa = 1.09 erg cm-2 s-1. | ||||
We should also note that the line flux ratio [Si x]/[Si vi] (or [Si x]/Pa) is strongly underestimated by the models (see Table 4). Recall that [Si x] is detected only in the nuclear aperture. For the assumed luminosity and form of the ionizing continuum, sufficient [Si x] relative to [Si vi] is produced if the emitting clouds are located 0.3 pc or closer to the AGN. That is, a factor of 10 closer to the central source than the value assumed. This implies that the bulk of [Si x] is produced in the boundaries of the broad line region and the torus. The [Si x]/[Si vi] ratio is also a robust indicator of the form of the input ionizing continuum because of the large difference in ionization potential of the lines involved (IP = 184 eV). A better fit to the observations can be obtained if the clouds emitting [Si x] are illuminated by a harder continuum than that of the other coronal lines.
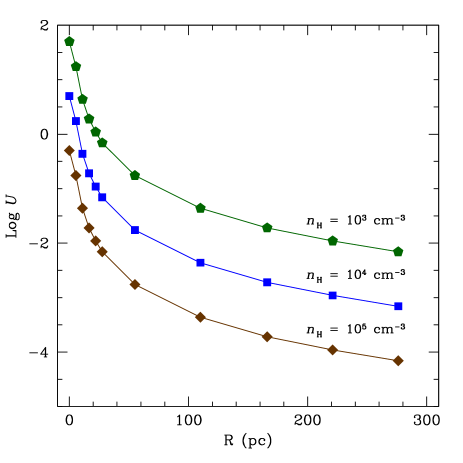
Although it is clear that photoinization by the central source accounts for most of the observed coronal line strengths not only in the nucleus but in regions as far as 110 pc away of it, at larger distances the model outputs largely underpredicts our observations. This suggests that additional mechanisms should be present to enhace the high-ionization spectrum observed. In the previous sections, we found that the high-ionization gas is primarily distributed along the elongated nuclear radio structure, tracing an outflow that extends up to 200 pc SW of the nucleus. Moreover, the presence of splitted components, such as the ones we detected in [Fe ii] evidences interaction between the radio-jet and the ambient gas. Greene et al. (2014) presented examples of [Si vi] 1.963 m emission line profiles along the ionised cone, giving additional support to this scenario. It then makes sense to consider the role of shocks produced by interactions between the radio jet or a radially accelerated outflow and the ISM to enhance the high-ionization lines strengths in the off-nuclear apertures. Note, for example, that Kraemer & Crenshaw (2000) showed the necessity of fast shocks ( 1000 km s-1) at distances larger than 100 pc from the nucleus in NGC 1068 to explain the high [Ne v] and [Fe vii] strengths relative to H measured in that object. No suitable combination of clouds powered by photoinisation by the central source could explain the observed ratios.

The models of Contini & Viegas (2001, CV01 hereafter) are useful to test the effects of shocks coupled to photoionization by the central source; even in the presence of shocks, the effect of the central continuum cannot be ignored. In their modelling, CV01 considered that the clouds are moving outwards from the galaxy centre, with the shock front forming on the outer edge of the cloud, whereas the ionizing radiation reaches the opposite edge that faces the active centre. The ionization due to both the primary radiation (from the central source) and the diffuse radiation generated by the free-free and free-bound transitions of the shocked and photoionized gas, as well as the collisional ionization, are all accounted for. The shock velocity and the ionizing flux from the central source at the Lyman limit reaching the cloud, (in units of cm-2 s-1 eV-1), are the main input parameters. Other parameters include the pre-shock density, , and the pre-shock magnetic field, .
Tables 1 to 12 of CV01 show that shock-dominated clouds ( = 0) with shock velocities in the range 300 1500 km s-1 strongly favour the production of coronal lines. They predict [Si vii]/[Si vi] ratios between 1.5 and 3 and 0.4 [S ix]/[S viii] 1 (models 56 and 70 for example). For all these clouds, solar metallicity, = 300 cm-3 and B0 = 10-4 Gauss were adopted. When coupled to the presence of the radiation field from the central source (e.g. log = 12, model 62), the value of these two ratios (0.8 and 0.1, respectively) are still consistent with our observations.
Other models that consider the effects of shocks provide additional support to the above results. Allen et al. (2008) published a library of fully radiative shock models that include both the radiative shock and its photoionized precursor. Similar to the models of CV01, the shock velocity, the pre-shock density and the intensity of the magnetic field are the main input parameters. Model predictions for the composite shock+precursor structure for the [Si vii]/[Si vi] ratio are found to vary from 0.5 to 1.2 for velocities between 500 and 1000 km s-1, respectively, and of 100 cm-3. The shock velocities are significantly higher than those found by Ciroi et al. (2003) in their modelling of the optical spectra of the SW cone of NGC 4388. Composite models that account for the combined effects of photoionization and shocks were able to reproduce the observed, high [O iii] 5007/H ratio, marginally consistent with simple photoionization.
The alignment between radio-jets and the morphology of the ionized gas has also been observed in other Seyfert galaxies by means of 3D IFU observations (Müller-Sánchez et al., 2011; Mazzalay et al., 2013; Riffel et al., 2015a, b). One example is NGC 1068, well-known for displaying a prominent radio-jet in the nuclear and circumnuclear region, with most of the NLR ionized gas following the morphology and structure of the radio-emission (Axon et al., 1998; Exposito et al., 2011; Mazzalay et al., 2013). Geballe et al. (2009) had already found enhanced coronal line emission where the radio jet changes direction, while (Mazzalay et al., 2013) showed the necessity of shocks to reproduce the enhanced coronal line ratios as far as 150 pc from the AGN. The case for NGC 4388 is not much different. The observed coronal emission follows that of the radio-jet, as observed here from our data and from Greene et al. (2014). Moreover, outflowing ionized gas has been systematically reported in this object. For the data presented here, evidence of outflowing gas is easily seen in Figure 10, when the disk rotation is subtracted from the observed velocity radial velocity measured in the coronal lines. Blueshifted gas is clearly seen in the NE while redshifted gas is detected towards the SW. The outflowing component is the largest for the high-ionization lines and enhanced towards the SW, where the extinction is significantly reduced.
We should keep in mind, though, that the shock model coupled to radiation from the central source predictions provide us with only a first-order approximation. In order to have a full description of the CL region based on model-fitting, we should suitably combine clouds under different physical conditions (i.e., clouds with different and ) with the proper weight so that the emission lines and the observed continuum can be reproduced (Contini et al., 1998, 2003; Rodríguez-Ardila et al., 2005). This is far beyond the scope of this paper and is left for a future publication. What is most important here is that we have collected solid evidence of the necessity of shocks coupled to photoinization by the AGN in order to reproduce CL flux ratios at distances as far as a few hundred parsecs, where photoionization by the central source predicts no or very faint CL emission. Unrealistic physical conditions need to be assumed for the gas if we want to explain the observed high-ionization lines in terms of only one mechanism.
6 Concluding Remarks
We have carried out the first spectroscopic analysis of the nuclear and circumnuclear region of the Seyfert 2 galaxy NGC 4388 covering simultaneously the wavelength interval 0.842.45 m, part of it never being reported in the literature. The lower sensitivy of NIR to dust allowed us to unveil the north-east region of this source, traditionally hidden at optical wavelengths, in detail and using a wide variety of emission lines both of low- and high-ionization.
Our data reveal that NGC 4388 displays an outstanding emission line spectrum with prominent lines of [S iii] 9068,9531 Å, He i 1.083 m, [Fe ii] 1.257m, Pa, H2 2.122 m, [Si vi] 1.963 m and [Si vii] 2.48 m. They all extend from the nucleus to the NE and SW ends of the slit. Along the spatial direction, the NLR gas has a complex, irregular structure, with at least two knots of emission, with the brightest one coinciding with the peak of the continuum light distribution. The asymmetry of the light profile distributions, with excess emission towards the SW compared with the NE, is most pronounced at shorter wavelengths. Some of the structures detected are seen at the first time in our data.
We determined the average extinction for the inner 560 pc of NGC 4388 from both the H i and [Fe ii] lines. The results confirm that the central regions of NGC 4388 are dusty, with the dust distributed inhomogeneously, peaking at the nucleus with an E(B-V) of 1.810.3 mag. It then decreases both to the NE and SW although it remains high mainly to the NE, consistent with the fact that this inner region is seen through the galaxy disk. To the SW at 220 pc from the nucleus we see a highly dusty region with E(B-V) reaching 0.80.3 mag.
The emission line ratios [S iii]/Pa, [Si vi]/Br and [Si vii]/Br show that in the inner 500 pc of NGC 4388 the gas distribution is highly inhomogeneous, with at least two regions of enhanced high-ionization emission lines: one in the centre, and another at 250 pc NE of the nucleus. A third peak of enhanced ionization is observed to the SW, and is evident in the [S iii]/Pa and [Fe ii]/Pa line ratios. The enhancement in ionization suggests strong interaction between the radio-jet and the circumnuclear NLR gas.
We are able to analyze the gas kinematics based on several lines of moderate to very high excitation. The results show that there is a significant parcel of gas that is not rotation-dominated and located out of the disk of the galaxy. High-ionization lines display flat PV curves, suggesting that the bulk of this emission consists of outflowing gas. Double-peak [Fe ii] lines SW of the nucleus give additional support to this picture. Only the molecular Hydrogen and the stellar component follow a rotation pattern consistent with disk rotation.
The forbidden high-ionization line spectrum observed in NGC 4388 is outstanding, not only because of the strength of the emission lines but also because of the size of the emission region where it is detected. [Si vi] and [Si vii], for example, fill up the field-of-view covered by the slit, that is, nearly 600 pc along the spatial direction. Few AGNs in the literature are reported to display such a large coronal line region. These observations cannot be explained solely as due to photoinization by radiation from the central engine. Models that consider only this excitation mechanism fail at reproducing off-nuclear line ratios. Therefore, an additional source of gas excitation must be present. Models that include the effects of shocks coupled to photoionization by the central source are able to account for the observations. This result is supported by observational evidence that suggests interactions between the radio jet and the ISM in the central few hundred parsecs of this AGN.
The picture that emerges from our observations highlights the very complex nature of the nuclear and circumnuclear region of NGC 4388. This AGN is one of the best pieces of evidence of the intricate mixture of an AGN, a radio-jet, dust and a rich ISM. Determining the precise contribution of each of these components to the observed spectrum would require observations at superior angular resolution as provided by adaptive optics and sub-arsecond observations of the radio jet with VLA.
Acknowledgments
We thank to an anonymous Referee for his/her useful comments and suggestions that helped to improve this manuscript. Based on observations obtained at the Gemini Observatory which is operated by the Association of Universities for Research in Astronomy, Inc., under a cooperative agreement with the NSF on behalf of the Gemini partnership: the National Science Foundation (United States), the National Research Council (Canada), CONICYT (Chile), the Australian Research Council (Australia), Ministério da Ciência, Tecnologia e Inovacão (Brazil) and Ministerio de Ciencia, Tecnología e Innovación Productiva (Argentina). ARA acknowledges the Conselho Nacional de Desenvolvimento Científico e Tecnológico (CNPq) for partial support to this work (grants 307403/2012-2 and 311935/2015-0). RAR acknowledges support from FAPERGS (project N0. 2366-2551/14-0) and CNPq (project N0. 470090/2013-8 and 302683/2013-5). LM thanks CNPq (grant 305291/2012-2) and FAPESP (2015/02984-3) for partial financial support. CRA is supported by a Marie Curie Intra European Fellowship within the 7th European Community Framework Programme (PIEF-GA-2012-327934). LH is supported by grant 2016YFA0400702 from the Ministry of Science and Technology of China.
References
- Allen et al. (2008) Allen, M. G., Groves, B. A., Dopita, M. A., Sutherland, R. S., & Kewley, L. J. ApJS, 178, 20
- Asari et al. (2007) Asari N. V., Cid Fernandes, R., Stasińska G., Torres-Papaqui J. P., Mateus A., et al. 2007, MNRAS, 381, 263
- Axon et al. (1998) Axon, D. J., Marconi, A., Capetti, A., Macchetto, F. D., Schreier, E., et al. 1998, ApJL, 496, 75
- Bautista et al. (2015) Bautista, M. A., Fivet, V., Ballance, C., Quinet, P., Ferland, G. J., et al. 2015, ApJS, in press.
- Bautista & Pradhan (1998) Bautista, M. A., & Pradhan, A. K. 1998, ApJ, 492, 650
- Bennert et al. (2006) Bennert, N., Jungwiert, B., Komossa, S., Hass, M., & Chini, R. 2006, A&A, 456, 953
- Bianchi et al. (2006) Bianchi, S., Guainazzi, M., & Chiaberge, M. 2006, A&A, 448, 499Vasudevan
- Cappellari & Emsellem (2004) Cappellari, M., & Emsellem, E. 2004, PASP, 116, 138
- Cardelli et al (1989) Cardelli J. A., Clayton G. C., & Mathis J. S. 1989, ApJ, 345, 245
- Cid Fernandes et al. (2004) Cid Fernandes R., González Delgado, R. M., Schmitt, H., Storchi-Bergmann, T., & Martins, L. 2004, ApJ, 605, 105
- Cid Fernandes et al. (2005a) Cid Fernandes, R., Mateus A., Sodré L., Stasi’nska G., Gomes J. M., 2005a MNRAS, 358, 363
- Cid Fernandes et al. (2005b) Cid Fernandes, R., Mateus A., Sodré L., Stasi’nska G., Gomes J. M., 2005b, MNRAS, 358, 363
- Ciroi et al. (2003) Ciroi, S., Contini, M., Rafanelli, P., & Richter, G. M. 2003, A&A, 400, 85
- Coelho (2014) Coelho, P. R. T. 2014, MNRAS, 440, 1027
- Colina (1992) Colina, L. 1992, ApJ, 386, 59
- Contini et al. (1998) Contini, M., Prieto, M. A., Viegas, S. M. 1998, ApJ, 505, 621
- Contini & Viegas (2001) Contini, M., & Viegas, S. M. 2001, ApJs, 132, 211
- Contini et al. (2003) Contini, M., Rodríguez-Ardila, A., & Viegas, S. M. 2003, A&A, 408, 101
- Corbin et al. (1988) Corbin, M. R., Baldwin, J. A., & Wilson, A. S. 1988, ApJ, 334, 584
- Emonts et al. (2005) Emonts, B. H. C., Morganti, R., Tadhunter, C. N., Oosterloo, T. A., Holt, J., et al. 2005, MNRAS, 362, 931
- Exposito et al. (2011) Exposito, J., Gratadour, D., Clénet, Y., Rouan, D. 2011, A&A, 533, 63
- Fabian (2012) Fabian, A. C. 2012, ARA&A, 50, 455
- Falcke et al. (1998) Falcke, H., Wilson, A. S., & Simpson, C. 1998, ApJ, 502, 199
- Ferguson et al. (1997) Ferguson, J. W., Korista, K. T., & Ferland, G. J. 1997, ApJs, 110, 287
- Ferland et al. (2013) Ferland, G. J., Porter, R. L., van Hoof, P. A. M., Williams, R. J. R., Abel, N. P., et al. 2013, RMxAA, 49, 137
- Forbes & Ward (1993) Forbes, D. A., & Ward, M. J. 1993, ApJ, 416, 150
- Geballe et al. (2009) Geballe, T. R.; Mason, R. E.; Rodríguez-Ardila, A.; Axon, D. J.
- Greene et al. (2013) Greene, J. E., Seth, A., den Brok, M., Braatz, J. A., Henkel, C., et al. 2013, ApJ, 771, 121
- Greene et al. (2014) Greene, J. E., Seth, A., Lyubenova, M., Walsh, J., van de Ven, G., et al. 2014, ApJ, 788, 145
- Grevesse et al. (2010) Grevesse, N., Asplund, M., Sauval, A. J., & Scott, P. 2010, Ap&SS, 328, 179
- Helou et al. (1981) Helou, G., Salpeter, E. E., & Krumm, N. 1981, ApJS, 46, 267
- Ho et al (1997) Ho, Luis C., Filippenko, A. V., Sargent, W. L. W. 1997, ApJS, 112, 315
- Hummel & Saikia (1991) Hummel, E., & Saikia, D. J. 1991, A&A, 249, 43
- Imanishi & Alonso-Herrero (2004) Imanishi, M., & Alonso-Herrero, A. 2004, ApJ, 614, 1221
- Ishibashi & Fabian (2012) Ishibashi, W., & Fabian, A. C. 2012, MNRAS, 427, 2998
- Ishibashi et al. (2013) Ishibashi, W., Fabian, A. C., & Canning, R. E. A. 2013, MNRAS, 431, 2350
- Iwasawa et al. (2003) Iwasawa, K., Wilson, A. S., Fabian, A. C., & Young, A. J. 2003, MNRAS, 345, 369
- Kraemer & Crenshaw (2000) Kraemer, S. B., & Crenshaw, D. M. 2000, ApJ, 544, 763
- Knop et al. (2001) Knop, R. A., Armus, L., Matthews, K., Murphy, T. W., & Soifer, B. T. 200, AJ, 122, 764
- Kuo et al. (2011) Kuo, C. Y., Braatz, J. A., Condon, J. J., Impellizzeri, C. M. V., Lo, K. Y., et al. 2011, ApJ, 727, 20
- Lu et al. (1993) Lu, N. Y., Hoffman, G. L., Groff, T., Roos, T., & Lamphier, C. 1993, ApJS, 88, 383
- Lutz et al. (2002) Lutz, D., Maiolino, R., Moorwood, A. F. M., Netzer, H., Wagner, S. J., et al. 2002, A&A, 396, 439
- Maraston (2005) Maraston C. 2005, MNRAS, 362, 799
- Martins et al. (2010) Martins L. P., Riffel R., Rodríguez-Ardila A., Gruenwald R., & de Souza R. 2010, MNRAS, 406, 2168
- Martins et al. (2013) Martins, L. P., Rodríguez-Ardila, A., Diniz, S., Gruenwald, R., de Souza, R. 2013, MNRAS, 431, 1823
- Mason et al. (2015) Mason, R., Rodríguez-Ardila, A., Martins, L., Riffel, R., González Martín, O., et al. 2015, ApJS, 217, 13
- Matt et al. (1994) Matt, G., Piro, L., Antonelli, L. A., Fink, H. H., Meurs, E. J. A., Perola, G. C. 1994, A&A, 292, 13
- Mathews & Ferland (1987) Mathews, W. G., & Ferland, G. J. 1987, ApJ, 323, 456
- Mazzalay & Rodríguez-Ardila (2007) Mazzalay, X., & Rodríguez-Ardila, A. 2007, A&A, 463, 445
- Mazzalay et al. (2013) Mazzalay, X., Rodríguez-Ardila, A., Komossa, S., & McGregor, P. J. 2013, MNRAS, 430, 2411
- Mazzalay et al. (2015) Mazzalay, X., Maciejewski, W., Erwin, P., Saglia, R. P., Bender, R., et al. 2015, MNRAS, 438, 2036
- Mezcua et al. (2015) Mezcua, M., Prieto, M. A., Fernández-Ontiveros, J. A., Tristram, K., Neumayer, N., et al. 2015, MNRAS, Accepted for publication, arXiv:1506.07289.
- Morganti et al. (2013) Morganti, R., Frieswijk, W., Oonk, R. J. B., Oosterloo, T., Tadhunter, C. 2013, A&A, 552L, 4
- Müller-Sánchez et al. (2011) Müller-Sánchez, F., Prieto, M. A., Hicks, E. K. S., Vives-Arias, H., Davies, R. I., et al. 2011, ApJ, 739, 69
- Oliva et al. (1994) Oliva, E., Salvati, M., Moorwood, A. F. M., Marconi, A. 1994, A&A, 291, 18
- Osterbrock & Ferland (2006) Osterbrock, D. E., & Ferland, G. J. Astrophysics of gaseous nebulae and active galactic nuclei, 2nd. ed. by D.E. Osterbrock and G.J. Ferland. Sausalito, CA. University Science Books, 2006
- Petitjean & Durret (1993) Petitjean, P., & Durret, F. 1993, A&A, 277, 365
- Phillips & Malin (1982) Phillips, M. M., & Malin, D. F. 1982, MNRAS, 199, 905
- Pier et al. (1994) Pier, E. A., Antonucci, R., Hurt, T., Kriss, G., & Krolik, J. 1994, ApJ, 428, 124
- Pogge (1988) Pogge, R. 1988, ApJ, 322, 702
- Pogge & Owen (1993) Pogge, R. W., & Owen, J. M. 1993, OSU Internal Rep. 93-01
- Ramos-Almeida et al. (2006) Ramos Almeida, C., Pérez García, A. M., Acosta-Pulido, J. A. Rodríguez Espinosa, J. M., Barrena, R., et al. 2006, ApJ, 645, 148
- Ramos-Almeida et al. (2009) Ramos-Almeida, C., Pérez Garcia, A. M., Acosta-Pulido, J. A. 2009, ApJ, 694, 1379
- (64) Rayner J. T., Cushing M. C., Vacca W. D. 2009, ApJS, 185, 289
- Reynolds & Fabian (1995) Reynolds, C. S., & Fabian, A. C. 1995, MNRAS, 273, 1167
- Riffel et al. (2006) Riffel, R., Rodríguez-Ardila, A., Pastoriza, M. G. 2006, A&A, 457, 61
- Riffel et al. (2007) Riffel, R., Pastoriza, M. G., Rodríguez-Ardila, A., Maraston, C. 2007, ApJL, 659, 103
- Riffel et al. (2009) Riffel R., Pastoriza M. G., Rodríguez-Ardila A., Bonatto C. 2009, MNRAS, 400, 273
- Riffel & Storchi-Bergmann (2011) Riffel, Rogemar A., Storchi-Bergmann, T., 2011, ApJ, 411, 469
- Riffel et al. (2013) Riffel, Rogemar A., Storchi-Bergmann, T., & Winge, C. 2013, MNRAS, 430, 2249
- Riffel et al. (2015a) Riffel, R., Mason, R. E., Martins, L. P., Rodríguez-Ardila, A., Ho, L. C., et al. 2015, MNRAS, 450, 3069
- Riffel et al. (2015b) Riffel, Rogemar A., Storchi-Bergmann, Thaisa; & Riffel, Rogério, MNRAS, 451, 3587
- Rodríguez-Ardila et al. (2005) Rodríguez-Ardila, A., Contini, M., Viegas, S. M. 2005, MNRAS, 357, 220
- Rodríguez-Ardila et al. (2006) Rodríguez-Ardila, A., Prieto, M. A., Viegas, S., Gruenwald, R. 2006, ApJ, 653, 1098
- Rodríguez-Ardila et al. (2011) Rodríguez-Ardila, A., Prieto, M. A., Portilla, J. G., & Tejeiro, J. M. 2011, ApJ, 743, 100
- Santini et al. (2012) Santini, P., Rosario, D. J., Shao, L., Lutz, D., Maiolino, R., et al. 2012, A&A, 540, 109
- Schlegel et al. (1998) Schlegel, D. J., Finkbeiner, D. P., Davis, M. 1998, ApJ, 500, 525
- Schmitt et al. (2003) Schmitt, H. R., Donley, J. L., Antonucci, R. J., Hutchings, J. B., & Kinney, A. L. 2003, ApJS, 148, 327
- Schulz & Komossa. (1993) Schulz, H., & Komossa, S. 1993, A&A, 278, 29
- Shirai et al. (2008) Shirai, H., Fukazawa, Y., Sasada, M., Ohno, M., Yonetoku, D. et al. 2008, PASJ, 60, 263.
- Stone et al. (1988) Stone, J. L. Jr., Wilson, A. S., Ward, M. J. 1988, ApJ, 330, 105
- Storchi-Bergmann et al. (2010) Storchi-Bergmann, T., Lopes, R. D. Simões, McGregor, P. J., Riffel, Rogemar A., et al. 2010, MNRAS, 402, 819
- van der Laan et al. (2013) van der Laan, T. P. R., Schinnerer, E., Böker, T., Armus, L. 2013, A&A, 560, 99
- Vasudevan et al. (2013) Vasudevan, R. V., Brandt, W. N., Mushotzky, R. F., Winter, L. M., Baumgartner, W. H, et al. 2013, ApJ, 763, 111.
- Veilleux et al. (1991) Veilleux, S. 1991, ApJ, 369, 331
- Veilleux et al. (1999) Veilleux, S., Bland-Hawthorn, J., & Cecil, G. 1999, AJ, 118, 2108
- Veilleux et al. (2001) Veilleux, S., Shopbell, P. L., & Miller, S. T. 2001, AJ, 121, 198
- Contini & Viegas (2001) Contini, M., & Viegas, S. M. 2001, ApJS, 137, 75
- Winge et al. (2000) Winge, C., Storchi-Bergmann, T., Ward, M. J., & Wilson, A. S. 2000, MNRAS, 316, 1
- Winge et al. (2009) Winge, C., Riffel, R. A., Storchi-Bergmann, T. 2009, ApJS, 185, 186
- Yoshida et al. (2002) Yoshida, M., Yagi, M., Okamura, S., Aoki, K., Ohyama, Y., et al. 2002, ApJ, 567, 118
- Yoshida et al. (2004) Yoshida, M., K., Ohyama, Y., Iye, M., Aoki, K., Kashikawa, N. et al. 2004, ApJ, 127, 90